Germline pathogenic TP53 variants predispose individuals to a high lifetime risk of developing multiple cancers and are the hallmark feature of Li-Fraumeni syndrome (LFS). Our group has previously shown that LFS patients harbor shorter plasma cell-free DNA fragmentation; independent of cancer status. To understand the functional underpinning of cfDNA fragmentation in LFS, we conducted a fragmentomic analysis of 199 cfDNA samples from 82 TP53 mutation carriers and 30 healthy TP53-wildtype controls. We find that LFS individuals exhibit an increased prevalence of A/T nucleotides at fragment ends, dysregulated nucleosome positioning at p53 binding sites, and loci-specific changes in chromatin accessibility at development-associated transcription factor binding sites and at cancer-associated open chromatin regions. Machine learning classification resulted in robust differentiation between TP53 mutant versus wildtype cfDNA samples (AUC-ROC = 0.710–1.000) and intra-patient longitudinal analysis of ctDNA fragmentation signal enabled early cancer detection. These results suggest that cfDNA fragmentation may be a useful diagnostic tool in LFS patients and provides an important baseline for cancer early detection. Here, Wong et al investigate the cell-free DNA landscape of individuals with Li-Fraumeni syndrome (LFS), a cancer predisposition, and find altered composition compared to non-LFS individuals which can be used to detect and track cancer development.
Predicting survival outcomes using cancer mutation concentration (CMC) at baseline and cycle 3 of pembrolizumab. CMC was determined using a tumor-informed bespoke approach across the trial cohort. At both baseline and cycle 3, patients were split into above- or below-median groups. Survival outcomes are shown, with hazard ratios and p-values adjusted for cohort using a Cox model. PFS analysis at cycle 3 excludes one patient who progressed before the collection of cycle 3 sample.
Multivariable analysis of OS and PFS using cancer mutation concentration (CMC) at baseline and cycle 3 of pembrolizumab. CMC was determined using a bespoke targeted approach across the trial cohort. At both baseline and cycle 3, patients were split into above- or below-median groups. Survival outcomes are shown in a multivariable analysis including cohort, PD-L1 expression, and tumor mutation burden (TMB).
Abstract Early kinetics of circulating tumor DNA (ctDNA) in plasma predict response to pembrolizumab but typically requires sequencing of matched tumor tissue or fixed gene panels. We analyzed genome-wide methylation and fragment-length profiles using cell-free methylated DNA immunoprecipitation and sequencing (cfMeDIP-seq) in 204 plasma samples from 87 patients before and during treatment with pembrolizumab from a pan-cancer phase II investigator-initiated trial (INSPIRE). We trained a pan-cancer methylation signature using independent methylation array data from The Cancer Genome Atlas to quantify cancer-specific methylation (CSM) and fragment-length score (FLS) for each sample. CSM and FLS are strongly correlated with tumor-informed ctDNA levels. Early kinetics of CSM predict overall survival and progression-free survival, independently of tumor type, PD-L1, and tumor mutation burden. Early kinetics of FLS are associated with overall survival independently of CSM. Our tumor-naïve mutation-agnostic ctDNA approach integrating methylomics and fragmentomics could predict outcomes in patients treated with pembrolizumab. Significance: Analysis of methylation and fragment length in plasma using cfMeDIP-seq provides a tumor-naive approach to measure ctDNA with results comparable with a tumor-informed bespoke ctDNA. Early kinetics within the first weeks of treatment in methylation and fragment quantity can predict outcomes with pembrolizumab in patients with various advanced solid tumors. This article is featured in Selected Articles from This Issue, p. 897
Non-negative matrix factorization identifies characteristic cancer-associated signatures of shorter fragment lengths and greater nucleosome core occupancy. (A) Genome-wide fragment lengths were used as features in a two-component non-negative matrix factorization analysis. This revealed a longer and a shorter component. The weight of the shorter was elevated in cell-free DNA of cancer patients relative to normal controls. (B) The distances of fragment ends to nucleosome centers were also used as features in two-component non-negative matrix factorization. This revealed two components with different proportions of intra-nucleosomal fragment ends. The signature with more intra-nucleosomal fragment ends was elevated in the cell-free DNA of cancer patients relative to normal controls. (C) A heatmap showing the localization of fragment ends within the nucleosome core, meaning within 50 bp of nucleosome peaks. Arranging by group and total cfMeDIP-seq score, we observe that those with higher estimated ctDNA levels demonstrated a higher fraction of read ends terminating within the nucleosome core.
Figure S11 showing comparison between uni-modal and multi-modal integration of assays
Validation of the 200 CpG signature using publicly available WGBS data. A 200 CpG signature was generated using 450K array data from TCGA PanCanAtlas. We validated this signature in publicly available data from WGBS of esophageal squamous cell carcinoma and adjacent normal tissue (GSE149608), as well as breast cancers (GSE186747). (A) A heatmap of methylation beta values of our signature sites demonstrates that the methylation signature demonstrated hypermethylation in both esophageal and breast cancers relative to adjacent normal esophageal tissue. (B) A scatter plot of mean beta values, with one point for each signature window is shown. This confirms that any differentially methylated windows were generally hypermethylated in tumor relative to normal. (C) Methylation signature scores were computed by summing the beta values across all sites for each sample. This verified that tumors demonstrated higher scores than adjacent normal tissue.
Overall survival (OS) and progression free survival (PFS) in included patients by cohort. (A) Kaplan-meier curves are shown indicating the OS and PFS of patients in five histology-specific cohorts. (B) Forest plot of the hazard ratios for each cohort in a Cox proportional hazards model, with Cohort A as the reference level.
Predicting survival outcomes using fragment length score (FLS) at baseline and cycle 3 of pembrolizumab. FLS was determined as the mean of the log2 transformed cancer-to-normal ratio of the length of each fragment in a given cfMeDIP-seq sample. At both baseline and cycle 3, patients were split into above- or below-median groups. Survival outcomes are shown, with hazard ratios and p-values adjusted for cohort using a Cox model. PFS analysis at cycle 3 excludes one patient who progressed before the collection of cycle 3 sample.
 Trevor Pugh合作论文数Department of Medical Biophysics, Temerty Faculty of Medicine, University of Toronto;Princess Margaret Cancer Centre, University Health Network;Translational Genomics Laboratory, Ontario Institute for Cancer Research44
 Derek Wong合作论文数Univ British Columbia, Pathol & Lab Med, Vancouver, BC, Canada35Kayla Marsh合作论文数32Dax Torti合作论文数32Bernard Lam合作论文数31Eric Y. Stutheit-Zhao合作论文数29
 Vallijah Subasri合作论文数University of Toronto27Ledia Brunga合作论文数26
 Anna Goldenberg合作论文数Department of Computer Science, University of Toronto;The Hospital for Sick Children;SickKids Research Institute;Vector Institute24
 Leslie E Oldfield合作论文数21
 Raymond Kim合作论文数Institute of Medical Science, Temerty Faculty of Medicine, University of Toronto;Hospital for Sick Children;Sinai Health System;University Health Network;Ontario Institute for Cancer Research;Ontario Health21Clarissa Chan合作论文数20Maia Norman合作论文数20Nadia Znassi合作论文数20Arnavaz Danesh合作论文数Univ Hlth Network, Princess Margaret Canc Ctr, Toronto, ON, Canada20
 K.M. Farncombe合作论文数20Prokopec Stephenie D合作论文数20
 David Malkin合作论文数Department of Medical Biophysics, Faculty of Medicine, University of Toronto;Division of Hematology/Oncology, Hospital for Sick Children20Johanna Wellum合作论文数19Yogi Sundaravadanam合作论文数19
 Haifan Gong合作论文数Sch Comp Sci & Engn, Sun Yat Sen Univ19Tiana Downs合作论文数18Ron Rabinowicz合作论文数18Stephanie Pedersen合作论文数18Beatrice Luu合作论文数18Jenna Eagles合作论文数18
 Wei Xu合作论文数Biostatistics Division, Dalla Lana School of Public Health, University of Toronto;Department of Biostatistics, Princess Margaret Cancer Centre;Ontario Cancer Institute18Julia A. Sobotka合作论文数17Precious Uju合作论文数17Beatriz E Lujan-Toro合作论文数17Man Carina合作论文数17
 Andrea Doria合作论文数Department of Medical Imaging, University of Toronto;Department of Diagnostic Imaging, The Hospital for Sick Children17Richard Jovelin合作论文数Center for Ecology and Evolutionary Biology;University of Oregon;Center for Ecology and Evolutionary Biology, University of Oregon17
 Lawrence Heisler合作论文数Ontario Institute of Cancer Research17
 Patrick Veit-Haibach合作论文数Department of Medical Imaging, Temerty Faculty of Medicine, University of Toronto;University Health Network15Shih Yu Cindy Yang合作论文数13
 Justin Burgener合作论文数13Nicholas Cheng合作论文数Dept Mol Genet, Univ Toronto13
 Amy Liu合作论文数Biostatistics Division, Dalla Lana School of Public Health, University of Toronto13
 Scott V. Bratman合作论文数Department of Medical Biophysics, Faculty of Medicine, University of Toronto/Adela, Inc.13
 Philip Awadalla合作论文数Department of Molecular Genetics, Temerty Faculty of Medicine, University of Toronto13
 Albiruni Ryan Abdul Razak合作论文数Department of Medicine, Temerty Faculty of Medicine, University of Toronto;Princess Margaret Cancer Centre & Mount Sinai Hospital13
 Philippe Bedard合作论文数Cancer Clinical Research Unit, Princess Margaret Cancer Centre, University Health Network;University of Toronto13
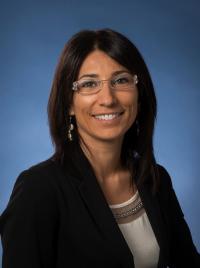 Anna Spreafico合作论文数University of Toronto;Division of Medical Oncology and Hematology, Princess Margaret Cancer Centre, University Health Network13
 Aaron Hansen合作论文数University Health Network;Royal Australasian College of Physicians Medical;University of Toronto13
 Stephanie Lheureux合作论文数Institute of Medical Science, Temerty Faculty of Medicine, University of Toronto;UHN-Princess Margaret Cancer Centre13
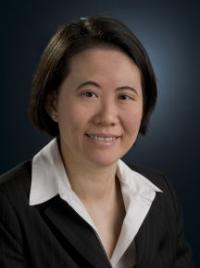 Lillian Siu (萧丽欣)合作论文数Cancer Clinical Research Unit, Princess Margaret Cancer Centre;University of Toronto;Ontario Institute for Cancer Research;Princess Margaret Hospital13
 Yong Zeng (曾勇)合作论文数13
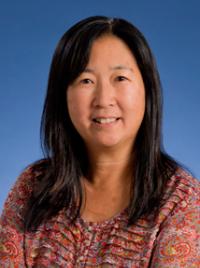 Pamela Ohashi合作论文数Department of Immunology, Faculty of Medicine, University of Toronto;Campbell Family Institute for Breast Cancer Research;Ontario Cancer Institute13




