Supplementary Table S5. Related to Fig. 1-4 and Supplementary Fig. S3. Cell populations analyzed by flow cytometry in this study.
Supplementary Figure S7: Clinical variables associated with time to hematopoietic regeneration after allogeneic transplantation at Vanderbilt.
The inhibitory effect of carvedilol on hematopoietic regeneration after allogeneic transplantation can be overcome by transplanting larger doses of BM cells. Mice were treated with carvedilol or vehicle for 7 days before and 21 days after transplantation. We transplanted 3 × 10⁵, 6 × 10⁵, 12 × 105, or 24 × 105 T cell–depleted LP/J BM cells into irradiated C57BL/Ka recipients. A–K, A total of eight to 11 recipients per treatment from three independent experiments. Each dot represents a different mouse. All data represent mean ± SD. A–C, WBC (A), RBC (B), and PLT (C) counts from carvedilol-treated (right) or vehicle-treated (left) mice 21 days after transplantation. D and E, Total BM (D) and spleen (E) cellularity. F–K, The frequencies of HSCs, MPPs, and LSK cells in the BM (F–H) and spleen (I–K). L, Survival of carvedilol-treated and vehicle-treated mice after transplantation. The numbers of mice per treatment are shown in each panel. The statistical significance of differences among treatments was assessed using two-way ANOVAs followed by Sidak multiple comparison adjustments (A–F, H, I, and K), Mann–Whitney tests followed by Holm–Sidak multiple comparisons adjustments (G and J), or log-rank Mantel–Cox tests followed by Holm–Sidak multiple comparisons adjustment (L). All statistical tests were two sided.
Supplementary Table S2. Characteristics of UTSW allogeneic transplant patients. Abbreviations: Acute myeloid leukemia (AML), acute lymphoblastic leukemia (ALL), myelodysplastic syndrome (MDS), myeloproliferative neoplasm (MPN), mixed-phenotype acute leukemia (MPAL), severe aplastic anemia (sAA), myeloablative conditioning (MAC), nonmyeloablative conditioning (NMA), reduced-intensity conditioning (RIC), matched related donor (MRD), matched unrelated donor (MUD), mismatched unrelated donor (MMUD), haploidentical (Haplo), graft-versus-host disease (GvHD), post-transplant cytoxan (PTCy), methotrexate (MTX), and cytomegalovirus (CMV). Continuous measures are shown as mean (SD), and categorical measures as percentages. A one-way ANOVA was used to compare continuous variables and a χ2 test was used to compare categorical measures.
Nonselective β-adrenergic receptor inhibitors impair hematopoietic regeneration in patients after autologous and allogeneic transplantation. A, Propensity matching for age in recipients who received autologous transplant at UTSW who were (n = 73), or were not (n = 798), treated with nonselective β-blockers. The time to neutrophil (B) and platelet (C) engraftment in matched groups (n = 73 and 219 after 1:3 matching) is shown. D, Propensity matching for age in patients who received autologous transplant at UTSW who were (n = 123), or were not (n = 675), treated with β1-selective inhibitors. The time to neutrophil (E) and platelet (F) engraftment in matched groups (n = 120 and 360 after 1:3 matching). Propensity matching for age (G) and conditioning regimen (H) in patients who received allogeneic transplant at UTSW who were (n = 14), or were not (n = 297), treated with nonselective β-adrenergic receptor inhibitors (RIC, NMA, vs. myeloablative conditioning). The time to neutrophil (I) and platelet (J) engraftment in matched groups (n = 14 and 42 after 1:3 matching). Propensity matching for age (K) and conditioning regimen (L) in patients receiving allogeneic transplant at UTSW who were treated with β1-selective inhibitors (n = 23) vs. no β-blocker (n = 274). The time to neutrophil (M) and platelet (N) engraftment in matched (n = 16 and 48 after 1:3 matching). The statistical significance of differences among groups was assessed using Student t tests. All data represent mean ± SD.
Supplementary Figure S13: Discontinuation of b blockers around the time of transplantation rescues hematopoietic regeneration.
Supplementary Figure S9: The inhibitory effect of carvedilol on hematopoietic regeneration after syngeneic transplantation can be overcome by transplanting larger doses of bone marrow cells.
Supplementary Figure S2: Metoprolol treatment did not significantly affect hematopoietic regeneration after syngeneic or allogeneic transplantation in mice.
Supplementary Figure S3: Propensity matched analysis of the effect of non-selective b adrenergic receptor inhibitors on hematopoietic regeneration in Vanderbilt patients undergoing autologous and allogeneic transplantation.
Nonselective β-blockers delay engraftment particularly when limiting numbers of cells are transplanted. A, Cell doses administered (CD34+ cells/kg) to patients receiving allogeneic HCT at UTSW and Vanderbilt. B and C, Correlation between cell dose administered and the time to PLT engraftment in patients who were (B), or were not (C), treated with nonselective β-blockers. D and E, Correlation between cell dose administered and the time to neutrophil engraftment in patients who were (D), or were not (E), treated with nonselective β-blockers. F and G, Correlation between cell dose administered and the time to PLT engraftment in patients who were treated with β1-selective inhibitors (F) vs. those not on any β-blocker (G). H and I, Correlation between cell dose administered and the time to neutrophil engraftment in patients administered β1-selective inhibitors (H) vs. those not on any β-blocker (I). Statistical significance was assessed using Student t tests (A) or bivariate analyses using Pearson correlation (B–I).
Supplementary Table S1. Characteristics of UTSW autologous transplant patients. Continuous measures are shown as mean (SD) and categorical measures as percentages. A one-way ANOVA was used to compare continuous variables, and a χ2 test was used to compare categorical measures.
Carvedilol treatment impairs hematopoietic regeneration in mice after syngeneic and allogeneic BM transplants. Mice were treated with nonselective β-blocker, carvedilol, or vehicle control for 7 days before BM transplantation and 21 days after transplantation. Each panel shows data from four independent experiments, and each dot represents a different mouse. All data represent mean ± SD. A–L, 6 × 10⁵ C57BL/Ka BM cells were syngeneically transplanted into irradiated C57BL/Ka-Thy-1.2 recipients. At 21 days after transplantation, we analyzed WBC (A), RBC (B), and PLT (C) counts; BM (D) and spleen (E) cellularity; and the frequencies of HSCs, MPPs, and LSK cells in the BM (F–H) and spleen (I–K) of carvedilol-treated (red, n = 19) and vehicle-treated (black, n = 17) mice. L, Survival of carvedilol-treated (red, n = 44) and vehicle-treated (black, n = 18) mice over time after syngeneic transplantation. M–X, 6 × 10⁵ T cell–depleted LP/J BM cells were allogeneically transplanted into irradiated C57BL/Ka-Thy-1.2 recipients. At 21 days after transplantation, we analyzed WBC (M), RBC (N), and PLT (O) counts, as well as BM (P) and spleen (Q) cellularity and the frequencies of HSCs, MPPs, and LSK cells in the BM (R–T) and spleen (U–W) of carvedilol-treated (red, n = 17) and vehicle-treated (black, n = 18) mice. X, Survival of carvedilol-treated (red, n = 44) and vehicle-treated (black, n = 20) mice over time after allogeneic transplantation. Y and Z, The number of CD41+ megakaryocytes (Y) or Gr1+ myeloid cells (Z) per field of view was counted in BM sections from carvedilol-treated (red, n = 10) and vehicle-treated (black, n = 10) mice at 13 days after transplantation. The statistical significance of differences among treatments were assessed using the Student t tests followed by Holm–Sidak multiple comparisons adjustments (A–C and M–T), matched samples two-way ANOVAs followed by Holm–Sidak multiple comparisons adjustments (D, E, I–K, Y, and Z), Student or Welch’s t tests followed by Holm–Sidak multiple comparisons adjustments (F–H), Mann–Whitney tests followed by Holm–Sidak multiple comparisons adjustments (U–W), or log-rank Mantel–Cox tests (L and X). All statistical tests were two sided.
Supplementary Figure S12: Infection, graft-versus-host disease, and causes of death in Vanderbilt allogeneic HCT recipients.
Supplementary Figure S5: Clinical variables associated with time to hematopoietic regeneration after allogeneic transplantation at UTSW.
The use of nonselective β-blockers after transplantation is associated with worse clinical outcomes. A and B, Kaplan–Meier estimates of OS in patients receiving allogeneic HCT at UTSW who were, or were not, taking nonselective β-blockers (A) or β1-selective inhibitors vs. no β-blocker (B). One- and two-year OS (in years) is shown. C, The HR for OS in patients receiving allogeneic HCT at UTSW was estimated using a Cox proportional hazards model. D and E, Kaplan–Meier estimates of nonrelapse mortality (NRM) in patients receiving allogeneic HCT at UTSW who were, or were not, taking nonselective β-blockers (D) or β1-selective inhibitors vs. no β-blocker (E). F, The HR for NRM in patients receiving allogeneic HCT at UTSW was estimated using a Cox proportional hazards model. G and H, Kaplan–Meier estimates of OS in patients receiving allogeneic HCT at Vanderbilt who were, or were not, taking nonselective β-blockers (G) or β1-selective inhibitors vs. no β-blocker (H). I, The HR for OS in patients receiving allogeneic HCT at Vanderbilt was estimated as in C. J and K, Kaplan–Meier estimates of NRM in patients receiving allogeneic HCT at Vanderbilt who were, or were not, taking nonselective β-blockers (J) or β1-selective inhibitors vs. no β-blocker (K). L, The HR for NRM in patients receiving allogeneic HCT at Vanderbilt was estimated as in F. OS and NRM were compared between groups using a log-rank test (A, B, D, E, G, H, J, and K). For the Cox proportional hazards models (C, F, I, and L), covariates included age, conditioning regimen, nonselective β-blocker use, and β1-selective inhibitor use. The HR ± 95% confidence interval is shown, and the dashed vertical line represents a HR of 1.0.
BACKGROUND:Isocitrate dehydrogenase inhibitors (IDHi) for IDH-mutated acute myeloid leukemia (AML) are important treatment options for older adults in whom treatment-related toxicities are a major concern. Long-term data on IDHi are limited. METHODS:We conducted a single-center retrospective study of patients aged ≥ 65 years with newly diagnosed or relapsed/refractory IDH-mutated AML who received ivosidenib or enasidenib for ≥ 2 continuous years and either achieved complete remission (CR) or initiated therapy in CR as maintenance. RESULTS:Nine patients were identified with median treatment duration of 6.88 years (range: 1.94-8.87). Median age at IDHi initiation was 71 years (range: 65-84); 44% were ≥ 75 years. Six patients (67%) had IDH1 mutations and 3 (33%) had IDH2 mutations. Median number of mutated genes per patient was 4 (range: 1-6). There were no mutations in the receptor tyrosine kinase pathway. Four patients began IDHi at diagnosis, 3 upon relapse, and 2 as maintenance following first CR. No differentiation syndrome occurred. Seven patients (78%) remain on IDHi and in CR; both who relapsed had antecedent myeloid neoplasms. At median follow-up of 6.88 years (range: 2.62-8.87), median event-free survival (EFS) and overall survival (OS) were not reached. Five-year EFS and OS were 78% (95% CI: 55-100) and 88% (95% CI: 67-100), respectively. CONCLUSIONS:This selected real-world cohort demonstrates durable responses exceeding published benchmarks and has one of the longest follow-up periods reported for IDHi in AML. A subset of older adults with IDH-mutated AML can achieve highly durable remissions on IDHi without significant toxicity.
Supplementary Figure S8: Hematopoietic stem and progenitor cell frequencies after allogeneic transplantation.
Supplementary Figure S11: Infection, graft-versus-host disease, and causes of death in UTSW allogeneic HCT recipients.
The use of nonselective β-blockers is an independent risk factor for delayed hematopoietic regeneration after allogeneic transplantation. The risk factor coefficients (B) for increased time to neutrophil (A) and platelet (B) engraftment among patients undergoing autologous HCT at UTSW, neutrophil (C) and PLT (D) engraftment among patients undergoing allogeneic HCT at UTSW, neutrophil (E) and PLT (F) engraftment among patients undergoing autologous HCT at Vanderbilt, and neutrophil (G) and PLT (H) engraftment among patients undergoing allogeneic HCT at Vanderbilt. A generalized linear model was used, with covariates including age, β1-selective inhibitor use, and nonselective β-blocker use for all cohorts. For patients receiving allogeneic HCT, other covariates included conditioning regimen [myeloablative conditioning (MAC) or RIC/NMA]; underlying disease [for UTSW lymphoid or myeloid, for Vanderbilt acute myeloid leukemia (AML), chronic myeloid leukemia (CML), myeloproliferative neoplasm (MPN), or myelodysplastic syndrome (MDS)]; cell dose (CD34+ cells/kg); cell source [BM or peripheral blood (PB)]; donor matching [matched related/matched unrelated donor (MRD/MUD), mismatched unrelated donor (MMUD), or haploidentical (Haplo)]; acute GvHD; and myelosuppressive GvHD treatment [methotrexate (MTX) or posttransplant Cytoxan (PTCy)]. Patients at UTSW also included splenomegaly and CMV infection as covariates, and patients at Vanderbilt included CMV serostatus (low risk = donor−/recipient−; intermediate risk = donor+/recipient+ or −; high risk = donor−/recipient+). B reflects the number of additional days required for neutrophil or PLT engraftment per unit of each predictive variable, with units being per year for age and binary (yes/no) for all other variables. B ± 95% confidence interval is shown. The dashed vertical line represents B of 0.
 Yazan F Madanat合作论文数93
 Stephen Chung合作论文数Department of Surgery, Faculty of Medicine, The University of British Columbia51Patel Prapti A合作论文数51
 PRAVEEN RAMAKRISHNAN GEETHAKUMARI合作论文数Department of Pharmacology and Experimental Therapeutics (CD),, Thomas Jefferson University;Department of Internal Medicine, Albert Einstein Healthcare Network (PRG);Cancer Center, Albert Einstein Healthcare Network;Center for Health Promotion and Prevention Research, University of Texas School of Public Health;University of Texas School of Public Health, Thomas Jefferson University43
 Larry D Anderson合作论文数40Vusirikala Madhuri合作论文数36
 Eytan M. Stein合作论文数David H. Koch Center for Cancer Care, Memorial Sloan Kettering Cancer Center35Farrukh T. Awan合作论文数Arthur G. James Cancer Hospital, Ohio State University35Weina Chen合作论文数34Gurbakhash Kaur合作论文数30
 Brian J. Druker合作论文数Knight Cancer Institute, School of Medicine, Oregon Health & Science University29
 Afrough Aimaz合作论文数28
 Ashwin Kishtagari合作论文数Department of Medicine, Vanderbilt University School of Medicine27
 Lohith Gowda合作论文数Department of Internal Medicine, Yale School of Medicine, Yale University27Wenhuo Hu合作论文数27Zhiyu Zhao合作论文数27Ronan T Swords合作论文数24
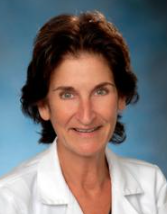 Maria R. Baer合作论文数School of Medicine, University of Maryland24William Blum合作论文数24
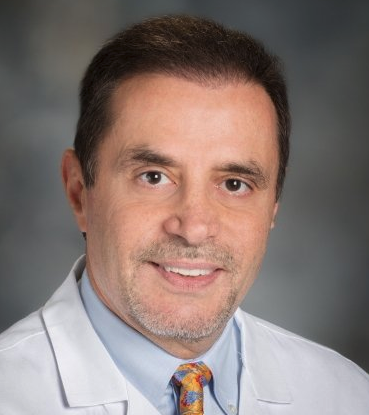 Hagop M. Kantarjian合作论文数Department of Leukemia, Division of Cancer Medicine, The University of Texas MD Anderson Cancer Center23Mims Alice S合作论文数Hollings Cancer Center, Medical University of South Carolina23
 Bo Shen (沈博)合作论文数National Institute of Biological Sciences, Beijing;Tsinghua Institute of Multidisciplinary Biomedical Research, Tsinghua University23
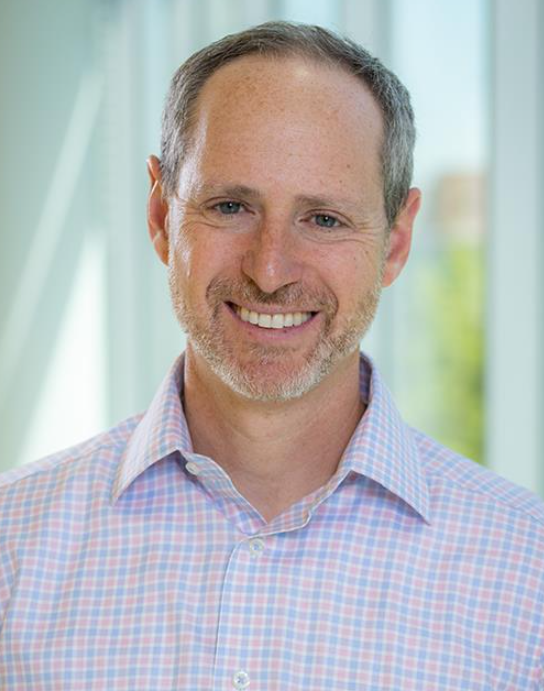 Dan Pollyea合作论文数Division of Hematology, Department of Medicine, University of Colorado School of Medicine22
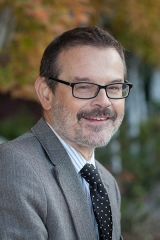 Michael W. N. Deininger合作论文数Huntsman Cancer Institute, University of Utah;Department of Internal Medicine, School of Medicine, University of Utah21
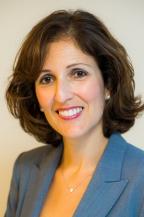 Gail J. Roboz合作论文数Weill Cornell Medical College20Tara Lin合作论文数20James M. Foran合作论文数20
 Elie Traer合作论文数Department of Oncological Sciences;Departments of Intermit Medicine;Human Genetics Â;Departments of Intermit Medicine|Human Genetics, Department of Oncological Sciences20Mona Stefanos合作论文数19
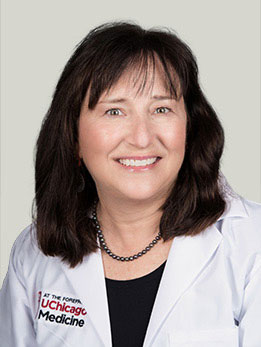 Wendy Stock合作论文数Department of Medicine, University of Chicago;Comer Children's Hospital;Duchossois Center for Advanced Medicine, The University of Chicago Medical Center19
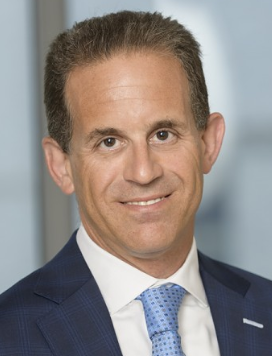 Ross L. Levine合作论文数Memorial Sloan Kettering Cancer Center;Ajax Therapeutics;QIAGEN19Borate Uma合作论文数19
 Gary J. Schiller合作论文数Division of Hematology, School of Medicine, University of California19
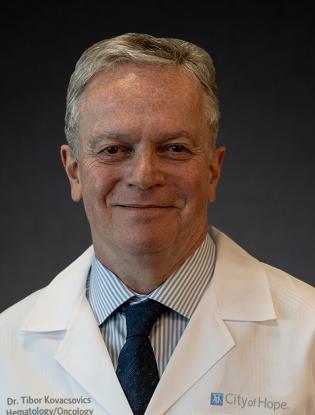 Tibor Kovacsovics合作论文数Department of Hematology & Hematopoietic Cell Transplantation, City of Hope19Leonard Rosenberg合作论文数18
 Nyla Heerema合作论文数Cytogenetics Lab, Ohio State University18Rebecca L. Olin合作论文数18
 Martha Lucia Arellano合作论文数18Martin S. Tallman合作论文数18
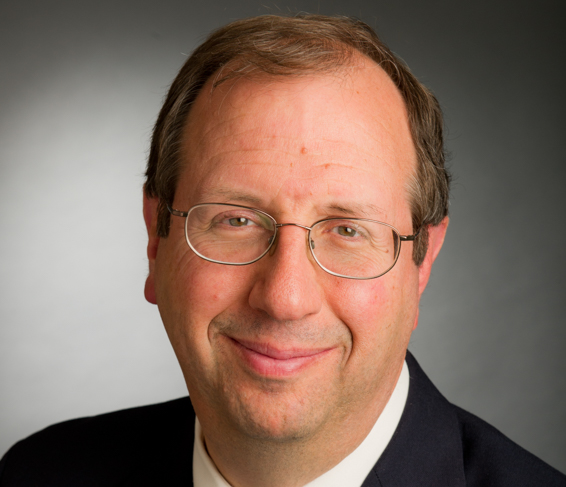 Richard M. Stone合作论文数Dana-Farber Cancer Institute;Harvard Medical School17Sonja Marcus合作论文数16
 Heather Reves合作论文数16
 Stéphane de Botton合作论文数Institut Gustave Roussy16
 Courtney DiNardo合作论文数Department of Leukemia, The University of Texas MD Anderson Cancer Center16Chen Timothy L合作论文数16
 John C. Byrd合作论文数College of Medicine, University of Cincinnati16
 Jeffrey W. Tyner合作论文数Knight Cancer Institute, School of Medicine, Oregon Health & Science University16Adeel Khan合作论文数14
 Fieke Hoff合作论文数Dept Internal Med, UT Southwestern Med Ctr14




