In recent years, Geoscience Australia has undertaken a successful continental-scale validation program, targeting Landsat and Sentinel analysis-ready data surface reflectance products. The field validation model used for this program was successfully built upon earlier studies, and the measurement uncertainties associated with these protocols have been quantified and published. As a consequence, the Australian earth observation community was well-prepared to respond to the United States Geological Survey (USGS) call for collaborators with the 2021 Landsat 8 (L8) and Landsat 9 (L9) underfly. Despite a number of challenges, seven validation datasets were captured across five sites. As there was only a single 100% overlap transit across Australia, and the country was amidst a strong La Niña climate cycle, it was decided to deploy teams to the two available overpasses with only 15% side lap. The validation sites encompassed rangelands, chenopod shrublands, and a large inland lake. Apart from instrument problems at one site, good weather enabled the capture of high-quality field data allowing for meaningful comparisons between the radiometric performance of L8 and L9, as well as the USGS and Australian Landsat analysis-ready data processing models. Duplicate (cross-calibration) spectral sampling at different sites provides evidence of the field protocol reliability, while the off-nadir view of L9 over the water site has been used to better compare the performance of different water and atmospheric correction processing models.
Abstract. Suitable measures of grazing impacts on ground cover, that enable separation of the effects of climatic variations, are needed to inform land managers and policy makers across the arid rangelands of Australia. This work developed and tested a time-series, changepoint detection method for application to time series of vegetation fractional cover derived from Landsat data to identify irregular and episodic ground-cover growth cycles. Utilising the High Performance Computing power of the Google Cloud Compute Engine these cycles were segmented to distinguish grazing impacts from that of climate variability. A measure of grazing impact was developed using a multivariate technique to quantify the rate and degree of ground cover change. The method was successful in detecting both long term and short term growth cycles. Growth cycle detection was assessed against rainfall surplus measures indicating a relationship with high rainfall periods. During periods of ground cover decline, grazing utilisation was observed across four major grasslands. Ground cover change associated with grazing impacts was also assessed against field measurements of ground cover indicating a relationship between both field and remotely sensed ground cover. Cause and effects between grazing practices and ground cover resilience can now be explored in isolation to climatic drivers. This is important to the long term balance between ground cover utilisation and overall landscape function and resilience.
This paper presents a Bayesian mixture model approach for detecting areas of habitat that are suitable for S. invicta infestation, aiding the ongoing surveillance for early detection of these exotic pests. We show that Landsat imagery is an affordable and valuable tool to assist in determining an informed surveillance strategy. In this paper, we use Landsat band 3 (visible red), Landsat band 6 (mid infrared) and a soil brightness index, in various combinations, to assess the probability that the area associated with each pixel is habitable terrain, either in a multivariate analysis, or as a univariate spatial temporal model. The multivariate analysis allows researchers to create meaningful clusters that reflect the sometimes complex combinations of conditions of conditions that form suitable habitat, rather then relying on single derived indices.
ABSTRACTThis paper reconstructs past flooding from a range of settings in Lockyer Creek, a key tributary of the mid‐Brisbane River, which experienced extreme flood events in AD 2011 and AD 2013. Optically stimulated luminescence samples (n = 110) were collected from alluvial material preserved in within‐channel benches and floodplains. Age distributions from material in the bedrock reaches confirm an event ∼ 300 years ago which stripped the valley alluvium to bedrock. In the unconfined reaches floodplain deposits indicate lateral stability over the past 6000 years. Marked differences in the inundation patterns of the AD 2011 event highlighted changes in downstream channel geometry. The age distribution of alluvium in reaches not inundated during AD 2011 was older, ∼12 000 years, with no preserved evidence of deposition during the past 1000 years. A relatively continuous record of floodplain deposition in reaches which were inundated in AD 2011 identifies a major peak in flood activity also around 300 years ago (∼AD 1730) with five additional peaks occurring at approximately AD 1962, AD 1897, AD 1300, AD 550 and 5400 BC. The main climatic driver of changes in flooding over this timescale is oscillations in El Niño Southern Oscillation and although proxy records are scarce for this region, some correlations with high‐resolution records of rainfall variability are apparent.
Crop extent and frequency maps are an important input to inform the debate around land value and competitive land uses, in particular between cropping and mining in the case of Queensland, Australia. Such spatial datasets are useful for supporting decisions on natural resource management, planning and policy. For the major broadacre cropping regions of Queensland, Australia, the complete Landsat Time Series (LTS) archive from 1987 to 2015 was used in a multi-temporal mapping approach, where spatial, spectral and temporal information were combined in multiple crop-modelling steps, supported by training data sampled across space and time for the classes Crop and No-Crop. Temporal information within summer and winter growing seasons were summarised for each year, and combined with various vegetation indices and band ratios computed from a pixel-based mid-season spectral synthetic image. All available temporal information was spatially aggregated to the scale of image segments in the mid-season synthetic image for each growing season and used to train a number of different predictive models for a Crop and No-Crop classification. Validation revealed that the predictive accuracy varied by growing season and region and a random forest classifier performed best, with κ = 0.88 to 0.91 for the summer growing season and κ = 0.91 to 0.97 for the winter growing season, and are thus suitable for mapping current and historic cropping activity.
State Government agencies in northern and eastern Australia and the University of Queensland, Brisbane, have been collaborating through the Joint Remote Sensing Research Program (JRSRP). This has resulted in a significant acceleration in the development and successful operational application of remote sensing methods for the JRSRP members and the various state and national programs and policies which they support. The JRSRP provides an open and collaborative mechanism and governance structure to successfully bring together a unique combination of expertise in image processing, field data collection, and data integration approaches to deliver accurate, repeatable and robust methods for mapping and monitoring Australia's unique ecosystems. Remote sensing provides spatially- And temporally-comprehensive information about land cover features at a range of scales and often for minimal cost compared to traditional mapping and monitoring approaches. This makes remote sensing a very useful operational mapping and monitoring tool for land managers, particularly in the vast rangelands of Australia. This paper outlines recent developments in remote sensing and modelling products that are being used operationally by JRSRP members to address large area landcover understanding.
A growing body of field, theoretical and numerical modelling studies suggests that predicting river response to even major changes in input variables is difficult. Rivers are seen to adjust rapidly and variably through time and space as well as changing independently of major driving variables. Concepts such as Self-Organized Criticality (SOC) are considered to better reflect the complex interactions and adjustments occurring in systems than traditional approaches of cause and effect. This study tests the hypothesis that riverbank mass failures which occurred both prior to, and during, an extreme flood event in southeast Queensland (SEQ) in 2011 are a manifestation of SOC. Each wet-flow failure is somewhat analogous to the avalanche' described in the initial sand-pile experiments of Bak et al. (Physical Review Letters, 1987, 59(4), 381-384) and, due to the use of multitemporal LiDAR, the time period of instability can be effectively constrained to that surrounding the flood event. The data is examined with respect to the key factors thought to be significant in evaluating the existence of SOC including; non-linear temporal dynamics in the occurrence of disturbance events within the system; an inverse power-law relation between the magnitude and frequency of the events; the existence of a critical state to which the system readjusts after a disturbance; the existence of a cascading processes mechanism by which the same process can initiate both low-magnitude and high-magnitude events. While there was a significant change in the frequency of mass failures pre- and post-flood, suggesting non-linear temporal dynamics in the occurrence of disturbance events, the data did not fit an inverse power-law within acceptable probability and other models were found to fit the data better. Likewise, determining a single critical' state is problematic when a variety of feedbacks and multiple modes of adjustment are likely to have operated throughout this high magnitude event. Overall, the extent to which the data supports a self-organized critical state is variable and highly dependent upon inferential arguments. Investigating the existence of SOC, however, provided results and insights that are useful to the management and future prediction of these features. Copyright (c) 2014 John Wiley & Sons, Ltd.
Shrubs are an important component of vegetation throughout the world. They are particularly significant in semiarid environments where they can dominate, driving ecosystem structure and functioning, and shaping land use. Life-history information was derived for Eremophila sturtii R.Br. and Dodonaea viscosa subsp. angustissima J.G.West, two widespread and common shrubs of semiarid eastern Australia. Plants growing under background climatic conditions took between 2 and 4 years to become established, attained the capacity to reproduce sexually at between 10 and 12 years, were in a sexually reproductive stage for between 17 and 28 years and lived an average maximum of 33–40 years. Under background climatic conditions between 70 and 80% of plants that entered the juvenile stage survived to sexual maturity while under severe drought this proportion fell to between 40 and 60%. Juvenile plants, particularly of E. sturtii, experienced the highest mortality under background conditions while, when exposed to severe drought, older plants, particularly D. viscosa subsp. angustissima in the intermediate stage, experienced the greatest increase in mortality, dying at more than twice the background rate. The high survival rates of E. sturtii and D. viscosa subsp. angustissima shown here, even under extreme drought conditions and in grazed- and ungrazed areas, help to explain why these shrub species have been observed to dominate vegetation in large areas of eastern Australia.
A dynamic reference-cover method and remotely-sensed ground cover were used to determine the change in the state of ~640 000 km2 of rangelands in Queensland at a sub-bioregional scale between 1988 and 2005. The method is based on persistence of ground cover in years of lower rainfall and objectively separates grazing effects on ground cover from those due to inter-annual variation in rainfall. The method is applied only to areas where trees and shrubs were not cleared. An indicator of rangeland state was derived, at Landsat-TM pixel resolution, by subtracting automatically-calculated reference ground cover from actual ground cover and then spatially averaging these deviations across the area of each sub-bioregion. Landscape heterogeneity may affect reference cover but, because it is stable over time, change in mean cover deficit between sequences of dry years reliably indicates change due to grazing. All 34 sub-regions analysed had similar or increased levels of seasonally-adjusted ground cover at the end of the analysis period, which was either 2003 or 2005. Allowing for possible landscape heterogeneity effects on assessed condition, the Einasleigh Uplands bioregion was comparatively in a better state and those analysed parts of the Mulga Lands bioregion in poorer state at the first assessment in 1988. Most sub-regions of the Cape York Peninsula, Brigalow Belt North, Desert Uplands, Gulf Plains and Mitchell Grass Downs bioregions lay between these two end-states. Simulated levels of pasture utilisation based on modelled pasture growth and statistically-based grazing pressure supported the results of this regional assessment of land condition. The dynamic reference-cover method will allow the Queensland Government to monitor future grazing effects on rangeland ground cover between sequences of drier years – quantitatively and efficiently across the entire state. The method can potentially be adapted to other rangeland jurisdictions where a suitable multi-temporal database of remotely sensed ground cover exists. The results from further analyses of remotely sensed ground cover will be reported through the Australian Collaborative Rangelands Information System.
PySSM is a Python package that has been developed for the analysis of time series using linear Gaussian state space models. PySSM is easy to use; models can be set up quickly and efficiently and a variety of different settings are available to the user. It also takes advantage of scientific libraries NumPy and SciPy and other high level features of the Python language. PySSM is also used as a platform for interfacing between optimized and parallelized Fortran routines. These Fortran routines heavily utilize basic linear algebra and linear algebra Package functions for maximum performance. PySSM contains classes for filtering, classical smoothing as well as simulation smoothing.
Abstract Stream bank condition is an important physical form indicator for streams related to the environmental condition of riparian corridors. This research developed and applied an approach for mapping bank condition from airborne light detection and ranging (LiDAR) and high-spatial resolution optical image data in a temperate forest/woodland/urban environment. Field observations of bank condition were related to LiDAR and optical image-derived variables, including bank slope, plant projective cover, bank-full width, valley confinement, bank height, bank top crenulation, and ground vegetation cover. Image-based variables, showing correlation with the field measurements of stream bank condition, were used as input to a cumulative logistic regression model to estimate and map bank condition. The highest correlation was achieved between field-assessed bank condition and image-derived average bank slope ( R 2 = 0.60 , n = 41 ), ground vegetation cover ( R 2 = 0.43 , n = 41 ), bank width/height ratio ( R 2 = 0.41 , n = 41 ), and valley confinement (producer’s accuracy = 100 % , n = 9 ). Cross-validation showed an average misclassification error of 0.95 from an ordinal scale from 0 to 4 using the developed model. This approach was developed to support the remotely sensed mapping of stream bank condition for 26,000 km of streams in Victoria, Australia, from 2010 to 2012.
A Bayesian approach is developed to analyze change points in multivariate time series and space-time data. The methodology is used to assess the impact of extended inundation on the ecosystem of the Gulf Plains bioregion in northern Australia. The proposed approach can be implemented for dynamic mixture models that have a conditionally Gaussian state space representation. Details are given on how to efficiently implement the algorithm for a general class of multivariate time series and space-time models. This efficient implementation makes it feasible to analyze high dimensional, but of realistic size, space-time data sets because our approach can be appreciably faster, possibly millions of times, than a standard implementation in such cases.
The 20+ year collection and moderate resolution of Landsat Thematic Mapper (TM) imagery and Enhanced Thematic Mapper (ETM+) imagery provide a crucial data source for analysing land surface change over time for a range of applications. In Queensland, Australia, a number of government policies, natural resource management programmes and research activities are reliant on large-area, multi-temporal land cover monitoring applications based on Landsat satellite imagery. However, clouds and associated cloud shadows frequently obstruct the view of the land surface. The restriction of analyses to cloud-free imagery will reduce the opportunities to sample the land surface and limit the analysis of trends in reflectance over time. This study presents a new automated method to screen cloud and cloud shadow and is intended for application to entire time series of Landsat imagery rather than single images processed in near- real time. The method uses a hierarchical approach and takes advantage of spectral, temporal, and contextual information. Outliers are located relative to the time series of land surface reflectance by smoothing time series information using minimum and median filters which are then used in multi-temporal image differencing. Seeded region grow and morphological dilation (pixel buffering) filters are then applied to map a larger spatial extent of the cloud/cloud shadow. Spectral and contextual rules were developed empirically using calibration and validation data derived from six Landsat WRS Path/Rows (number of images=60) with varying climatic and land surface characteristics across the state of Queensland, Australia. The validation demonstrates that cloud contaminated pixels were accurately classified with producer's, user's and overall accuracies of 98, 87 and 97%, respectively. The ability to detect cloud shadow was less accurate, in comparison, with producer's, user's and overall accuracies of 90, 62 and 97%, respectively. The pixel buffer was found to be the largest source of commission error for cloud and cloud shadow in the final classifications. However, for many applications removing additional cloud/shadow at the expense of higher commission errors may be desirable. The performance of the method was also compared with the published Fmask (Function of mask) method. This demonstrated a moderate improvement in the detection of cloud (producer's accuracies: time series 98% and Fmask 90%; and an equivalent user's accuracy of 87%), and a significant improvement in the detection of cloud shadow (producer's accuracies: time series 90% and Fmask 78%; user's accuracies: time series 62% and Fmask 50%). Importantly, the results indicate that this automated method is robust and that temporal information can improve the detection of cloud and cloud shadow, although shadow detection above cropping areas is limited. The calibration/validation of the method has been restricted to Queensland, Australia. With further development there is potential for this method or one using a similar framework to have wider application in other landscapes.
Recent work suggests that gully erosion is the main contributor of sediments to the Great Barrier Reef, Australia. The objectives of this study were to identify the location of gullies as well as the landscape characteristics associated with gully presence in the Burdekin Catchment. Data were collected by random sampling using Google Earth. A spatial-statistical analysis allowed the exclusion of areas where gullies were less likely to be present. The remaining gully sensitive areas were then manually mapped by using Google Earth, assisting in the creation of a predictive map. A semi-quantitative gully presence map was also created by visually inspecting imagery at 5 km x 5 km grid cell scale. Results show a strong relationship between gully presence and drainage features, low tree cover and low slopes. The resulting predictive map has correctly allocated more than 90% of gullies within less than 20% of the Burdekin's area, yet uncertainties still remain. The manually derived mapping product comprises the most comprehensive gully data available for the Burdekin, while the high-resolution predictive map and the 5 km x 5 km grid map will allow better targeting of gullied areas in later stages of this research. This study also provides a methodology that can be applied to mapping gullies over extensive areas. It demonstrates how Google Earth could be used as a reliable platform for mapping gullies and discusses the limitations in the use of remotely sensed data for gully mapping and modelling.
Advances in remote sensing and digital terrain processing now allow for a sophisticated analysis of spatial and temporal changes in erosion and deposition. Digital elevation models (DEMs) can now be constructed and differenced to produce DEMs of Difference (DoD), which are used to assess net landscape change for morphological budgeting. To date this has been most effectively achieved in gravel-bed rivers over relatively small spatial scales. If the full potential of the technology is to be realised, additional studies are required at larger scales and across a wider range of geomorphic features. This study presents an assessment of the basin-scale spatial patterns of erosion, deposition, and net morphological change that resulted from a catastrophic flood event in the Lockyer Creek catchment of SE Queensland (SEQ) in January 2011. Multitemporal Light Detection and Ranging (LiDAR) DEMs were used to construct a DoD that was then combined with a one-dimensional flow hydraulic model HEC-RAS to delineate five major geomorphic landforms, including inner-channel area, within-channel benches, macrochannel banks, and floodplain. The LiDAR uncertainties were quantified and applied together with a probabilistic representation of uncertainty thresholded at a conservative 95% confidence interval. The elevation change distribution (ECD) for the 100-km2 study area indicates a magnitude of elevation change spanning almost 10m but the mean elevation change of 0.04m confirms that a large part of the landscape was characterised by relatively low magnitude changes over a large spatial area. Mean elevation changes varied by geomorphic feature and only two, the within-channel benches and macrochannel banks, were net erosional with an estimated combined loss of 1,815,149m3 of sediment. The floodplain was the zone of major net deposition but mean elevation changes approached the defined critical limit of uncertainty. Areal and volumetric ECDs for this extreme event provide a representative expression of the balance between erosion and deposition, and importantly sediment redistribution, which is extremely difficult to quantify using more traditional channel planform or cross-sectional surveys. The ability of LiDAR to make a rapid and accurate assessment of key geomorphic processes over large spatial scales contributes to our understanding of key processes and, as demonstrated here, to the assessment of major geomorphological hazards such as extreme flood events.
Remote detection of management-related trend in the presence of inter-annual climatic variability in the rangelands is difficult. Minimally disturbed reference areas provide a useful guide, but suitable benchmarks are usually difficult to identify. We describe a method that uses a unique conceptual framework to identify reference areas from multitemporal sequences of ground cover derived from Landsat TM and ETM+ imagery. The method does not require ground-based reference sites nor GIS layers about management. We calculate a minimum ground cover image across all years to identify locations of most persistent ground cover in years of lowest rainfall. We then use a moving window approach to calculate the difference between the window's central pixel and its surrounding reference pixels. This difference estimates ground-cover change between successive below-average rainfall years, which provides a seasonally interpreted measure of management effects. We examine the approach's sensitivity to window size and to cover-index percentiles used to define persistence. The method successfully detected management-related change in ground cover in Queensland tropical savanna woodlands in two case studies: (1) a grazing trial where heavy stocking resulted in substantial decline in ground cover in small paddocks, and (2) commercial paddocks where wet-season spelling (destocking) resulted in increased ground cover. At a larger scale, there was broad agreement between our analysis of ground-cover change and ground-based land condition change for commercial beef properties with different a priori ratings of initial condition, but there was also some disagreement where changing condition reflected pasture composition rather than ground cover. We conclude that the method is suitably robust to analyse grazing effects on ground cover across the 1.3×10⁶km2 of Queensland's rangelands.
Markov chain Monte Carlo (MCMC) estimation provides a solution to the complex integration problems that are faced in the Bayesian analysis of statistical problems. The implementation of MCMC algorithms is, however, code intensive and time consuming. We have developed a Python package, which is called PyMCMC, that aids in the construction of MCMC samplers and helps to substantially reduce the likelihood of coding error, as well as aid in the minimisation of repetitive code. PyMCMC contains classes for Gibbs, Metropolis Hastings, independent Metropolis Hastings, random walk Metropolis Hastings, orientational bias Monte Carlo and slice samplers as well as specific modules for common models such as a module for Bayesian regression analysis. PyMCMC is straightforward to optimise, taking advantage of the Python libraries Numpy and Scipy, as well as being readily extensible with C or Fortran.
Cropping activity has an importance that extends beyond farming communities, to governments, private industries, and to scientific research. We have developed a remote sensing-based method to detect arable cropping activity in central and southern Queensland, Australia, based on time series analysis of the NDVI layer of MODIS-Terra MOD13Q1 (250-m pixel) imagery. Local auto-regression was used to characterise phenological cycles in the NDVI time series. A random forest was then used to model three broad classes of agricultural vegetation (Grazing, Summer Cropping and Winter Cropping), as a function of phenological metrics and the local variance of the NDVI time series. The latter was found to be the most important distinguishing factor between the three classes. Pixel-by-pixel predictions of the random forest were obtained bi-annually for the study area over a 10-year period. Moderate agreement was seen between the predictions of the random forest and (independent) visual interpretation of Landsat imagery (Cohen's index of agreement, κc, of 0.59). We then demonstrated how the random forest's predictions can be used to define the consistency of cropping activity at the spatial scale of an individual farm property; when compared with (independent) visual interpretation of Landsat imagery the agreement was also moderate (κc = 0.68). In comparison with other crop-mapping approaches in the literature, our results have been achieved: (i) without restricting the method to annual NDVI time series; (ii) without assuming that the time series is regularly spaced and periodic; (iii) by considering only the 'greening-up’ phase of the phenological cycles.
Crop mapping and time series analysis of agronomic cycles are critical for monitoring land use and land management practices, and analysing the issues of agro-environmental impacts and climate change. Multi-temporal Landsat data can be used to analyse decadal changes in cropping patterns at field level, owing to its medium spatial resolution and historical availability. This study attempts to develop robust remote sensing techniques, applicable across a large geographic extent, for state-wide mapping of cropping history in Queensland, Australia. In this context, traditional pixel-based classification was analysed in comparison with image object-based classification using advanced supervised machine-learning algorithms such as Support Vector Machine (SVM). For the Darling Downs region of southern Queensland we gathered a set of Landsat TM images from the 2010–2011 cropping season. Landsat data, along with the vegetation index images, were subjected to multiresolution segmentation to obtain polygon objects. Object-based methods enabled the analysis of aggregated sets of pixels, and exploited shape-related and textural variation, as well as spectral characteristics. SVM models were chosen after examining three shape-based parameters, twenty-three textural parameters and ten spectral parameters of the objects. We found that the object-based methods were superior to the pixel-based methods for classifying 4 major landuse/land cover classes, considering the complexities of within field spectral heterogeneity and spectral mixing. Comparative analysis clearly revealed that higher overall classification accuracy (95%) was observed in the object-based SVM compared with that of traditional pixel-based classification (89%) using maximum likelihood classifier (MLC). Object-based classification also resulted speckle-free images. Further, object-based SVM models were used to classify different broadacre crop types for summer and winter seasons. The influence of different shape, textural and spectral variables, and their weights on crop-mapping accuracy, was also examined. Temporal change in the spectral characteristics, specifically through vegetation indices derived from multi-temporal Landsat data, was found to be the most critical information that affects the accuracy of classification. However, use of these variables was constrained by the data availability and cloud cover.
 Kerrie Mengersen合作论文数15
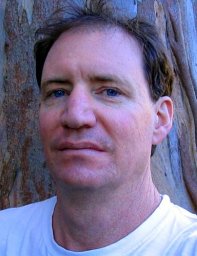 Peter Scarth合作论文数Queensland Department of Natural Resources and Water, Remote Sensing Centre8
 Ian W Turner合作论文数Faculty of Science, School of Mathematical Sciences, Queensland University of Technology6christian witte合作论文数5
 Daniel Simpson合作论文数.txt5
 Stuart Phinn合作论文数School of the Environment, Faculty of Science, The University of Queensland5Chris M. Strickland合作论文数5
 Christopher Strickland合作论文数Department of Mathematics, Colorado State University4
 Jacky Croke合作论文数Division of Archaeology and Natural History, R.S.P.A.S.4d tindall合作论文数3Witte, C.合作论文数3
 Rakhesh Devadas合作论文数Plant Functional Biology and Climate Change Cluster, University of Technology, Sydney3M.J. Pringle合作论文数3
 John Armston合作论文数Department of Geographical Sciences, University of Maryland3
 Chris Thompson合作论文数3Nicholas R. Goodwin合作论文数2Dan Tindall合作论文数2Ashneel Sharma合作论文数2Jason Barnetson合作论文数2
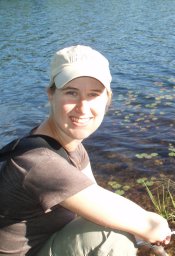 Heather A Haines合作论文数Chronos 14 Carbon Cycle Facil, Univ New South Wales2
 Clair L. Alston-Knox合作论文数Griffith Univ2Neil Flood合作论文数2
 Trevor Moffiet合作论文数2
 James Grove合作论文数Department of Resource Management and Geography, The University of Melbourne;eWater Cooperative Research Centre;eWater Cooperative Research Centre, The University of Melbourne2Michael Schmidt合作论文数Deutsches Zentrum fur Luft- Und Raumfahrt2Ashley D. Sparrow合作论文数2Gary N. Bastin合作论文数2Matthew G Falk合作论文数2Lisa Collett合作论文数2
 Tim Pietsch合作论文数Black Mountain Laboratories, CSIRO Land and Water2
 Robert L. Burdett合作论文数2Samantha Low Choy合作论文数1Eric Haÿ合作论文数1charles l witte合作论文数1Tim Danaher合作论文数1Christian Witte合作论文数1Nathan Drayson合作论文数1Guy Byrne合作论文数1
 N Cronin合作论文数1
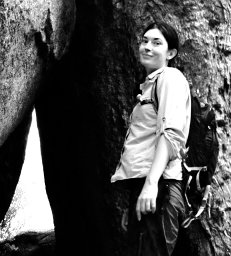 Jasmine Muir合作论文数School of Environment and Earth Sciences Joint Remote Sensing Research Program University of Queensland St Lucia Queensland 4072 Australia1
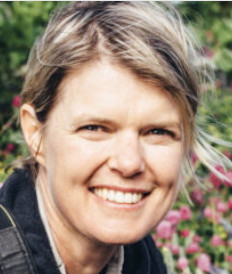 Tara Martin合作论文数Department of Forest & Conservation Sciences, Faculty of Forestry, The University of British Columbia1
 Peter Todd合作论文数Department of Neurology, Medical School, University of Michigan;Michigan Neuroscience Institute, University of Michigan1Danaher, T.合作论文数1Tickle, P.K.合作论文数1Lee, A.合作论文数1
 Garcia Rodrigo A合作论文数Remote Sensing and Satellite Research Group, Curtin University1O'Leary Rebecca A合作论文数1
 Broomhall Mark合作论文数1




