We propose that the natural rate of unemployment may have an active role in the business cycle, in contrast to a widespread view that the rate is fairly smooth and at most only weakly cyclical. We demonstrate that the tendency to treat the natural rate as near-constant would explain the surprisingly low slope of the Phillips curve. We observe that evidence is weak about this basic point-the evidence neither comes close to rejecting the conventional view nor does it reject a very different view in which fluctuations in the natural rate are associated with a substantial fraction of cyclical volatility. We show that the natural rate may have closely tracked the actual rate during the long recovery that began in 2009 and ended in 2019. We explain how the common finding of research in the Phillips-curve framework of low - often extremely low - response of inflation to unemployment could be the result of fairly close tracking of the natural rate and the actual rate in recoveries. Our interpretation of the data contrasts to that of many Phillips-curve studies, that conclude that inflation has little relation to unemployment.
We propose that the natural rate of unemployment has an active role in the business cycle, in contrast to the prevailing view that the rate is essentially constant. We demonstrate that this tendency to treat the natural rate as near-constant would explain the surprisingly low slope of the Phillips curve. We show that the natural rate closely tracked the actual rate during the long recovery that began in 2009 and ended in 2020. We explain how the common finding of research in the Phillips-curve framework of low-often extremely low-response of inflation to unemployment could be the result of fairly close tracking of the natural rate and the actual rate in recoveries. Our interpretation of the data contrasts to that of most Phillips-curve studies, that conclude that inflation has little relation to unemployment. We suggest that the at Phillips curve is an illusion caused by assuming that the natural rate of unemployment has little or no movement during recoveries.
The US and other advanced countries suffered bursts of severe inflation in 2021 and the first half of 2022, followed by declines of inflation later in 2022, in some countries. In times of high volatility of price determinants—cost and productivity—inflation can jump upward and fall downward at high speed, contrary to the uniformly sticky behavior associated with traditional Phillips curves. This paper establishes that sectors with standard New Keynesian price stickiness are vulnerable to rapid transitions from stickiness to flexibility, as sellers elect to reset their prices and abandon anchoring. The paper shows that the cross-industry volatility of price determinants grew substantially in the inflation episode accompanying the pandemic. Volatility remained elevated even in late 2022. The logic of the New Keynesian model of the Phillips curve links inflation to volatility, because a larger fraction of sellers are pushed out of their regions of inaction when volatility is elevated. The New Keynesian Phillips curve becomes much steeper in volatile times.Institutional subscribers to the NBER working paper series, and residents of developing countries may download this paper without additional charge at www.nber.org.
Unemployment recoveries in the US have been inexorable. Between 1949 and 2019, the annual reduction in the unemployment rate during cyclical recoveries was tightly distributed around 0.1 log points per year. The economy seems to have an irresistible force toward restoring full employment. Unless another crisis intervenes, unemployment continues to glide down to a level of approximately 3.5 percentage points. Occasionally unemployment rises rapidly during an economic crisis, while most the time, unemployment declines slowly and smoothly at a near-constant proportional rate. We show that similar properties hold for other measures of the US unemployment rate and for the unemployment rates of six other advanced countries.
We develop a simple flexible-price model of business cycles driven by spikes in risk premiums. Aggregate shocks increase firms’ uninsurable idiosyncratic risk and raise risk premiums. We show that risk shocks can create quantitatively plausible recessions, with contractions in employment, consumption, and investment. Business cycles are inefficient—output, employment, and consumption fall too much during recessions, compared to the constrained-efficient allocation. Optimal policy involves stimulating employment and consumption during recessions.
A remarkable fact about the historical US business cycle is that, after unemployment reached its peak in a recession, and a recovery begins, the annual reduction in the unemployment rate is stable at around one tenth of the current level of unemployment. We document this fact in a companion paper, Hall and Kudlyak (2020a). Here, we consider explanations for the surprising consistency of recoveries. We show that the evolution of the labor market from recession to recovery involves more than the direct effect of persistent unemployment of job-losers from the recession shock -- unemployment during the recovery is above normal for people who did not lose jobs during the recession. We explore models of the labor market's self-recovery that imply gradual working off of unemployment following a recession shock. We emphasize the feedback from high unemployment to the forces driving job creation. These models also explain why the recovery of market-wide unemployment is so much slower than the rate at which individual unemployed workers find new jobs. The reasons include the fact that the path that individual job-losers follow back to stable employment often includes several brief interim jobs.
Potential workers are classified as unemployed if they seek work but are not working. The unemployed population contains two groups---those with jobs and those without jobs. Those with jobs are on furlough or temporary layoff. This group expanded tremendously in April 2020. They wait out periods of non-work with the understanding that their jobs still exist and that they will be recalled. We show that the resulting temporary-layoff unemployment dissipates quickly following a spike. Potential workers without jobs constitute what we call jobless unemployment. Shocks that elevate jobless unemployment have much more persistent effects. Historical major adverse shocks, such as the financial crisis in 2008, created mostly jobless unemployment and consequently caused extended periods of elevated unemployment. The pandemic of 2020 created a large volume of temporary-layoff unemployment, mostly starting in April. It was mostly dissipated by the end of 2020. It also created a bulge in jobless unemployment.
The views expressed herein are those of the authors and do not necessarily represent the views of the Federal Reserve Bank of Richmond or the Federal Reserve System. We thank Eric LaRose and Sara Ho for outstanding research assistance.Using U.S. NETS data, we present evidence that the positive trend observed in national product-market concentration between 1990 and 2014 becomes a negative trend when we focus on measures of local concentration. We document diverging trends for several geographic definitions of local markets. SIC 8 industries with diverging trends are pervasive across sectors. In these industries, top firms have contributed to the amplification of both trends. When a top firm opens a plant, local concentration declines and remains lower for at least 7 years. Our findings, therefore, reconcile the increasing national role of large firms with falling local concentration, and a likely more competitive local environment.
On the occasion of the fiftieth anniversary of the Brookings Panel on Economic Activity, I review the extensive body of research that has appeared in the BROOKINGS PAPERS ON ECONOMIC ACTIVITY (BPEA) on the labor market. Much of the research deals with unemployment, a topic of great interest in macro- economic analysis and policy. I trace the evolution of modern economic analysis of unemployment and the major contributions relating to unemployment in the pages of the Brookings Papers. I also review a number of important contribu- tions to other aspects of labor economics that are part of the BPEA legacy.
Unemployment fell at a slow and steady rate in the 10 cyclical recoveries from 1949 through 2019. These historical patterns also apply to the recovery from the pandemic recession after accounting for the unprecedented burst of temporary layoffs early in the pandemic followed by their rapid reversal from April to November 2020. Unemployment for other reasons—which has been most important in other recent recoveries—did not start declining until November 2020. Since then, unemployment for other reasons has declined at a faster pace than its historical average.
We study the paths over time that individuals follow in the labor market, as revealed in the monthly Current Population Survey. Some people face much higher flow values from work than in a non-market activity; if they lose a job, they find another soon. Others have close to equal flow values and tend to circle through jobs, search, and non-market activities. And yet others have flow values for non-market activities that are higher than those in the market, and do not work. We develop a model that identifies and quantifies heterogeneity in dynamic individual behavior. Our model provides a bridge between research on monthly transition rates in the tradition of Blanchard and Diamond (1990) and research on economic dynamics in the tradition of Mortensen and Pissarides (1994). Our estimates discern 5 distinct types. Most unemployment comes from just two of those types. Low employment types frequently circle among unemployment, short-term jobs, and being out of the labor market. Short-term jobs play a role in the job-finding process related to the role of unemployment. These are stop-gap jobs for high-employment types and a part of circling for low-employment types. Because of their high job-finding rates, and despite their low flow values of non-work relative to work, the volatility of the future lifetime value that high-employment types derive from work and non-work is lower than for low-employment types.
This note develops a framework for thinking about the following question: What is the maximum amount of consumption that a utilitarian welfare function would be willing to trade off to avoid the deaths associated with the pandemic? The answer depends crucially on the mortality rate associated with the coronavirus. If the mortality rate averages 0.81%, taken from the Imperial College London study, our answer is 41% of one year's consumption. If the mortality rate instead averages 0.44% across age groups, our answer is 28%.
The notion that confidence varies over the business cycle has an important and growing role in macroeconomic theory. The volatility of the stock market, investment, and unemployment seems hard to understand without a powerful force that affects the willingness of investors to defer consumption to build plants, equip them, and create jobs. Though Keynes argued that confidence had a key role in the Great Depression and other manifestations of the business cycle, the idea that confidence mattered had received diminished attention in modern macroeconomics until the financial crisis of 2008. I develop a model suitable for understanding how the collapse of confidence influences key macro variables.The collapse enters the model as a large increase in the utility discounts of investor-consumers. The model matches three important events following the crisis: the sharp rise in unemployment, the large decline in investment, and the almost perfect stability of nondurables and services consumption, 61 percent of GDP. ∗This research was supported by the Hoover Institution. It is part of the Economic Fluctuations and Growth Program of the National Bureau of Economic Research. Complete backup for all of the calculations and data sources will be available from my website, stanford.edu/∼rehall
 Susan E. Woodward合作论文数9alvin rabushka合作论文数7
 Marianna Kudlyak合作论文数University of Rochester7
 Charles I. (Chad) Jones合作论文数Graduate School of Business, Stanford University/National Bureau of Economic Research6
 Dale Jorgenson合作论文数Department of Economics, Faculty of Arts and Sciences, Harvard University6Steven Landefeld合作论文数5Mary Batcher合作论文数5Marie Brodeur合作论文数5Cynthia Z. F. Clark合作论文数5Glenn D. White合作论文数5William C. Dunkelberg合作论文数5Constance F. Citro合作论文数5marc lieberman合作论文数5Joan G. Naymark合作论文数5Nancy J. Kirkendall合作论文数5
 Ger Snijkers合作论文数5
 Chad Syverson合作论文数Booth School of Business, The University of Chicago5Katharine G. Abraham合作论文数5
 David H. Papell合作论文数Department of Economics, University of Houston5
 Kaye Husbands Fealing合作论文数National Science Foundation5
 Kristen Olson合作论文数Department of Sociology, College of Arts and Sciences, University of Nebraska-Lincoln;Bureau of Sociological Research5
 Richard Valliant合作论文数University of Maryland5
 David Marker合作论文数Marker Consulting, LLC5Andreas I. Mueller合作论文数4
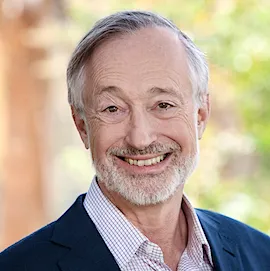 Paul R. Milgrom合作论文数Department of Economics, Stanford University;Stanford Graduate School of Business, Stanford University4
 Ricardo Reis合作论文数Department of Economics, London School of Economics and Political Science4
 John B. Taylor合作论文数Hoover Institution, Stanford University;Department of Economics, School of Humanities and Sciences, Stanford University;Introductory Economics Center, Stanford University4
 Joseph Farrell合作论文数Department of Economics, Graduate School, University of California, Berkeley3
 Richard Schmalensee合作论文数Sloan School of Management, Massachusetts Institute of Technology3
 Bronwyn H. Hall合作论文数Department of Economics, College of Letters & Science, University of California, Berkeley;Centre De L'économie De L'innovation, College De France;Institute for Fiscal Studies3Robert W. Hahn合作论文数Council of Economic3
 Peter Cramton合作论文数Department of Economics, University of Maryland3
 Thomas Hazlett合作论文数University of California3
 Knut Anton Mork合作论文数University of California3
 Robert S. Pindyck合作论文数Sloan School of Management, Massachusetts Institute of Technology3
 Alan Krueger合作论文数Survey Research Center, Princeton University3
 Shane Greenstein合作论文数Harvard Business School, Harvard University3Alfred E. Kahn合作论文数3David M. Lilien合作论文数3Harvey Galper合作论文数2Robert G. Harris合作论文数2Robert E. Litan合作论文数2Janusz A. Ordover合作论文数2Joseph A. Pechman合作论文数2Howard Shelanski合作论文数2
 Guido Menzio合作论文数Department of Economics, College of Arts & Science, New York University2
 Fernando Alvarez合作论文数Kenneth C. Griffin Department of Economics, The University of Chicago2
 Paul N. Courant合作论文数Gerald R. Ford School of Public Policy, University of Michigan2John R. Mayo合作论文数Research Institute, Vancouver Coastal Health2




