As the oasis area in the city, urban park plays an extremely prominent role in the regulation and improvement of the urban ecological environment, especially the local thermal environment, and has become one of the significant ways to reduce the urban heat island (UHI) effect. Our study comprehensively considers the maximum cooling distance and spatial continuity of urban parks, takes 30 parks in Hangzhou, and analyzed their influencing factors to comprehensively explore the park cooling effect. The results showed that the land cover shifted drastically during 2000–2020, and the built-up land area increased greatly, which aggravated the UHI effect. The high UHI value of Hangzhou was concentrated in the city center and presented a spreading trend from north to south. Different types of urban parks presented different cold island effects, with comprehensive parks and ecological parks having the largest cooling area, and community parks exhibit better accumulative cooling effect. In addition, the park’s own characteristics (perimeter, area, shape index) and inner and surrounding landscapes were significantly correlated with the park’s cooling effect (park cooling area and park cooling efficiency). Our study comprehensively considered the cooling effect of parks from the maximum and accumulative perspectives and provides theoretical and practical guidance for the construction and planning of urban parks, thereby enhancing the well-being of urban residents.
Coastal wetlands provide various ecological functions but are threatened by land reclamation and urbanization, which cause wetland degradation and loss. Understanding wetland transition trends and driving factors is challenging. Here, we used the Environmental Kuznets curve (EKC) to analyze the relationship between coastal wetlands, as classified by the Google Earth Engine (GEE), and socio-economic indicators along the East China Sea. Structural equation modeling (SEM) was used to explore the driving factors. We found that the (1) wetland transition depended on geomorphic units and socio-economic development; (2) wetland area changes from 1985 to 2020 had a typical EKC pattern and can be divided into three periods due to policy changes; and (3) economic development and urbanization were the primary reasons for wetland changes, with a strong correlation between natural wetland area, GDP per capita, and impervious surface, but a lower correlation with aquacultural area.
Land surface temperature (LST) retrieved from moderate resolution or downscaled from coarse thermal infrared (TIR) data is one of key environment parameters. Over the last four decades, most advanced remote sensing sensors/systems can acquire TIR data at a low spatial resolution but high temporal resolution. However, per different application purposes, both high spatial and temporal resolution TIR data are needed. Given that many investigations on downscaling LST (DLST) processes have been done and findings have been reported in the literature, it necessitates to have an updated review on DLST investigations of the status, trends, and challenges and to recommend future directions. An overview is provided on various polar orbits and geostationary orbits' satellite TIR sensors/systems and on scaling factors' determination and selection techniques/methods suitable for DLST processes. Existing various techniques/methods for DLST processes are presented and assessed, and limitations and future research directions are identified and recommended. In this review, several concluding remarks were made, including (1) most investigations on DLST processes used coarse spatial resolution but high temporal resolution MODIS TIR data; (2) compared to fusion-based method, the kernel-driven processes are the most frequently used thermal downscaling methods; (3) machine-learning methods have demonstrated their excellent performance and robustness in improving DLST accuracy; (4) more advanced spatiotemporal fusion-based methods consider synergic powers by combining a kernel-driven process with a fusion-based process method. The three future research directions for DLST processes are recommended: further reducing uncertainties of DLST results, developing novel DLST models and algorithms, and directly reducing the spatial scaling effect in DLST processes.
Urbanization is advancing rapidly across the globe, and urban agglomeration (UA) has become an important by-product of urbanization expansion. The rapid development of UAs has profound impacts on land use and directly affects various regional ecosystem services (ES). Understanding these impacts in UAs with developed economies and fragile ecosystems can help decision-makers formulate ecological protection and land use planning policies. Here, we selected 13 UAs in eastern, central, and western China and analyzed the characteristics of spatiotemporal changes in built-up land and the trade-off and synergy between ES in UAs from 2000 to 2020. We found that the built-up land increased rapidly to the outer edge of a city in the form of edge expansion, which was more prominent in UAs at national and regional scales. Carbon storage, biodiversity conservation, habitat quality, soil and water conservation, and water conservation tended to decrease, but the nutrition delivery ratio and food supply tended to increase. Various ES presented a negative synergistic relationship. The difference in ES in UAs was closely related to the level of urbanization and geographical location. Our findings demonstrate the trade-off and synergy of ES in UAs at different levels and can be used to sustain ES and develop high-quality UAs.
Known as the “lung of the planet”, the Amazon rainforest produces more than 20% of the Earth’s oxygen. Once a carbon pool for mitigating climate change, the Brazilian Amazônia Biome recently has become a significant carbon emitter due to increasingly frequent wildfires. Therefore, it is of crucial importance for authorities to understand wildfire dynamics to manage them safely and effectively. This study incorporated remote sensing and spatial statistics to study both the spatial distribution of wildfires during 2019 and their relationships to 15 environmental and anthropogenic factors. First, broad-scale spatial patterns of wildfire occurrence were explored using kernel density estimation, Moran’s I, Getis-Ord Gi*, and optimized hot spot analysis (OHSA). Second, the relationships between wildfire occurrence and the environmental and anthropogenic factors were explored using several regression models, including Ordinary Least Squares (OLS), global (quasi) Poisson, Geographically-weighted Gaussian Regression (GWGR), and Geographically-weighted Poisson Regression (GWPR). The spatial analysis results indicate that wildfires exhibited pronounced regional differences in spatial patterns in the vast and heterogeneous territory of the Amazônia Biome. The GWPR model outperformed the other regression models and explained the distribution and frequency of wildfires in the Amazônia Biome as a function of topographic, meteorologic, and environmental variables. Environmental factors like elevation, slope, relative humidity, and temperature were significant factors in explaining fire frequency in localized hotspots, while factors related to deforestation (forest loss, forest fragmentation measures, agriculture) explained wildfire activity over much of the region. Therefore, this study could improve a comprehensive study on, and understanding of, wildfire patterns and spatial variation in the target areas to support agencies as they prepare and plan for wildfire and land management activities in the Amazônia Biome.
Studying an ecological restoration zoning process under the background of ecological security patterns is of great significance to the rapid adjustment and optimization of a landscape pattern.In this study,a remote sensing ecological index and a morphological spatial pattern analysis method were used to assess the quality of habitats and identify ecological sources in the city of Ningbo;ecological corridors,ecological pinch points,and ecological barrier points were extracted by using a circuit theory to construct ecological security patterns and ecological res-toration zones.The results indicate:(1)There were 47 ecological sources,and 83 key ecological corridors in Ningbo,and the ecological land area was about 1898.39 km2,accounting for 19.89%of the total study area.(2)The ecological source areas were distributed in"one patch and three belts",and the low-resistance ecological corridors were concentrated in southern Yuyao city,western Haishu district,and central and western Fenghua district;the ecological network in the western and southern regions was dense.(3)There were four types of ecological restoration zones that need to be established,which were prioritized restoration zones,prioritized protection zones,key conservation zones,and general conservation zones distributed hierarchically from inner part towards outside.(4)Ninghai county,Yuyao city,and Fenghua district had large eco-logical land areas,however,prioritized restoration and protection zones in Ninghai and Fenghua were also large.The analysis results are expected to provide a reference for optimizing a terri-torial ecological space in a city.
There exists a scaling error in currently downscaled land surface temperature (DLST) processes and it is necessary to develop substantial methods specially for reducing it. In this letter, a multiple regional correction (MRC) approach with multiple correction terms (mCTs) was proposed to correct scaling errors in DLST processes. The test results indicate that: 1) the proposed approach can effectively correct the scaling effects in DLST processes at high resolutions by reducing root mean square error by −55% and 2) all initial resolutions considered for optical data (0.5–4 m) were effective for developing the MRC approach with mCTs in correcting the scaling errors. Overall, this novel approach can significantly improve the accuracy of DLST maps at very high resolutions.
By evaluating the stability of coastal wetland ecosystems, health conditions of regional ecosystems can be revealed and the sustainable development of coastal wetlands can be promoted. Coastal wetlands have been scarcely involved in present ecosystem stability evaluation studies, these being performed with relatively simple evaluation data sources. Therefore, in this research, a comprehensive and representative ecosystem stability evaluation index system was constructed by using the pressure-state-response model and multi-source datasets from perspectives of internal and external environmental changes of the Yancheng coastal wetlands, Jiangsu, China. The analysis results indicated that: (1) The ecosystem stability of the Yancheng coastal wetlands was at an early warning stage, and all segments except the Binhai segment (relatively stable) were in an early warning state. (2) In the criterion layer, the Dafeng District and the whole Yancheng District were faced with the highest pressure, followed by the Dongtai, Xiangshui and Binhai segments, successively. The Sheyang segment reached the highest state level, followed by the Binhai, Xiangshui and Dafeng segments in succession. (3) In the factor layer, the whole Yancheng District was faced with high resource and socioeconomic double pressures, with a poor water quality state and relatively low environmental pressure; favorable soil, biological and landscape states; and positive response to wetland protection. Various factors varied from county to county. (4) In the index layer, the ecosystem stability of the Yancheng coastal wetlands was significantly influenced by the invasion of alien species, change rate of natural wetland area (D32), change rate of artificial wetland area, increment of aquafarm area, intensity of fertilizer application and coverage of dominant vegetations. The novel significance of this research lies in enriching global coastal wetlands ecosystem stability evaluation investigations by providing a typical case study.
Aquaculture has enormous potential for ensuring global food security and has experienced rapid growth globally. Thus, the accurate monitoring and mapping of coastal aquaculture ponds is necessary for the sustainable development and efficient management of the aquaculture industry. Here, we developed a map of coastal aquaculture ponds in China using Google Earth Engine (GEE) and the ArcGIS platform, Sentinel-1 SAR image data for 2020, the Sentinel-1 Dual-Polarized Water Index (SDWI), and water frequency obtained by identifying the special object features of aquaculture ponds and postprocessing interpretation. Our map had an overall accuracy of 93%, and we found that the coastal aquaculture pond area in China reached 6937 km2 in 2020. The aquaculture pond area was highest in Shandong, Guangdong, and Jiangsu Provinces, and at the city level, Dongying, Binzhou, Tangshan, and Dalian had the most aquaculture pond area. Aquaculture ponds had spatial heterogeneity; the aquaculture pond area in north China was larger than in south China and seaside areas had more pond area than inland regions. In addition, aquaculture ponds were concentrated near river estuaries, coastal plains, and gulfs, and were most dense in the Huang-Huai-Hai Plain and Pearl River Delta. We showed that GEE cloud processing and ArcGIS local processing could facilitate the classification of coastal aquaculture ponds, which can be used to inform and improve decision-making for the spatial optimization and intelligent monitoring of coastal aquaculture, with certain potential for spatial migration.
The first flowering date (FFD) is a critical phenological parameter closely related to the apple yield, so the ac-curate prediction of the FFD is important for precise orchard production management. Existing methods to predict the FFD are mostly based on air temperature (Ta) measured at meteorological stations, but to great differences in meteorological variations and the ecological conditions, these methods cannot present the dif-ferences of FFD under complex meteorological conditions and provide spatially continuous FFD information at the level of a region. Therefore, we propose a method to predict spatially continuous apple FFD from remote sensing land surface temperature (LST) based on flowering prediction model. Firstly, the missing LST data were reconstructed by using spatio-temporal reconstruction (STR) approach developed. Next, new air temperature (NAT) data were generated by using the daily Ta estimation (DTE) model and the reconstructed LST. Finally, apple FFD was predicted by the NAT data and the apple flowering prediction model established based on random forest (RF) algorithm and the phenology sequential model, and the prediction accuracy was verified by com-parison with the independently measured apple FFD. The LST reconstructed by using the STR approach has mean absolute error (MAE) ranging from 0.51 to 0.68 degrees C, and root mean square error (RMSE) ranging from 1.07 to 1.21 degrees C. The MAE between the NAT data and the High-Resolution Land Surface Data Assimilation System (HR-CLDAS) meteorological data ranges from 2.15 to 3.23 degrees C, and the RMSE ranges from 2.81 to 4.27 degrees C. In addition, the determination coefficient (R2) and RMSE between the predicted and measured FFD is 0.72 and 2.96 days, respectively. These results demonstrate that the developed method maximizes the potential of MODIS LST in predicting spatially continuous apple FFD, which is valuable for flower and fruit thinning, to defend against frost disasters, and in general for refined orchard production management.
Spectroscopy can be used for detecting crop characteristics. A goal of crop spectrum analysis is to extract effective features from spectral data for establishing a detection model. An ideal spectral feature set should have high sensitivity to target parameters but low information redundancy among features. However, feature-selection methods that satisfy both requirements are lacking. To address this issue, in this study, a novel method, the continuous wavelet projections algorithm (CWPA), was developed, which has advantages of both continuous wavelet analysis (CWA) and the successive projections algorithm (SPA) for generating optimal spectral feature set for crop detection. Three datasets collected for crop stress detection and retrieval of biochemical properties were used to validate the CWPA under both classification and regression scenarios. The CWPA generated a feature set with fewer features yet achieving accuracy comparable to or even higher than those of CWA and SPA. With only two to three features identified by CWPA, an overall accuracy of 98% in classifying tea plant stresses was achieved, and high coefficients of determination were obtained in retrieving corn leaf chlorophyll content (R2 = 0.8521) and equivalent water thickness (R2 = 0.9508). The mechanism of the CWPA ensures that the novel algorithm discovers the most sensitive features while retaining complementarity among features. Its ability to reduce the data dimension suggests its potential for crop monitoring and phenotyping with hyperspectral data.
The literature review indicates that a scaling effect does exist in downscaling land surface temperature (DLST) processes, and no substantial methods were specially developed for addressing it. In this research, the main aim is to develop a new method to reduce the scaling effect on DLST maps at high resolutions. A thermal component-based thermal spectral unmixing (TSU) model was modified and a multiple regression (REG) model was adopted to create DLST maps at high resolutions. A combined variance of red and NIR bands at a very high resolution with a difference image between upscaled LST and DLST was used to develop a new method. With two case data sets, LSTs at coarse resolutions were downscaled by using the modified TSU model and the REG model to create DLST results. The new method with a correction term expression (a linear model created by using a semi-empirical approach) was used to improve the DLST maps in the two case study areas. The experimental results indicate that the new method could reduce the root mean square error and the mean absolute error >30% and >33%, respectively, and thus demonstrate that the proposed method was effective and significant, especially reducing the scaling effect on DLST results at very high resolutions. The novel significance for the new method is directly reducing the scaling effect on DLST maps at high resolutions.
Timely and accurate information on tree species (TS) is crucial for developing strategies for sustainable management and conservation of artificial and natural forests. Over the last four decades, advances in remote sensing technologies have made TS classification possible. Since many studies on the topic have been conducted and their comprehensive results and novel findings have been published in the literature, it is necessary to conduct an updated review on the status, trends, potentials, and challenges and to recommend future directions. The review will provide an overview on various optical and light detection and ranging (LiDAR) sensors; present and assess current various techniques/methods for, and a general trend of method development in, TS classification; and identify limitations and recommend future directions. In this review, several concluding remarks were made. They include the following: (1) A large group of studies on the topic were using high-resolution satellite, airborne multi-/hyperspectral imagery, and airborne LiDAR data. (2) A trend of “multiple” method development for the topic was observed. (3) Machine learning methods including deep learning models were demonstrated to be significant in improving TS classification accuracy. (4) Recently, unmanned aerial vehicle- (UAV-) based sensors have caught the interest of researchers and practitioners for the topic-related research and applications. In addition, three future directions were recommended, including refining the three categories of “multiple” methods, developing novel data fusion algorithms or processing chains, and exploring new spectral unmixing algorithms to automatically extract and map TS spectral information from satellite hyperspectral data.
Monitoring the growth and distribution of submerged aquatic vegetation (SAV) is crucial to the protection and restoration of the ecosystem of inland reservoirs. Considering the high sensitivity of SAV to water depth fluctuations in Guanting Reservoir, China, in this study, we realized the reconstruction of bottom topography by combining changing water level with a long time series remote sensing technology and explored the spatiotemporal succession law of SAV by analyzing the effect of water depth on the spatiotemporal distribution of SAV. Results of water depth spatial distribution in Guanting Reservoir were obtained by using water and land boundary lines to construct underwater terrain contours. The accuracy of estimated water depth data from remote sensing images was verified with measured water depth data, and the average relative error of water depth estimation results was about 0.25 m. The experimental results show that (1) the SWIR bands of Landsat images could avoid the interference of aquatic vegetation and realize the separation of land and water; and (2) after separating water area from land, an SWIR1_NIR index was used to effectively map SAV distribution in the reservoir. The results also indicate that the distribution of SAV in the reservoir is suitable for the water depth range of 0-2 m. Water depth fluctuations cause changes in the spatial distribution of suitable water depth. It is the main reason for the change of SAV distribution area in the reservoir during the past 20 years.
Quantitatively exploring a relationship between coastal wetland landscape pattern and water quality (WQ) is conducive to providing scientific guidance for the improvement of regional WQ, the prevention of water pollution, and the formulation of regional landscape protection and planning. With the 2019 landscape data and WQ sampling data from the Yancheng Coastal Wetland, five-level WQ sampling points at different scales were established. By applying ecological and statistical analysis methods, correlations between the landscape patterns and WQ indicators in different buffer zones were analyzed. Analysis results showed that: (1) The area of aquafarm, farmland and dry ponds were widely distributed at different scales, and the landscape level index and type level index in different buffer zones were significantly different. (2) There were significant correlations between coastal wetland landscape types and WQ indicators. Total nitrogen, total phosphorus, ammonia nitrogen (NH4+-N), WQ indicators showed significant positive correlations with farmland landscapes in 0.5 km, 1 km, 2 km, and 2.5 km buffer zones, and significant negative correlations with tidal flats in 0.5 km-2.5 km buffer zones. The Chemical Oxygen Demand index was significantly correlated with various landscapes in the area. (3) At the landscape level, the landscape level index, which represents the fragmentation and complexity of coastal wetland landscapes, had a significant correlation with water pollution indicators, such as mean patch areas, fractal dimension, landscape shape index, plaque cohesion, contagion index and other indexes. At the level of landscape class, farmland, aquafarm, dry ponds, construction land in artificial wetlands, and various types of level indexes of Suaeda salsa, Phragmites communis, and Spartina alterniflora in natural wetlands were highly correlated with WQ indicators.
Carrying out coastal wetland landscape simulations and current and future ecological risk assessments is conducive to formulating policies for coastal wetland landscape planning and promoting the coordinated development of the social economy and ecological environment. This study used the Cellular Automaton (CA)-Markov model to simulate the landscape data of the study area under different scenarios in 2021 and 2025, and built an ecological risk assessment (ERS) index model to analyze the differences of spatio-temporal characteristics of ecological risks. The results showed that: (1) The test accuracy of the CA–Markov model was 0.9562 after passing through the consistency test. The spatial distribution data of landscapes under current utilization scenarios (CUSs), natural development scenarios (NDSs), and ecological protection scenarios (EPSs) were gained through simulations. (2) During 1991–2025, the landscape types of Yancheng coastal wetlands undertake complicated transfers and have vast transfer regions. Under CUSs and NDSs, a large number of natural wetlands are transferred to artificial wetlands. Under EPSs, the area of artificial wetlands declines and artificial wetlands are mainly transferred to natural wetlands. (3) The ecological risk of Yancheng Coastal Wetland increases, accompanied with significant spatial heterogeneity, which is manifested as low in the north area and high in the south area, and there exist some differences between sea areas and land areas. Ecological risk levels transfer violently.
Ecosystem services (ESs) is a term used to describe the foundations of the well-being of human society, and several relevant studies have been carried out in this area. However, given the fact that the complex trade-offs/synergy relationships of ESs are a challenging area, studies on matching mechanisms for ES supply and demand are still rare. In this study, using the InVEST model, ArcGIS, and other professional tools, we first mapped and quantitatively evaluated the supply and demand of five ES types (water yield, soil conservation, carbon retention, food supply, and leisure and entertainment) in Hangzhou, China, based on land use, meteorology, soil, and socio-economic data. Then, we analyzed the matching characteristics between the supply and demand of these ESs and analyzed the complex trade-offs and synergy between the supply and demand of ESs and factors affecting ESs. The results of this analysis indicate that although the ES supply and demand of carbon retention tended to be out of balance (supply was less than demand), the supply and demand of the other four ES types (i.e., water yield, soil conservation, food supply, and leisure and entertainment) were in balance (supply exceeded demand). Finally, the spatial heterogeneity of the supply and demand of ESs in Hangzhou was significant, especially in urban areas in the northeast and mountainous areas in the southwest. The supply of ESs was based on trade-offs, whereas the demand of ESs was based on synergy. Our results further show that the supply and demand of ESs in the urban area in Hangzhou were out of balance, whereas the supply and demand of ESs in the western region were coordinated. Therefore, the linkage of ES flows between this urban area and the western region should be strengthened. This innovative study could provide useful information for regional land use planning and environmental protection.
Nitrogen (N) is significantly related to crop photosynthetic capacity. Over-and-under-application of N fertilizers not only limits crop productivity but also leads to negative environment impacts. With such a dilemma, a feasible solution is to match N supply with crop needs across time and space. Hyperspectral remote sensing has been gradually regarded as a cost-effective alternative to traditional destructive field sampling and laboratory testing for crop N status determination. Hyperspectral vegetation indices (VIs) and linear nonparametric regression have been the dominant techniques used to estimate crop N status. Machine learning algorithms have gradually exerted advantages in modelling the non-linear relationships between spectral data and crop N. Physically-based methods were rarely used due to the lack of radiative transfer models directly involving N. The existing crop N retrieval methods rely heavily on the relationship between chlorophyll and N. The underlying mechanisms of using protein as a proxy of N and crop protein retrieval from canopy hyperspectral data need further exploration. A comprehensive survey of the existing N-related hyperspectral VIs was made with the aim to provide guidance in VI selection for practical application. The combined use of feature mining and machine learning algorithms was emphasized in the overview. Some feature mining methods applied in the field of classification and chemometrics might be adapted for extracting crop N-related features. The deep learning algorithms need further exploration in crop N status assessment from canopy hyperspectral data. Finally, the major challenges and further development direction in crop N status assessment were discussed. The overview could provide a theoretical and technical support to promote applications of hyperspectral remote sensing in crop N status assessment.
Reclamation activities can achieve considerable economic benefits, but also cause negative effects on regional ecosystems. Exploring the ecosystem services (ESs) in an economically developed but eco-environment fragile gulf region, and providing decision-making basis for the formulation of land use (LU) policies and ecological protection planning in the gulf region. Based on multi-year land use, meteorological and soil datasets, we analyzed spatiotemporal changes of ESs in Hangzhou Bay (HZB), China, and explored the impact of reclamation activities on ESs. The results showed that the LU change in HZB was marked by a fast increase of urban land and a large transfer of farmland to urban land. Per ES in HZB, water yield and carbon storage increased, while soil retention, habitat quality, and nitrogen export tended to decline. Various ESs failed to achieve coordinative development. The trade-off relationship of ESs was concentrated between carbon storage, nitrogen export, and water yield, and between habitat quality, water yield, and nitrogen export. With the intensification of reclamation activities in HZB, shoreline shrank; morphology tended to be more complicated; and reclamation activities had a significant impact on ESs. Based on the research results, four methods (policies and measures) to promote the coordination development of HZB ecosystem and social economy were proposed, so as to contribute to the high-quality development of the HZB Greater Bay Area.
Urban heat island (UHI) effect is a common urban problem in the process of rapid urbanization. It is also widely considered as one of the most critical global problems in the 21st century. The UHI effect poses a severe challenge to the sustainable development strategy of cities, the living environment of urban residents and the livability of cities. In the context of urban planning and landscape design, how to mitigate the UHI effect and how to help urban residents adapt are one of research topics on urban thermal environments. With Landsat thermal sensor images, this study retrieved urban land surface temperature (LST), and revealed spatiotemporal characteristics of surface urban heat island (SUHI) effect from the perspective of urban expansion and urban green infrastructure. The results indicate that the Hangzhou city SUHI effect was prominent. From 1990 to 2010, the high-grade SUHI effect area tended to move to the north, while from 2010 to 2018, the high-grade SUHI effect area tended to move to the south, which was consistent with the direction of urban expansion. Urban edge-expansion led to continuous expansion of urban scope, and urban center was dominated by infilling expansion. The core area of green infrastructure in the city center was small, and the ecological corridor was reduced, which intensified the SUHI effect of the city center. In different time periods, the relationship between SUHI effect, urban expansion and urban green infrastructure was different. The analysis results derived from this study were considered valuable for urban planners and landscape designers to alleviate the SUHI effect, build an ecological civilization city and construct a "livable city".
 Peng Gong (宫鹏)合作论文数Department of Geography, The University of Hong Kong;Tsinghua University47
 Jialin Li (李加林)合作论文数School of Civil & Environmental Engineering and Geography Science, Ningbo University;Ningbo University Donghai Academy28
 Luodan Cao (曹罗丹)合作论文数Ningbo University15
 Peng Tian (田鹏)合作论文数Department of Geography and Spatial Information Techniques, Ningbo University14
 Yongchao Liu (刘永超)合作论文数School of Civil & Environmental Engineering and GeographyScience, Ningbo University14
 Qiandong Guo合作论文数Key Lab. of Digital Earth Sci., Inst. of Remote Sensing & Digital Earth;c;Key Lab. of Digital Earth Sci., Inst. of Remote Sensing & Digital Earth12
 Shawn Landry合作论文数10
 Wenjiang Huang (黄文江)合作论文数Aerospace Information Research Institute, Chinese Academy of Sciences10
 Guijun Yang (杨贵军)合作论文数School of Geological Engineering and Geomatics, Chang'an University;Information Technology Research Center, Beling Academy of Agriculture and Forestry Sciences10
 Jingcheng Zhang (张竞成)合作论文数School of Automation, Hangzhou Dianzi University10
 Jihua Wang (王纪华)合作论文数National Engineering Research Center for Information Technology in Agriculture10
 Susan Bell合作论文数Department of Integrative Biology, College of Arts and Sciences, University of South Florida9
 Haitao Zhang合作论文数8
 Hongbo Gong (龚虹波)合作论文数Law School of Ningbo University8QiXiang Yuan (袁麒翔)合作论文数7
 Zhanqing Li合作论文数Earth System Science Interdisciplinary Center, College of Computer, Mathematical, and Natural Sciences, University of Maryland;Department of Atmospheric and Oceanic Science, College of Computer, Mathematical, and Natural Sciences, University of Maryland7
 Hong Wang (王红)合作论文数College of Geography and Remote Sensing, Hohai University7
 Cynthia A Meyer合作论文数7
 Gregory S. Biging合作论文数Department of Environmental Science, Policy, and Management, University of California7BaiXiang Feng (冯佰香)合作论文数6
 Janet K Yamamoto合作论文数Department of Comparative, Diagnostic & Population Medicine, College of Veterinary Medicine, University of Florida6
 Xiaoli Shi (史小丽)合作论文数Nangjing Institute of Geography & Limnology, Chinese Academy of Sciences;University of Chinese Academy of Sciences6
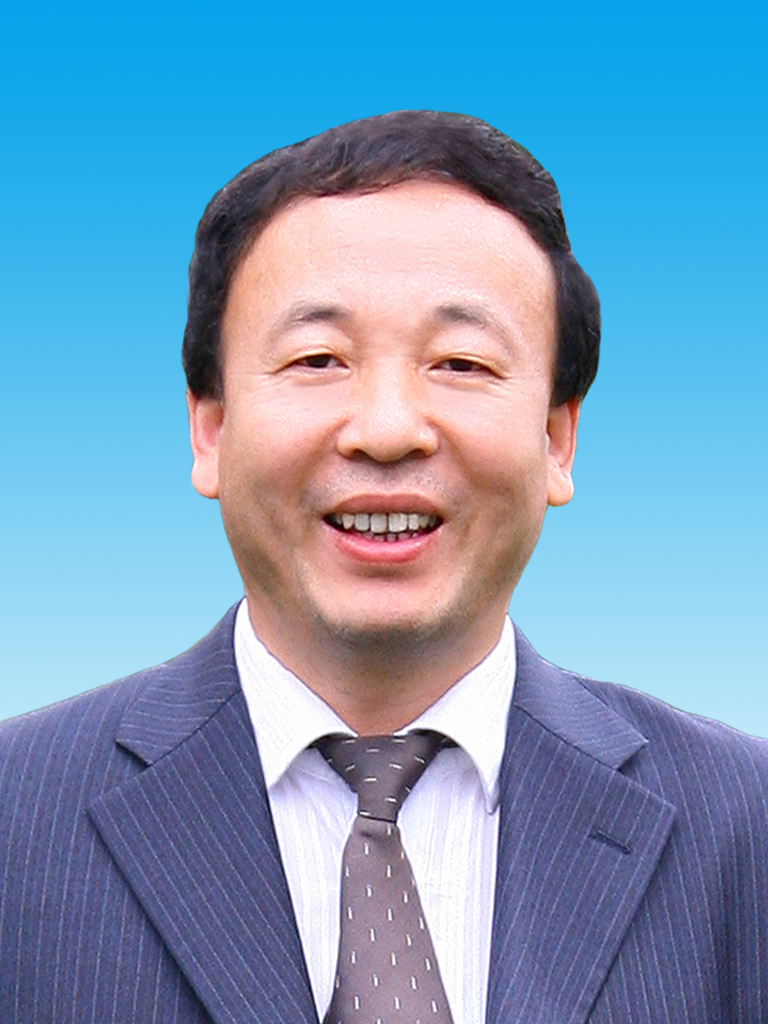 Chunjiang Zhao (赵春江)合作论文数Information Technology Research Center, Beijing Academy of Agriculture and Forestry Sciences;College of Information Technology, Shanghai Ocean University;College of Information and Electrical Engineering, China Agricultural University6
 Lin Yuan合作论文数Institute of Agriculture Remote Sensing and Information System Application, Zhejiang University6
 Xin Miao合作论文数Department of Geography, Geology & Planning, Missouri State University;The School of Earth, Environment and Sustainability, Missouri State University6
 Ivan Csiszar合作论文数6
 Raymond I. Carruthers合作论文数Department of Entomology, Cornell University6
 Juhua Luo (罗菊花)合作论文数University of Chinese Academy of Sciences;Nanjing Institute of Geography & Limnology, Chinese Academy of Sciences5Qian Yu合作论文数Department of Geosciences
University of Massachusetts5Gerald L. Anderson合作论文数5
Juhua Luo (罗菊花)合作论文数University of Chinese Academy of Sciences;Nanjing Institute of Geography & Limnology, Chinese Academy of Sciences5Qian Yu合作论文数Department of Geosciences
University of Massachusetts5Gerald L. Anderson合作论文数5 Zhaoning Gong (宫兆宁)合作论文数College of Resources Environment and Tourism, Capital Normal University;College of Geospatial Information Science and Technology, Capital Normal University5
 Yongchao Zhao合作论文数4Mengyao Ye合作论文数4
 Jun Cheng (程珺)合作论文数Sch Geosci, Univ S Florida4GaiLi He (何改丽)合作论文数4
 Nina Maggi Kelly合作论文数Department of Environmental Sciences, Policy & Management, College of Natural Resources, University of California4
 Zhibin Ren (任志彬)合作论文数Northeast Institute of Geography and Agroecology, Chinese Academy of Sciences;University of Chinese Academy of Sciences4
 Peijun Shi (史培军)合作论文数Faculty of Geographical Science, Beijing Normal University4
 Lesley P. Baggett合作论文数4
 Wei Min Hao合作论文数4CHEN Hui-lin (陈慧霖)合作论文数3Guilin Li合作论文数3YiMei Jiang (姜忆湄)合作论文数3Hao Xu (徐皓)合作论文数Institut Conjoint des Universités de Ningbo et d’Angers3Lei Yang (杨磊)合作论文数3
 Xingyuan He (何兴元)合作论文数Northeast Institute of Geography and Agroecology, Chinese Academy of Sciences;Institute of Applied Ecology, Chinese Academy of Sciences3
 Haifeng Zheng (郑海峰)合作论文数Northeast Institute of Geography and Agroecology, Chinese Academy of Sciences3
 Qiuyan Yu合作论文数3
 John R. Miller合作论文数York University3




