First posted May 2, 2023 For additional information, contact: Director,California Water Science CenterU.S. Geological Survey6000 J Street, Placer HallSacramento, California 95819 Two tributaries to the greater San Joaquin River watershed, Cottonwood and Little Dry Creeks, in California’s Central Valley, were assessed for sediment and streamflow dynamics between October 1, 2011, and September 30, 2019. The two systems deliver sediment to the San Joaquin River below Friant Dam, California. Dams create downstream discontinuities in streamflow and sediment transport and therefore influence fish habitat and sediment dynamics. Because these two creeks are directly downriver from Friant Dam, they become the most upstream source of sediment to the San Joaquin River below Friant Dam.The quality and quantity of spawning habitat for fish in the gravel-bedded reach of the San Joaquin River relies on a range of bed material particle size suitable for redd structure. The effects of coarse-sand to fine-gravel supply on salmonid habitat depends primarily on the size of the sediment and the timing of its addition from tributaries to the San Joaquin River; thus, understanding the timing, quantity, and size of sediment supplied from these two tributaries is critical to the management of ecological and biological sustainability.Streamflow from Cottonwood and Little Dry Creeks, along with streamflow from the San Joaquin River below Friant Dam, were compared to continuously measured water-surface elevations to quantify the timing and direction of streamflow. Suspended-sediment samples were collected with multiple automatic samplers and analyzed for concentration and grain-size distribution. Measured suspended-sediment concentrations and streamflows were used to develop sediment rating curves and compute continuous estimates of suspended-sediment load for each tributary. Satellite imagery was used to qualify spatial and temporal dynamics through the lower watersheds and support more quantitative sediment-load estimates.Computed annual sediment loads ranged from 1.32x101 to 2.68x10⁴ metric tons for Little Dry Creek and 9.82 to 1.98x10³ metric tons for Cottonwood Creek. Sediment loads computed during the study period for both watersheds show that annual loads were highest during water year 2017 (October 1, 2016, to September 30, 2017). Sediment transport primarily occurred between the months of January and March. In both tributaries, grain-size distributions of suspended sediment were predominantly coarse-sized sand and were finer than the remnant bed material.Both creeks demonstrate backwater effects from the San Joaquin River, but the more tortuous stream channel and historical mining pits within Little Dry Creek provide more capacity for sediment storage compared to the less complex stream network of Cottonwood Creek. Because loads were computed based on upstream streamgages and not at the confluence of each tributary to the San Joaquin River, annual load estimates do not represent direct flux into the San Joaquin River; instead, these results indicated that in Little Dry Creek, particularly, the lowest portion of the watershed stores sediment before it reaches the San Joaquin River.
First posted October 7, 2022 For additional information, contact: Southwest Biological Science CenterU.S. Geological Survey2255 N. Gemini DriveFlagstaff, AZ 86001 Bathymetric and topographic data were collected from May 2013 to February 2016 along the 15.84-mile reach of the Colorado River spanning from Glen Canyon Dam to Lees Ferry in Glen Canyon National Recreation Area, Arizona. Channel bathymetry was mapped using multibeam and singlebeam echo sounders; subaerial topography was mapped using a combination of ground-based total stations and aerial photogrammetry. These data were combined to produce a digital elevation model (DEM), spatially variable estimates of DEM uncertainty, and bed-substrate distribution maps. This project is part of a larger effort to monitor the status and trends of sand storage along the Colorado River in Glen Canyon National Recreation Area and Grand Canyon National Park. This report documents the study methodologies (survey methods and post-processing procedures, DEM production and uncertainty assessment, and bed-substrate classification) and presents the resulting datasets.
First posted September 13, 2021 For additional information, contact: Director,California Water Science CenterU.S. Geological Survey6000 J Street, Placer HallSacramento, California 95819 In May of 2019, Loch Lomond Reservoir was surveyed by the U.S. Geological Survey (USGS) in cooperation with the city of Santa Cruz to assess the current storage capacity and sedimentation rates in the reservoir. Survey methods combined sonar soundings to measure bathymetry and lidar scans with GPS data to measure near-shore topography and sediment bed samples to understand reservoir bed-materialsize. The survey data produced a bare-earth digital elevation model (DEM) of the reservoir at a resolution of 1 square meter or better to elevations at or above the reservoir spillway elevation, providing the coverage needed to estimate storage capacity. Additionally, the USGS compared the current survey to storage estimates from historical surveys—particularly the most recent survey in 2009—to evaluate storage capacity trends. Lastly, a hindcast estimate of scaled sediment yield using sediment yields from the San Lorenzo River (USGS station 11160500)—where the San Lorenzo River watershed encompasses the Loch Lomond Reservoir watershed—were used to compare indirect estimates of storage loss to direct storage loss.The 2019 survey resulted in a measured storage capacity of 8,770±50 acre-feet. The differences in storage between 2009 and 2019 varied substantially by depth. In shallow areas with depths less than 30 ft (at full reservoir), such as the very upstream end of the reservoir, storage loss (sediment deposition) dominated with a loss of about 68 acre-feet from 2009 to 2019. In areas deeper than 30 ft, persistent smallstorage gains over a wide range of depths totaled 82 acre-feet from 2009 to 2019. Storage loss estimates derived from estimated watershed sediment yields and reservoir characteristics were similar to storage losses computed from past surveys. This hindcasting produced an estimate of about 500 acre-feet of total storage loss for the history of the reservoir, or an average of about 8–9 acre-feet/year during the 60-year period. For the period 2009–2019, the hindcast produced an estimated total storageloss of 42 acre-feet, which is broadly consistent with the 68 acre-feet of storage loss computed for shallow areas based on the repeat surveys.
An array of three horizontally mounted acoustic Doppler current profilers (ADCPs) deployed in the Fraser River at Mission British Columbia was used to calculate suspended sediment concentration (M), mean grain size (Dg), and geometric standard deviation σg of the grain size distribution (GSD) using acoustic signal inversion. We examine two different multifrequency methods, an explicit and implicit inversion, by systematically allowing M, Dg, and GSD standard deviation (σg) to vary in the inversions. This is the first application of these methods to commercially produced ADCPs, and we further develop methods that use both viscous and scattering attenuation. We couple these inversions with bottle samples collected within the ensonified volume that were analyzed for suspended sediment concentration and GSD characteristics. Concentrations ranged from 20 to 350 mg/L with GSD characteristics dominated by silt to fine sand. We estimate the necessary calibration parameters needed for complete acoustic inversions and find that M and Dg are both dependent on the calibration constant, which could be a source of error in multifrequency inversions using uncalibrated ADCPs. Comparisons between the inversion results and samples show that the implicit method tends to perform best at all flows for estimating M while providing realistic estimates of grain size at high flows only. The explicit method performed well at high flows, but poorly at low flows, for M and Dg. Estimates of σg using both inversion methods indicate frequency dependence. We show that the daily averaged acoustically derived M and Dg capture the hysteretic nature of sediment transport in the Fraser River.
Bedrock‐canyon rivers tend to be supply limited because they are efficient transporters of sediment and not because the upstream supply of sediment is small. A byproduct of this supply limitation is that the finer alluvium stored in these rivers has shorter residence times and smaller volumes than in alluvial rivers. To improve our understanding of disequilibrium sediment transport and its effect on sand storage in bedrock‐canyon rivers, we undertook a 20‐year study, synthesized herein, of the Colorado River in Grand Canyon. Despite the large loads for which it was renowned, this river exhibited evidence of natural sand‐supply limitation and became the perfect natural laboratory for studying sand transport in a bedrock canyon after upstream dam construction exacerbated this supply limitation. During our study, we made and analyzed an unprecedented ∼2.5 million measurements of the suspended and bed sediment. Results indicate that sand storage in this bedrock‐canyon river is self‐limiting owing to the physical controls of flow and grain size causing negative feedbacks that likely also operate in other bedrock‐canyon rivers. Following episodic tributary floods that supply finer sand, sand migrates quickly downstream in the form of a wave in which large systematic changes in bed‐sand grain size occur. These grain‐size changes cause discharge‐independent systematic changes in suspended‐sand concentration in excess of a factor of 20. Although the tributary supply of sand increases the amount of sand storage, it also greatly increases the downstream sand transport by causing bed‐sand fining, thus limiting the residence time and volume of sand storage.
..........................................................................................................................................................
Sedimentation and turbidity have effects on habitat suitability in the San Francisco Bay‐Delta (Bay‐Delta), concerning key species in the bay as well as the ability of the delta marshes to keep pace with sea level rise. A daily rainfall runoff and transport model of the Sacramento River Basin of northern California was developed to simulate streamflow and suspended sediment transport to the Bay‐Delta for the next century (water years, WY2010–2099). The model was calibrated to historical streamflow and sediment data and applied using 10 Global Climate Models with two representative concentration pathways (RCP) each for WY1980–2099 from the IPCC 5th Assessment Report. Results indicate average increases in peak streamflow of +58% and +66% for the RCP 4.5 and 8.5 ensembles, respectively, by mid‐century and +62 and +96% by end‐of‐century. Sediment loads increased by +39% and +69% by end‐of‐century. Suspended sediment concentrations (SSC) increased on average by +4.6% and +6.7% for RCP 4.5 and 8.5, respectively, by end‐of‐century. Individual scenario results varied, and statistically significant increasing trends of sediment loads to the Bay‐Delta were found for the RCP 4.5 and 8.5 ensembles and five individual scenarios. Increased suspended sediment loads may have negative effects such as contaminant transport but also have positive effects that help protect against sea level rise, increase turbidity and fish habitat, and sustain wetland habitats in the Bay‐Delta.
Rivers commonly exhibit substantial variability in suspended‐sand concentration, even at constant water discharge. Here we derive an approach for evaluating how much of this variability arises from mean bed‐sand grain size. We apply this approach to the Colorado River in Grand Canyon, where discharge‐independent concentration of suspended sand varies by more than a factor of 23 (N = 1.4 × 10⁶). Theory predicts that where concentration is controlled by bed‐sand grain size, concentration and grain size in suspension will be inversely correlated (i.e., coarsening of the bed causes suspended sand to become coarser in grain size and lower in concentration). Although the observed correlation is negative, riverbed grain size accounts for only 40% of the variability in concentration. The residuals vary by an order of magnitude; they arise from other processes, such as changes in topography or distribution of sand that cause shear stress to change at constant discharge, changes in the fine tail of bed‐sand grain sizes or changing bedforms. Both bed sand and the other factors influence concentration for durations from less than 1 day to several years. Predictions of concentration based on bed‐sand grain size (N = 4 × 10⁴) are less accurate than predictions based on suspended‐sand grain size, probably because suspended sand is a natural integrator of sand‐transporting processes, giving more weight to those areas of the bed that exchange more sand with the flow. Although the causes of variability vary from one river to another, the approach illustrated here is applicable to any river in which concentration varies at constant water discharge.
First posted September 30, 2019 For additional information, contact: Director,Pacific Islands Water Science CenterU.S. Geological SurveyInouye Regional Center1845 Wasp Blvd., B176Honolulu, HI 96818 The goals of this joint U.S. Geological Survey, University of Hawaiʻi, University of Guam, University of Texas, and East-West Center study were to (1) provide basic understanding about water resources for U.S. Department of Defense installations on Guam and (2) assess the resulting effect of sea-level rise and a changing climate on freshwater availability, on the basis of historic information, sea-level rise projections, and global-climate model temperature and rainfall projections. Downscaled regional climate models, informed by a multimodel ensemble of global climate models provided projections of future climate conditions for Guam. These projected climate conditions provided input to surface-water and groundwater models developed for Guam's hydrology. Guam's water resources in a future climate condition (2080–99) are projected to diminish relative to the recent climate condition. Projected average temperature increases, and average rainfall decreases will lead to reduced streamflow in southern Guam and reduced groundwater recharge to the Northern Guam Lens Aquifer (NGLA). Projected average temperatures in southern Guam will increase about 5.8 °F (3.22 °C), overall rainfall will decrease about 7 percent, and streamflow will consequently decrease 18 percent in important areas of southern Guam. Similarly, across the NGLA, future groundwater recharge will be 19 percent less than estimated recharge from 2012. Reduced future streamflow will decrease water availability from the Fena Valley Reservoir; however, the reservoir is expected to be able to supply water at recent demand rates without lowering the reservoir level to the elevation of the water-supply intakes throughout the simulated period of a future climate. A twelve-year simulation indicates that the reservoir can supply about twice the 2018 demand without lowering the reservoir level to the water-supply intakes. By following mitigation strategies to increase reservoir water availability, the withdrawal rate can be increased by 1.7 percent if the water-supply intakes are lowered 5 ft, by 3.5 percent if the spillway height is raised 5 ft, and by 5.3 percent if both strategies are combined. Higher sea level and reduced future recharge will decrease water availability from the NGLA. An index of composite chloride concentration from production wells increases to 300 milligrams per liter (mg/L) for future climate conditions and at 2010 withdrawal rates, compared with 130 mg/L under historic climate conditions. Most of this increase is due to reduced recharge as higher (+3.2 ft) sea level only has a small role in increasing withdrawn water salinity. A redistributed withdrawal scenario in which the composite chloride concentration is 290 mg/L offers only slight improvement. Should future droughts reduce recharge proportionally to the decreases observed during historic droughts, the composite concentration would be about 900 mg/L, and more than 70 percent of Guam's production wells would produce water with a composite concentration greater than 500 mg/L. Potential mitigation strategies for increasing the potable yield of the NGLA in a future climate include reducing depths of deep production wells and reducing the withdrawal rates in selected wells projected to have higher chloride concentrations. Simulations show both strategies are effective in lowering the composite concentration of the withdrawn water.
Dams disrupt the flow of water and sediment and thus have the potential to affect the downstream geomorphic characteristics of a river. Though there are some well-known and common geomorphic responses to dams, such as bed armouring, the response downstream from any particular dam is dependent on local conditions. Herein, we investigate the response of the upper Santa Ana River in southern California, USA, to the construction of a large dam at the transition from mountains to valley, using calculations of bedload transport capacity on the mainstem below the dam and for major tributaries. Approximate sediment budgets were constructed for downstream reaches to estimate deposition and erosion rates for sand, gravel, and cobble particle sizes. Our results indicate that the classical response of bed armouring and erosion is likely limited to a short reach immediately below the dam. Farther downstream, though transport capacity is reduced by flow regulation by the dam, the channel reaches are likely to remain depositional but with reduced deposition rates. Persistent deposition, as opposed to erosion, is the result of the replenishment of flow and sediment supply by large downstream tributaries. In addition, the calculations indicate that the composition of the bed is unlikely to change substantially in downstream reaches. A Monte Carlo approach was employed to estimate the uncertainty in the sediment budget predictions. The impacts of the dam on the geomorphic character of the river downstream could have implications for native fish that rely on coarse substrate that supports their food base.
Turbidity currents are generated when denser river water plunges and flows along the bottom of a lake, reservoir, or ocean. The plunging and downstream movement are driven by density differences due to temperature and/or suspended sediment, and currents have been observed to move slowly over long distances. This study presents observations of multiple turbidity currents in a large reservoir in California, United States, during runoff events following a major wildfire in the upstream watershed. Several aspects of the currents are documented and discussed, including the conditions leading to plunging, the vertical and longitudinal structure of turbidity within the currents, the velocity of the currents, and the development of a muddy lake upstream from an old submerged dam in the reservoir.(C) 2019 American Society of Civil Engineers.
First posted July 19, 2017 For additional information, contact: California Water Science CenterU.S. Geological Survey6000 J Street, Placer HallSacramento, California 95819 The U.S. Fish and Wildlife Service confirmed that white sturgeon (Acipenser transmontanus) recently spawned in the lower San Joaquin River, California. Decreases in the San Francisco Bay estuary white sturgeon population have led to an increased effort to understand their migration behavior and habitat preferences. The preferred spawning habitat of other white sturgeon (for example, those in the Columbia and Klamath Rivers) is thought to be areas that have high water velocity, deep pools, and coarse bed material. Coarse bed material (pebbles and cobbles), in particular, is important for the survival of white sturgeon eggs and larvae. Knowledge of the physical characteristics of the lower San Joaquin River can be used to preserve sturgeon spawning habitat and lead to management decisions that could help increase the San Francisco Bay estuary white sturgeon population.Between 2011 and 2014, the U.S. Geological Survey, in cooperation with the U.S. Fish and Wildlife Service, assessed selected reaches and tributaries of the lower river in relation to sturgeon spawning habitat by (1) describing selected spawning reaches in terms of habitat-related physical characteristics (such as water depth and velocity, channel slope, and bed material) of the lower San Joaquin River between its confluences with the Stanislaus and Merced Rivers, (2) describing variations in these physical characteristics during wet and dry years, and (3) identifying potential reasons for these variations.The lower San Joaquin River was divided into five study reaches. Although data were collected from all study reaches, three subreaches where the USFWS collected viable eggs at multiple sites in 2011–12 from Orestimba Creek to Sturgeon Bend were of special interest. Water depth and velocity were measured using two different approaches—channel cross sections and longitudinal profiles—and data were collected using an acoustic Doppler current profiler.During the first year of data collection (water year 2011), runoff was greatest, and gaged streamflow, measured as discharge, peaked at 875 cubic meters per second in the lower San Joaquin River. Also during that year, water velocity was generally between 0.6 and 0.9 meters per second, and depth was typically between 2.5 and 4.5 meters, but water depth exceeded 6 meters in several pools. Water year 2011 was classified as a “wet” year. Later water years were classified as either “dry” (water year 2012) or “critical” (water years 2013 and 2014). During the drier years, water was shallower, and velocities were slower. The streambed aggraded in several areas during the study. At Sturgeon Bend, for example, which had the deepest pool measured in 2011 (maximum depth was 14 meters), about 8 meters of sediment was deposited by 2014.The bed of the lower San Joaquin River was predominately sand, except in areas downstream from the mouth of Del Puerto Creek. A large amount of sand, gravel, and cobble was deposited at the mouth of Del Puerto Creek, and in the 9.5 kilometers downstream from the mouth of Del Puerto Creek, we encountered several gravel bars and patches of gravel-size (8–64 millimeters) bed material. Del Puerto and Orestimba Creeks drain from the Coast Ranges on the west side of the river. Only small quantities of gravel-size bed material were observed in the reach downstream from Orestimba Creek, indicating Orestimba Creek does not deliver much coarse sediment to the lower San Joaquin River. Del Puerto Creek appeared to be the primary source of gravels suitable for white sturgeon spawning in the lower San Joaquin River, and thus, it is important for the long-term spawning success of sturgeon in the San Joaquin River.
First posted February 10, 2017 For additional information, contact: DirectorU.S. Geological SurveyCalifornia Water Science Center6000 J Street, Placer HallSacramento, CA 95819http://ca.water.usgs.gov The characteristics of bed material at selected sites within the Sacramento–San Joaquin Delta, California, during 2010–13 are described in a study conducted by the U.S. Geological Survey in cooperation with the Bureau of Reclamation. During 2010‒13, six complete sets of samples were collected. Samples were initially collected at 30 sites; however, starting in 2012, samples were collected at 7 additional sites. These sites are generally collocated with an active streamgage. At all but one site, a separate bed-material sample was collected at three locations within the channel (left, right, and center). Bed-material samples were collected using either a US BMH–60 or a US BM–54 (for sites with higher stream velocity) cable-suspended, scoop sampler. Samples from each location were oven-dried and sieved. Bed material finer than 2 millimeters was subsampled using a sieving riffler and processed using a Beckman Coulter LS 13–320 laser diffraction particle-size analyzer. To determine the organic content of the bed material, the loss on ignition method was used for one subsample from each location. Particle-size distributions are presented as cumulative percent finer than a given size. Median and 90th-percentile particle size, and the percentage of subsample mass lost using the loss on ignition method for each sample are also presented in this report.
The use of “off‐the‐shelf” acoustic Doppler velocity profilers (ADCPs) to estimate suspended sediment concentration and grain‐size in rivers requires robust methods to estimate sound attenuation by suspended sediment. Theoretical estimates of sediment attenuation require a priori knowledge of the concentration and grain‐size distribution (GSD), making the method impractical to apply in routine monitoring programs. In situ methods use acoustic backscatter profile slope to estimate sediment attenuation, and are a more attractive option. However, the performance of in situ sediment attenuation methods has not been extensively compared to theoretical methods. We used three collocated horizontally mounted ADCPs in the Fraser River at Mission, British Columbia and 298 observations of concentration and GSD along the acoustic beams to calculate theoretical and in situ sediment attenuation. Conversion of acoustic intensity from counts to decibels is influenced by the instrument noise floor, which affects the backscatter profile shape and therefore in situ attenuation. We develop a method that converts counts to decibels to maximize profile length, which is useful in rivers where cross‐channel acoustic profile penetration is a fraction of total channel width. Nevertheless, the agreement between theoretical and in situ attenuation is poor at low concentrations because cross‐stream gradients in concentration, sediment size or GSD can develop, which affect the backscatter profiles. We establish threshold concentrations below which in situ attenuation is unreliable in Fraser River. Our results call for careful examination of cross‐stream changes in suspended sediment characteristics and acoustic profiles across a range of flows before in situ attenuation methods are applied in river monitoring programs.
A model to compute reservoir sedimentation rates at daily timescales is presented. The model uses streamflow and sediment load data from nearby stream gauges to obtain an initial estimate of sediment yield for the reservoir's watershed; it is then calibrated to the total deposition calculated from repeat bathymetric surveys. Long-term changes to reservoir trapping efficiency are also taken into account. The model was applied to the Fena Valley Reservoir, a water supply reservoir on the island of Guam. This reservoir became operational in 1951 and was recently surveyed in 2014. The model results show that the highest rate of deposition occurred during two typhoons (Typhoon Alice in 1953 and Typhoon Tingting in 2004); each storm decreased reservoir capacity by approximately 2-3% in only a few days. The presented model can be used to evaluate the impact of an extreme event, or it can be coupled with a watershed runoff model to evaluate potential impacts to storage capacity as a result of climate change or other hydrologic modifications. (C) 2017 American Society of Civil Engineers.
Suspended sediment particle size in rivers is of great interest due to its influence on riverine and coastal morphology, socio-economic viability, and ecological health and restoration. Prediction of suspended sediment transport from hydraulics remains a stubbornly difficult problem, particularly for the washload component, which is controlled by sediment supply from the drainage basin. This has led to a number of methods for continuously monitoring suspended sediment concentration and mean particle size, the most popular currently being hydroacoustic methods. Here, we explore the possibility of using theoretical inversion of the sonar equation to derive an estimate of mean particle size, relative standard deviation of the Grain Size Distribution (GSD), and concentration. Instruments were deployed in the sand-bedded reach of the Fraser River, British Columbia. We use 298 bottle samples collected in the acoustic beams to test acoustics signal inversion methods. We present results from an acoustic inversion where multiple water samples were collected and analyzed.
Collecting physical bedload measurements is an expensive and time-consuming endeavor that rarely captures the temporal variability of sediment transport. Technological advances can improve monitoring of sediment transport by filling in temporal gaps between physical sampling periods. A low-cost hydrophone recording system was used to record the Sediment-Generated Noise (SGN) resulting from collisions of coarse particles (generally larger than 8 mm) in a gravel-bedded river. The sound level of the signal recorded by the hydrophone is assumed proportional to the magnitude of bedload transport. To calibrate the SGN to bedload transport, two hydrophone monitoring stations were installed at two sites along the Trinity River, California, during restoration flow releases in 2015. At each site, 13-14 bedload measurements were collected. At the upstream site, 520 cubic meters of gravel were injected into the river as part of a gravel augmentation program. At both sites, SGN was more strongly correlated than discharge for fine (<16 mm), coarse (>16 mm), and total bedload transport; the highest correlation was for coarse bedload transport (Pearson's r = 0.94 and 93). Continuous time series of bedload transport were also modeled using the SGN.
First posted May 4, 2016 For additional information, contact: SBSC staff, Southwest Biological Science CenterU.S. Geological Survey2255 N. Gemini DriveFlagstaff, AZ 86001http://sbsc.wr.usgs.gov/ It is commonly recognized that suspended-sediment concentrations in rivers can change rapidly in time and independently of water discharge during important sediment‑transporting events (for example, during floods); thus, suspended-sediment measurements at closely spaced time intervals are necessary to characterize suspended‑sediment loads. Because the manual collection of sufficient numbers of suspended-sediment samples required to characterize this variability is often time and cost prohibitive, several "surrogate" techniques have been developed for in situ measurements of properties related to suspended-sediment characteristics (for example, turbidity, laser-diffraction, acoustics). Herein, we present a new physically based method for the simultaneous measurement of suspended-silt-and-clay concentration, suspended-sand concentration, and suspended‑sand median grain size in rivers, using multi‑frequency arrays of single-frequency side‑looking acoustic-Doppler profilers. The method is strongly grounded in the extensive scientific literature on the incoherent scattering of sound by random suspensions of small particles. In particular, the method takes advantage of theory that relates acoustic frequency, acoustic attenuation, acoustic backscatter, suspended-sediment concentration, and suspended-sediment grain-size distribution. We develop the theory and methods, and demonstrate the application of the method at six study sites on the Colorado River and Rio Grande, where large numbers of suspended-sediment samples have been collected concurrently with acoustic attenuation and backscatter measurements over many years. The method produces acoustical measurements of suspended-silt-and-clay and suspended-sand concentration (in units of mg/L), and acoustical measurements of suspended-sand median grain size (in units of mm) that are generally in good to excellent agreement with concurrent physical measurements of these quantities in the river cross sections at these sites. In addition, detailed, step-by-step procedures are presented for the general river application of the method.Quantification of errors in sediment-transport measurements made using this acoustical method is essential if the measurements are to be used effectively, for example, to evaluate uncertainty in long-term sediment loads and budgets. Several types of error analyses are presented to evaluate (1) the stability of acoustical calibrations over time, (2) the effect of neglecting backscatter from silt and clay, (3) the bias arising from changes in sand grain size, (4) the time-varying error in the method, and (5) the influence of nonrandom processes on error. Results indicate that (1) acoustical calibrations can be stable for long durations (multiple years), (2) neglecting backscatter from silt and clay can result in unacceptably high bias, (3) two frequencies are likely required to obtain sand-concentration measurements that are unbiased by changes in grain size, depending on site-specific conditions and acoustic frequency, (4) relative errors in silt-and-clay- and sand-concentration measurements decrease substantially as concentration increases, and (5) nonrandom errors may arise from slow changes in the spatial structure of suspended sediment that affect the relations between concentration in the acoustically ensonified part of the cross section and concentration in the entire river cross section. Taken together, the error analyses indicate that the two-frequency method produces unbiased measurements of suspended-silt-and-clay and sand concentration, with errors that are similar to, or larger than, those associated with conventional sampling methods.
 David J. Topping合作论文数U.S. Geological Survey25Theodore S. Melis合作论文数17David M Rubin合作论文数Department of Earth & Planetary Sciences, Division of Physical & Biological Sciences, University of California, Santa Cruz16Mathieu Marineau合作论文数12David H. Schoellhamer合作论文数12
 Yogesh B. Gianchandani合作论文数Electrical Engineering and Computer Science Department, College of Engineering, University of Michigan;Mechanical Engineering Department, College of Engineering, University of Michigan;Omniscent, Inc.9
 Paul E. Grams合作论文数Department of Geography;Environmental Engineering;Hopkins University;Department of Geography, Hopkins University8
 John C. Schmidt合作论文数Department of Aquatic;Utah State University;Department of Aquatic, Utah State University8
 Lorraine E Flint合作论文数Placer Hall, U.S. Geological Survey7
 Matt Kaplinski合作论文数6
 Gary Parker合作论文数Department of Civil and Environmental Engineering, The Grainger College of Engineering, University of Illinois Urbana-Champaign;Department of Geology, University of Illinois Urbana-Champaign6J. T. Minear合作论文数5J.E. Hazel合作论文数4
 Charles N Alpers合作论文数U. S. Geological Survey4
 Dan Haught合作论文数3Amy E. Draut合作论文数3
 Jeremy G. Venditti合作论文数School of Environmental Science & Department of Geography, Simon Fraser University3
 Alan L. Flint合作论文数U. S. Geological Survey3m j breedlove合作论文数2Daniel R. Whealdon-Haught合作论文数2
 Michelle A. Stern合作论文数US Geol Survey2
 Barbara E. Ralston合作论文数Off Sci Qual & Integr, US Geol Survey2
 David J. Dean合作论文数2R Griffiths合作论文数2Gregory G. Shellenbarger合作论文数SG Science2Nicholas Voichick合作论文数2
 Jacob A Fleck合作论文数2
 Neil K. Ganju合作论文数U. S. Geological Survey2Jennifer A Curtis合作论文数2
 Daniel M. Hanes合作论文数Marine Geology Program2Jeffrey W. Gartner合作论文数2
 Brian A. Bergamaschi合作论文数U. S. Geological Survey2
 Judith Z. Drexler合作论文数California Water Science Center, U.S. Geological Survey2
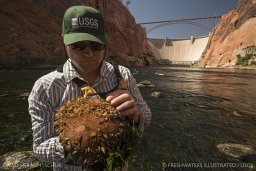 Theodore A. Kennedy合作论文数Grand Canyon Monitoring and Research Center, USGS2Li H Erikson合作论文数2
 Daniel Buscombe合作论文数University of Plymouth2
 Noah P. Snyder合作论文数Department of Earth and Environmental Sciences, Boston College2Adam G. Johnson合作论文数1J. Saraceno合作论文数1Sarah N. Rosa合作论文数1b l logan合作论文数1D. M. Rubin合作论文数1Maureen A. Downing-Kunz合作论文数1David Gaeuman合作论文数1
 Joel Unema合作论文数1Timothy D. Straub合作论文数1
 Molly S Wood合作论文数1lara m schmit合作论文数1Robert B. Tusso合作论文数1




