As seismic data collection continues to grow, advanced automated processing techniques for robust phase identification and event detection are becoming increasingly important. However, the performance, benefits, and limitations of different automated detection approaches have not been fully evaluated. Our study examines how the performance of conventional techniques, including the Short-Term Average/Long-Term Average (STA/LTA) method and cross-correlation approaches, compares to that of various deep learning models. We also evaluate the added benefits that transfer learning may provide to machine learning applications. Each detection approach has been applied to three years of seismic data recorded by stations in East Antarctica. Our results emphasize that the most appropriate detection approach depends on the data attributes and the study objectives. STA/LTA is well-suited for applications that require rapid results even if there is a greater likelihood for false positive detections, and correlation-based techniques work well for identifying events with a high degree of waveform similarity. Deep learning models offer the most adaptability if dealing with a range of seismic sources and noise, and their performance can be enhanced with transfer learning, if the detection parameters are fine-tuned to ensure the accuracy and reliability of the generated catalog. Our results in East Antarctic provide new insight into polar seismicity, highlighting both cryospheric and tectonic events, and demonstrate how automated event detection approaches can be optimized to investigate seismic activity in challenging environments.
The upper mantle and transition zone beneath Antarctica and the surrounding oceans are among the poorest-imaged regions of the Earth's interior. Over the last 15 years, several large broadband regional seismic arrays have been deployed, as have new permanent seismic stations. Using data from 297 Antarctic and 26 additional seismic stations south of similar to 40 degrees S, we image the seismic structure of the upper mantle and transition zone using adjoint tomography. Over the course of 20 iterations, we utilize phase observations from three-component seismograms containing P, S, Rayleigh, and Love waves, including reflections and overtones, generated by 270 earthquakes that occurred from 2001-2003 and 2007-2016. The new continental-scale seismic model (ANT-20) possesses regional-scale resolution south of 60 degrees S. In East Antarctica, thinner continental lithosphere is found beneath areas of Dronning Maud Land and Enderby-Kemp Land. A continuous slow wave speed anomaly extends from the Balleny Islands through the western Ross Embayment and delineates areas of Cenozoic extension and volcanism that span both oceanic and continental regions. Slow wave speed anomalies are also imaged beneath Marie Byrd Land and along the Amundsen Sea Coast, extending to the Antarctic Peninsula. These anomalies are confined to the upper 200-250 km of the mantle, except in the vicinity of Marie Byrd Land where they extend into the transition zone and possibly deeper. Finally, slow wave speeds along the Amundsen Sea Coast link to deeper anomalies offshore, suggesting a possible connection with deeper mantle processes.
Since the last decade of the 20th Century, over 200 broad-band seismic stations have been deployed across the continent of Antarctica (e.g., temporary networks such as TAMSEIS, AGAP/GAMSEIS, POLENET/ANET, TAMNNET and RIS/DRIS by US geoscientists, as well as stations deployed by Japan, Britain, China, Norway, and other countries). In this presentation, we discuss our recent effort that builds a reference crustal and uppermost mantle shear velocity (Vs) model for continental Antarctica based on those seismic arrays. The data analysis for this effort consists of four steps. First, we compute ambient noise cross-correlations between all possible station pairs and use them to construct Rayleigh wave phase and group velocity maps at a continental scale. Coherence of the new maps with maps generated with teleseismic earthquake data from an earlier study (Heeszel et al., 2016) confirms the high quality of both maps, and the minor differences help quantify the map uncertainties. Second, we compute P receiver function waveforms for each station in Antarctica. Third, by combining all seismic measurements from the first two steps with the phase velocity maps by Heeszel et al., (2016) using a non-linear Monte Carlo (MC) inversion algorithm, a 3-D model is obtained for the crust and uppermost mantle beneath the central and western continental Antarctica and its periphery to a depth of ~ 200 km. Fourth and last, using the 3-D seismic model to provide constraints to the crustal structure, we re-invert for the upper mantle structure using the surface wave data within a thermodynamic framework, and construct a 3-D thermal model of the lithosphere of Antarctica. The resulting high resolution seismic/thermal model, that contains uncertainty estimates from the MC inversion, serves as a starting point for further development and geological interpretation. A variety of tectonic features, including a slower/hotter but highly heterogeneous West Antarctica and a much faster/colder East Antarctica, are present in the 3D model. The 3D seismic model, together with the surface heat flow map inferred from the 3-D thermal model, provide a basis for further investigation of the dynamic state of Antarctica’s lithosphere and underlying asthenosphere, and provide key constraints on the interaction of the solid earth with the West Antarctic Ice Sheet.
S-wave receiver functions (SRFs) are used to investigate crustal and upper-mantle structure beneath several ice-covered areas of Antarctica. Moho S-to-P (Sp) arrivals are observed at similar to 6-8 s in SRF stacks for stations in the Gamburtsev Mountains (GAM) and Vostok Highlands (VHIG), similar to 5-6 s for stations in the Transantarctic Mountains (TAM) and the Wilkes Basin (WILK), and similar to 3-4 s for stations in the West Antarctic Rift System (WARS) and the Marie Byrd Land Dome (MBLD). A grid search is used to model the Moho Sp conversion time with Rayleigh wave phase velocities from 18 to 30 s period to estimate crustal thickness and mean crustal shear wave velocity. The Moho depths obtained are between 43 and 58 km for GAM, 36 and 47 km for VHIG, 39 and 46 km for WILK, 39 and 45 km for TAM, 19 and 29 km for WARS and 20 and 35 km for MBLD. SRF stacks for GAM, VHIG, WILK and TAM show little evidence of Sp arrivals coming from upper-mantle depths. SRF stacks for WARS and MBLD show Sp energy arriving from upper-mantle depths but arrival amplitudes do not rise above bootstrapped uncertainty bounds. The age and thickness of the crust is used as a heat flow proxy through comparison with other similar terrains where heat flow has been measured. Crustal structure in GAM, VHIG and WILK is similar to Precambrian terrains in other continents where heat flow ranges from similar to 41 to 58 mW m(-2), suggesting that heat flow across those areas of East Antarctica is not elevated. For the WARS, we use the Cretaceous Newfoundland-Iberia rifted margins and the Mesozoic-Tertiary North Sea rift as tectonic analogues. The low-to-moderate heat flow reported for the Newfoundland-Iberia margins (40-65 mW m(-2)) and North Sea rift (60-85 mW m(-2)) suggest that heat flow across the WARS also may not be elevated. However, the possibility of high heat flow associated with localized Cenozoic extension or Cenozoic-recent magmatic activity in some parts of the WARS cannot be ruled out.
Estimates of crustal and lithospheric thickness beneath ten permanent seismic stations in southern, central, and eastern Africa have been obtained from modeling S-wave receiver functions (SRFs). For eight of the examined stations, the Moho depth estimates agree well with estimates from previous studies using P-wave receiver functions (PRFs). For two stations, TSUM and BGCA, previous PRF estimates are not available, and our results provide new constraints on the Moho depth, indicating crustal thicknesses of 35 and 40 km, respectively. SRFs from four stations, BOSA, SUR, FURI, and ATD, display clear S-to-P (Sp) conversions from the lithosphere-asthenosphere boundary (LAB), corresponding to lithospheric thicknesses of 155, 140, 80, and 34 km, respectively. As expected, thicker lithosphere is observed beneath the Precambrian Kaapvaal Craton (station BOSA) and the Namaqua-Natal mobile belt (station SUR) and thinner lithosphere is observed beneath the edge of the Ethiopian rift (station FUR!) and the Afar Depression (station ATD). The thinner lithosphere beneath the two latter stations is consistent with the transition from continental to oceanic rifting at the Afar triple junction. For the remaining stations, bootstrap error estimates indicate that the Sp conversion from the LAB cannot be well resolved, calling into question interpretations of lithospheric structure in previous SRF studies using data from these same stations.
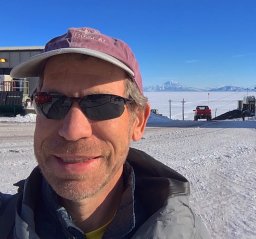 Richard C. Aster合作论文数Department of Earth and Environmental Science, New Mexico Institute of Mining and Technology10
 Douglas Wiens合作论文数Department of Earth and Planetary Sciences, Washington University10
 Audrey D. Huerta合作论文数7Sridhar Anandakrishnan合作论文数Pennsylvania State University7t j wilson合作论文数6
 Andrew Nyblade合作论文数School of Geosciences, The University of the Witwatersrand;Department of Geosciences, College of Earth and Mineral Sciences, Pennsylvania State University6A.J. Lloyd合作论文数5
 Jeroen Tromp合作论文数Princeton Institute for Computational Science & Engineering, Princeton University;Department of Geosciences, Princeton University4
 Ian W. D. Dalziel合作论文数Institute for Geophysics, Jackson School of Geosciences, The University of Texas at Austin4
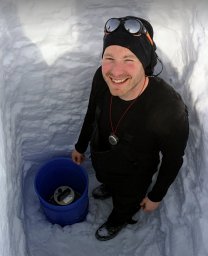 J. P. O'Donnell合作论文数Geol Survey South Australia3
 Hejun Zhu (祝贺君)合作论文数Department of Earth and Space Sciences, Southern University of Science and Technology3
 J. Paul Winberry合作论文数Department of Geosciences and EMS Environment Institute, Pennsylvania State University3Andrew A. Nyblade合作论文数3Thomas Wilson合作论文数2P. Shore合作论文数2a nyblade合作论文数2
 J. A. Chaput合作论文数Dept Geol Sci, Univ Texas El Paso2
 Xinlei Sun (孙新蕾)合作论文数Guangzhou Institute of Geochemistry, Chinese Academy of Sciences2
 Zhigang Peng合作论文数School of Earth and Atmospheric Sciences, College of Sciences, Georgia Institute of Technology2
 Jacob I. Walter合作论文数Department of Earth and Planetary Sciences, University of California2Weisen Shen合作论文数Department of Physics, University of Colorado at Boulder2David S. Heeszel合作论文数Dept. of Earth and Planetary Sciences, Washington University in St. Louis2
 Erik R. Ivins合作论文数Jet Propulsion Laboratory;California Institute of Technology;Jet Propulsion Laboratory, California Institute of Technology2j julia合作论文数1Zhengyang Zhou合作论文数1c ramirez合作论文数1
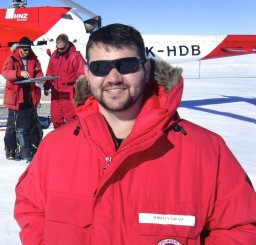 Jordan H. Graw合作论文数Dept Geol Sci, Univ Alabama1Cristo Ramirez合作论文数1Lindsey M. Kenyon合作论文数Dept Earth & Environm Sci, Univ Minnesota1
 Peter Bromirski合作论文数Scripps Institution of Oceanography, University of California, San Diego1
 Ricarda Dziadek合作论文数Helmholtz Ctr Polar & Marine Res, Alfred Wegener Inst1Natalya Gomez合作论文数Department of Earth and Planetary Sciences, Faculty of Science, McGill University1
 Yongcheol Park合作论文数1Terry Wilson合作论文数1
 Ralph A. Stephen合作论文数Department of Geology and Geophysics;Woods Hole Oceanographic Institution;Department of Geology and Geophysics, Woods Hole Oceanographic Institution1
 Peter Gerstoft合作论文数Department of Electrical and Computer Engineering, University of California, San Diego;Marine Physical Laboratory, Scripps Institution of Oceanography, University of California, San Diego1Patrick J. Shore合作论文数1




