Since the first Global Energy and Water Exchanges cloud assessment a decade ago, existing cloud property retrievals have been revised and new retrievals have been developed. The new global long-term cloud datasets show, in general, similar results to those of the previous assessment. A notable exception is the reduced cloud amount provided by the Cloud-Aerosol Lidar and Infrared Pathfinder Satellite Observation (CALIPSO) Science Team, resulting from an improved aerosol–cloud distinction. Height, opacity and thermodynamic phase determine the radiative effect of clouds. Their distributions as well as relative occurrences of cloud types distinguished by height and optical depth are discussed. The similar results of the two assessments indicate that further improvement, in particular on vertical cloud layering, can only be achieved by combining complementary information. We suggest such combination methods to estimate the amount of all clouds within the atmospheric column, including those hidden by clouds aloft. The results compare well with those from CloudSat-CALIPSO radar–lidar geometrical profiles as well as with results from the International Satellite Cloud Climatology Project (ISCCP) corrected by the cloud vertical layer model, which is used for the computation of the ISCCP-derived radiative fluxes. Furthermore, we highlight studies on cloud monitoring using the information from the histograms of the database and give guidelines for: (1) the use of satellite-retrieved cloud properties in climate studies and climate model evaluation and (2) improved retrieval strategies.
Satellite low-Earth-orbiting (LEO) and geostationary (GEO) imager estimates of cloud-top pressure (CTP) have many applications in both operations and in studying long-term variations in cloud properties. Recently, chine learning (ML) approaches have shown improvement upon physically based algorithms. However, ML approaches, and especially neural networks, can suffer from a lack of interpretability, making it difficult to understand what information is most useful for accurate predictions of cloud properties. We trained several neural networks to estimate CTP from infrared channels of the Visible Infrared Imaging Radiometer Suite (VIIRS) and the Advanced Baseline Imager (ABI). The main focus of this work is assessing the relative importance of each instrument's infrared channels in neural networks trained to estimate CTP. We use several ML explainability methods to offer different perspectives on feature importance. These methods show many differences in the relative feature importance depending on the exact method used, but most agree on a few points. Overall, the 8.4-and 8.6-mu m channels appear to be the most useful for CTP estimation on ABI and VIIRS, respectively, with other native infrared window channels and the 13.3-mu m channel playing a moderate role. Furthermore, we find that the neural networks learn relationships that may account for properties of clouds such as opacity and cloud-top phase that otherwise complicate the estimation of CTP. SIGNIFICANCE STATEMENT: Model interpretability is an important consideration for transitioning machine learning models to operations. This work applies several explainability methods in an attempt to understand what information is most important for estimating the pressure level at the top of a cloud from satellite imagers in a neural network model. We observe much disagreement between approaches, which motivates further work in this area but find agreement on the importance of channels in the infrared window region around 8.6 and 10-12 mu m, informing future cloud property algorithm development. We also find some evidence suggesting that these neural networks are able learn physically relevant variability in radiation measurements related to key cloud properties.
Profiles of atmospheric temperature and water vapor from remotely sensed platforms provide critical observations within the temporal and spatial gaps of the radiosonde network. The 2017 National Academies of Science Decadal Survey highlighted that observations of the planetary boundary layer (PBL) from the current space-based observing system are not of the necessary accuracy or resolution for monitoring and predicting high-impact weather phenomena. One possible solution to improving observations of the PBL is supplementing the existing space-based observing system with a network of ground-based profilers. A synthetic information content study is developed utilizing profiles from the Atmospheric Radiation Measurement (ARM) program sites at the Southern Great Plains (SGP), east North Atlantic (ENA), and North Slope of Alaska (NSA) to assess the benefits, in terms of degrees of freedom (DOF), vertical resolution, and uncertainties, of a synergy between the ground-based Atmospheric Emitted Radiance Interferometer (AERI) with space-based hyperspectral infrared (IR) sounders. A combination of AERI with any of the three polar-orbiting IR sounders: the Atmospheric Infrared Sounder (AIRS), the Cross-track Infrared Sounder (CrIS), or the Infrared Atmospheric Sounding Interferometer (IASI), results in a DOF increase of 30%-40% in the surface-to-700-hPa layer compared to the space-based instrument alone. Introducing AERI measurements to the observing system also results in significant improvements to vertical resolution and uncertainties in the bottom 1000 m of the atmosphere compared to CrIS measurements alone. A synergy of CrIS and AERI exceeds the 1-km-vertical-resolution goal set by the Decadal Survey in the lowest 1000 m.
Sea ice leads, or fractures account for a small proportion of the Arctic Ocean surface area, but play a critical role in the energy and moisture exchanges between the ocean and atmosphere. As the sea ice area and volume in the Arctic has declined over the past few decades, changes in sea ice leads have not been studied as extensively. A recently developed approach uses artificial intelligence (AI) and satellite thermal infrared window data to build a twenty-year archive of sea ice lead detects with Moderate Resolution Imaging Spectroradiometer (MODIS) and later, an archive from Visible Infrared Imaging Radiometer Suite (VIIRS). The results are now available and show significant improvement over previously published methods. The AI method results have higher detection rates and a high level detection agreement between MODIS and VIIRS. Analysis over the winter season from 2002–2003 through to the 2021–2022 archive reveals lead detections have a small decreasing trend in lead area that can be attributed to increasing cloud cover in the Arctic. This work reveals that leads are becoming increasingly difficult to detect rather than less likely to occur. Although the trend is small and on the same order of magnitude as the uncertainty, leads are likely increasing at a rate of 3700 km2 per year with a range of uncertainty of 3500 km2 after the impact of cloud cover changes are removed.
The Suomi NPP and JPSS series VIIRS imagers provide an opportunity to extend the NASA EOS Terra (20+ year) and Aqua (18+ year) MODIS cloud climate data record into the new generation NOAA operational weather satellite era. However, while building a consistent, long-term cloud data record has proven challenging for the two MODIS sensors alone, the transition to VIIRS presents additional challenges due to its lack of key water vapor and CO2 absorbing channels available on MODIS that are used for high cloud detection and cloud-top property retrievals, and a mismatch in the spectral location of the 2.2µm shortwave infrared channels on MODIS and VIIRS that has important implications on inter-sensor consistency of cloud optical/microphysical property retrievals and cloud thermodynamic phase. Moreover, sampling differences between MODIS and VIIRS, including spatial resolution and local observation time, and inter-sensor relative radiometric calibration pose additional challenges. To create a continuous, long-term cloud climate data record that merges the observational records of MODIS and VIIRS while mitigating the impacts of these sensor differences, a common algorithm approach was pursued that utilizes a subset of spectral channels available on each imager. The resulting NASA CLDMSK (cloud mask) and CLDPROP (cloud-top and optical/microphysical properties) products were publicly released for Aqua MODIS and SNPP VIIRS in early 2020, with NOAA-20 (JPSS-1) VIIRS following in early 2021. Here, we present an overview of the MODIS-VIIRS CLDMSK and CLDPROP common algorithm approach, discuss efforts to monitor and address relative radiometric calibration differences, and highlight early analysis of inter-sensor cloud product dataset continuity.
Despite accounting for a small fraction of the surface area in the Arctic, long and narrow sea ice fractures, known as "leads ", play a critical role in the energy flux between the ocean and atmosphere. As the volume of sea ice in the Arctic has declined over the past few decades, it is increasingly important to monitor the corresponding changes in sea ice leads. A novel approach has been developed using artificial intelligence (AI) to detect sea ice leads using satellite thermal infrared window data from the Moderate Resolution Imaging Spectroradiometer (MODIS) and the Visible Infrared Imaging Radiometer Suite (VIIRS). In this new approach, a particular type of convolutional neural network, a U-Net, replaces a series of conventional image processing tests from our legacy algorithm. Results show the new approach has a high detection accuracy with F1 Scores on the order of 0.7. Compared to the legacy algorithm, the new algorithm shows improvement, with more true positives, fewer false positives, fewer false negatives, and better agreement between satellite instruments.
Cloud properties are critical to our understanding of weather and climate variability, but their estimation from satellite imagers is a nontrivial task. In this work, we aim to improve cloud detection, which is the most fundamental cloud property. We use a neural network applied to Visible Infrared Imaging Radiometer Suite (VIIRS) measurements to determine whether an imager pixel is cloudy or cloud-free. The neural network is trained and evaluated using 4 years (2016–2019) of coincident measurements between VIIRS and the Cloud-Aerosol Lidar with Orthogonal Polarization (CALIOP). We successfully address the lack of sun glint in the collocation dataset with a simple semi-supervised learning approach. The results of the neural network are then compared with two operational cloud masks: the Continuity MODIS-VIIRS Cloud Mask (MVCM) and the NOAA Enterprise Cloud Mask (ECM). We find that the neural network outperforms both operational cloud masks in most conditions examined with a few exceptions. The largest improvements we observe occur during the night over snow- or ice-covered surfaces in the high latitudes. In our analysis, we show that this improvement is not solely due to differences in optical-depth-based definitions of a cloud between each mask. We also analyze the differences in true-positive rate between day–night and land–water scenes as a function of optical depth. Such differences are a contributor to spatial artifacts in cloud masking, and we find that the neural network is the most consistent in cloud detection with respect to optical depth across these conditions. A regional analysis over Greenland illustrates the impact of such differences and shows that they can result in mean cloud fractions with very different spatial and temporal characteristics.
Having effective interactions with public audiences about science and engineering topics is challenging.Many training workshops, boot camps, and courses have tried to address this by training professional scientists and engineers using a variety of strategies; unfortunately, the literature on the effectiveness of these approaches is sparse.We present assessment and evaluation results from a course, "Informal Science Education for Scientists: A Practicum," taught to graduate students in science and engineeringrelated disciplines in Spring 2008.This course provides a structured framework and experiential learning on informal science education for the graduate student participants during a semester-long experience.The iterative nature of designing an effective informal science education product and the importance of front-end, formative and summative evaluation are stressed throughout the course.The emphasis is placed on having students use a scientific approach in the evaluation of their product to determine if it was effective.Our results show positive outcomes related to changes in student perception of their communication skills, changes in student perceptions of audience, changes in student perception of their evaluation skills, and increased student understanding of the iterative nature of design processes.
This paper introduces the Continuity Moderate Resolution Imaging Spectroradiometer (MODIS)-Visible Infrared Imaging Radiometer Suite (VIIRS) Cloud Mask (MVCM), a cloud detection algorithm designed to facilitate continuity in cloud detection between the MODIS (Moderate Resolution Imaging Spectroradiometer) on the Aqua and Terra platforms and the series of VIIRS (Visible Infrared Imaging Radiometer Suite) instruments, beginning with the Soumi National Polar-orbiting Partnership (SNPP) spacecraft. It is based on the MODIS cloud mask that has been operating since 2000 with the launch of the Terra spacecraft (MOD35) and continuing in 2002 with Aqua (MYD35). The MVCM makes use of fourteen spectral bands that are common to both MODIS and VIIRS so as to create consistent cloud detection between the two instruments and across the years 2000–2020 and beyond. Through comparison data sets, including collocated Aqua MODIS and Cloud-Aerosol LIdar with Orthogonal Polarization (CALIOP) from the A-Train, this study was designed to assign statistical consistency benchmarks between the MYD35 and MVCM cloud masks. It is shown that the MVCM produces consistent cloud detection results between Aqua MODIS, SNPP VIIRS, and NOAA-20 VIIRS and that the quality is comparable to the standard Aqua MODIS cloud mask. Globally, comparisons with collocated CALIOP lidar show combined clear and cloudy sky hit rates of 88.2%, 87.5%, 86.8%, and 86.8% for MYD35, MVCM Aqua MODIS, MVCM SNPP VIIRS, and MVCM NOAA-20 VIIRS, respectively, for June through until August, 2018. For the same months and in the same order for 60S–60N, hit rates are 90.7%, 90.5%, 90.1%, and 90.3%. From the time series constructed from gridded daily means of 60S–60N cloud fractions, we found that the mean day-to-day cloud fraction differences/standard deviations in percent to be 0.68/0.55, 0.94/0.64, −0.20/0.50, and 0.44/0.82 for MVCM Aqua MODIS-MVCM SNPP VIIRS day and night, and MVCM NOAA-20 VIIRS-MVCM SNPP VIIRS day and night, respectively. It is seen that the MODIS and VIIRS 1.38 µm cirrus detection bands perform similarly but with MODIS detecting slightly more clouds in the middle to high levels of the troposphere and the VIIRS detecting more in the upper troposphere above 16 km. In the Arctic, MVCM Aqua MODIS and SNPP VIIRS reported cloud fraction differences of 0–3% during the mid-summer season and −3–4% during the mid-winter.
Since 2013, the Department of Atmospheric and Oceanic Sciences at the University of Wisconsin–Madison has offered an online course titled “Climate and Climate Change.” Students enrolled in this course learn the physical principles governing Earth’s climate and climate change within the broader context of societal impacts and global political considerations. Students interact weekly with each other about these topics, and frequent instructor interaction stimulates further learning related to the course goals. The course was delivered through a balanced mix of forum discussions, weekly worksheets, quizzes, and a final project. For this study, student climate literacy was assessed through voluntary pre- and post-course surveys containing student self-assessment questions and a variety of questions directly based on course content. Post-course survey results indicate 99% of students taking this course feel “fairly well informed” or “very well informed” about their physical understanding of Earth’s climate and the numerous processes governing climate change. The 2019 cohort observed a statistically significant increase in the percentage of students adopting the viewpoint that climate change is caused primarily by human activities. We present a template for implementation in other Earth science or atmospheric science curricula, which includes discussion forum, quiz, and worksheet examples from this course.
 Steven E Platnick (Steven Platnick)合作论文数Earth Sciences Division, National Aeronautics and Space Administration84
 Robert E. Holz合作论文数Cooperative Institute for Meteorological Satellite Studies;Space Science and Engineering Center;University of Wisconsin—Madison;Cooperative Institute for Meteorological Satellite Studies, University of Wisconsin—Madison65
 W. Paul Menzel合作论文数Cooperative Institute for Meteorological Satellite Studies;University of Wisconsin - Madison;Cooperative Institute for Meteorological Satellite Studies, University of Wisconsin - Madison57
 Andrew Heidinger合作论文数National Oceanic and Atmospheric Administration51
 Kerry Meyer合作论文数NASA, Goddard Space Flight Ctr32
 Brent Maddux合作论文数32
 William L. Smith合作论文数School of Business;Emporia State University;School of Business, Emporia State University32
 Robert O. Knuteson合作论文数Space Science and Engineering Center;University of Wisconsin-Madison;Space Science and Engineering Center, University of Wisconsin-Madison31R. Frey合作论文数28
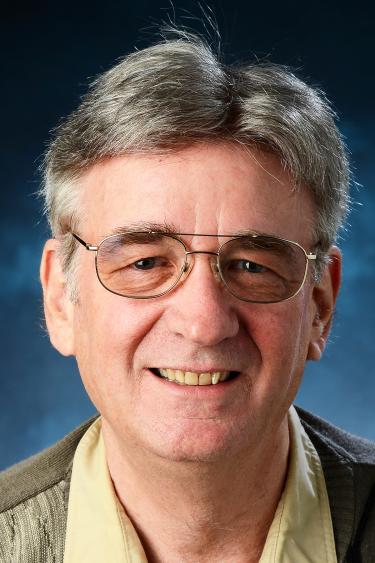 Michael King合作论文数Laboratory for Atmospheric and Space Physics, Department of Atmospheric and Oceanic Sciences, College of Arts and Sciences, University of Colorado Boulder28
 Richard A. Frey合作论文数27
 Bryan Baum合作论文数Science and Technology Corporation23
 Wayne Feltz合作论文数Space Science and Engineering Center, Cooperative Institute for Meteorological Satellite Studies, University of Wisconsin-Madison23
 Galina Wind合作论文数Science Systems and Applications, Inc., NASA Goddard Space Flight Center20
 Timothy J. Schmit合作论文数Cooperative Institute for Meteorological Satellite Studies16
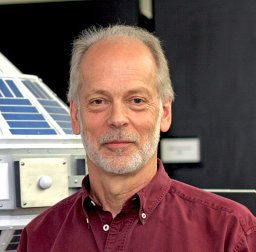 Jeffrey Robert Key合作论文数NESDIS, NOAA15Liam E. Gumley合作论文数15
 Yinghui Liu合作论文数Cooperative Inst. for Meteorological Satellite Studies, Wisconsin Univ.;c;Cooperative Inst. for Meteorological Satellite Studies, Wisconsin Univ.14
 Henry E. Revercomb合作论文数14
 Ping Yang合作论文数Department of Atmospheric Sciences, College of Arts & Sciences, Texas A&M University;Department of Oceanography, Texas A&M University;Department of Physics & Astronomy, Texas A&M University13
 Larry Di Girolamo合作论文数Department of Atmospheric Sciences, National Center for Supercomputing Applications (NCSA);Department of Atmospheric Sciences, the University of Illinois13
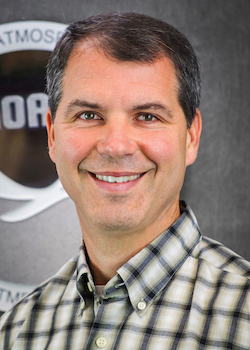 Dave Turner合作论文数Global Systems Laboratory, National Oceanic and Atmospheric Administration13M. E. Mooney合作论文数12S Platnick合作论文数12
 David C. Tobin合作论文数12Christopher C. Moeller合作论文数University of Wisconsin–Madison12HE Revercomb合作论文数11David M. Winker合作论文数Langley Research Center, National Aeronautics and Space Administration11Stephen K. Cox合作论文数11RO Knuteson合作论文数10wolfgang menzel合作论文数10David I. Berry合作论文数9K Strabala合作论文数9Jake Crouch合作论文数9Peter Bissolli合作论文数9Gd Bell合作论文数9Matthew A. Lazzara合作论文数9Jessica Blunden合作论文数9
 Jason Box合作论文数Department of Glaciology and Climate, Geologic Survey of Denmark and Greenland9Paul Berrisford合作论文数9
 David Bromwich合作论文数Department of Geography, College of Arts and Sciences, The Ohio State University;Byrd Polar and Climate Research Center, The Ohio State University9Howard J. Diamond合作论文数Sch Environm, Univ Auckland9Tim P. Boyer合作论文数9
 Zhibo Zhang (张智博)合作论文数Department of Physics, College of Natural and Mathematical Sciences, University of Maryland, Baltimore County;Joint Center for Earth Systems Technology, University of Maryland, Baltimore County9Henry E Revercomb合作论文数9Olga N. Bulygina合作论文数9Steve Colwell合作论文数9Blanca Calderón合作论文数9
 Chris Derksen合作论文数Climate Research Division, Environment and Climate Change Canada9




