Several methods for cell cycle inference from sequencing data exist and are widely adopted. In contrast, methods for classification of cell cycle state from imaging data are scarce. We have for the first time integrated sequencing and imaging derived cell cycle pseudo-times for assigning 449 imaged cells to 693 sequenced cells at an average resolution of 3.4 and 2.4 cells for sequencing and imaging data respectively. Data integration revealed thousands of pathways and organelle features that are correlated with each other, including several previously known interactions and novel associations. The ability to assign the transcriptome state of a profiled cell to its closest living relative, which is still actively growing and expanding opens the door for genotype-phenotype mapping at single cell resolution forward in time.
Advancements in computer vision have resulted in significant breakthroughs across various applications, and one notable area of progress is in the recognition of food ingredient types and states. The identification of food items, distinguishing between types like oranges or apples, and assessing their states, whether whole, peeled, sliced, or juiced, is a pivotal task with far-reaching implications for fields such as food safety, recipe analysis, and restaurant quality control. This paper introduces an innovative approach to food type and state recognition that capitalizes on attention mechanisms and incorporates mask fusion to improve the accuracy and robustness of the recognition process. We evaluate the proposed approach through quantitative and qualitative analyses and comparisons to previous methods. The results consistently demonstrate that our proposed approach, integrating attention mechanisms, outperforms baseline and state-of-the-art methods, achieving an accuracy of 87.11%. This achievement signifies a step forward in refining food image segmentation models and reinforces the applicability of advanced techniques in real-world scenarios.
This paper introduces a new approach for food image segmentation utilizing the Segment Anything Model (SAM), with the additional refinement achieved through fine-tuning with Low-Rank Adaptation layers (LoRA). The segmentation task involves generating a binary mask for food in RGB images, with pixels categorized as background or food. We conduct various experiments to assess and compare the performance of our proposed method with previous approaches. Our findings indicate that our method consistently outperforms other techniques, achieving an accuracy of 94.14%. The improved accuracy of our approach highlights its potential for various applications in food image analysis, contributing to the advancement of computer vision techniques in the realm of food recognition and segmentation.
Large language models (LLMs) have shown progress and promise in diverse applications ranging from the medical field to chat bots. Developing LLMs requires a large corpus of data and significant computation resources to achieve efficient learning. Foundation models (in particular LLMs) serve as the basis for fine-tuning on a new corpus of data. Since the original foundation models contain a very large number of parameters, fine-tuning them can be quite challenging. Development of the low-rank adaption technique (LoRA) for fine-tuning, and the quantized version of LoRA, also known as QLoRA, allows for fine-tuning of LLMs on a new smaller corpus of data. This paper focuses on the repeatability of fine-tuning four LLMs using QLoRA. We have fine-tuned them for seven trials each under the same hardware and software settings. We also validated our study for the repeatability (stability) issue by fine-tuning LLMs on two public datasets. For each trial, each LLM was fine-tuned on a subset of the dataset and tested on a holdout test set. Fine-tuning and inference were done on a single GPU. Our study shows that fine-tuning of LLMs with the QLoRA method is not repeatable (not stable), such that different fine-tuned runs result in different performance on the holdout test set.
Microglial cells mediate diverse homeostatic, inflammatory, and immune processes during normal development and in response to cytotoxic challenges. During these functional activities, microglial cells undergo distinct numerical and morphological changes in different tissue volumes in both rodent and human brains. However, it remains unclear how these cytostructural changes in microglia correlate with region-specific neurochemical functions. To better understand these relationships, neuroscientists need accurate, reproducible, and efficient methods for quantifying microglial cell number and morphologies in histological sections. To address this deficit, we developed a novel deep learning (DL)-based classification, stereology approach that links the appearance of Iba1 immunostained microglial cells at low magnification (20×) with the total number of cells in the same brain region based on unbiased stereology counts as ground truth. Once DL models are trained, total microglial cell numbers in specific regions of interest can be estimated and treatment groups predicted in a high-throughput manner (<1 min) using only low-power images from test cases, without the need for time and labor-intensive stereology counts or morphology ratings in test cases. Results for this DL-based automatic stereology approach on two datasets (total 39 mouse brains) showed >90% accuracy, 100% percent repeatability (Test-Retest) and 60× greater efficiency than manual stereology (<1 min vs. ∼ 60 min) using the same tissue sections. Ongoing and future work includes use of this DL-based approach to establish clear neurodegeneration profiles in age-related human neurological diseases and related animal models.
The detection and segmentation of stained cells and nuclei are essential prerequisites for subsequent quantitative research for many diseases. Recently, deep learning has shown strong performance in many computer vision problems, including solutions for medical image analysis. Furthermore, accurate stereological quantification of microscopic structures in stained tissue sections plays a critical role in understanding human diseases and developing safe and effective treatments. In this article, we review the most recent deep learning approaches for cell (nuclei) detection and segmentation in cancer and Alzheimer's disease with an emphasis on deep learning approaches combined with unbiased stereology. Major challenges include accurate and reproducible cell detection and segmentation of microscopic images from stained sections. Finally, we discuss potential improvements and future trends in deep learning applied to cell detection and segmentation.
Automatic cell quantification in microscopy images can accelerate biomedical research. There has been significant progress in the 3D segmentation of neurons in fluorescence microscopy. However, it remains a challenge in bright-field microscopy due to the low Signal-to-Noise Ratio and signals from out-of-focus neurons. Automatic neuron counting in bright-field z-stacks is often performed on Extended Depth of Field images or on only one thick focal plane image. However, resolving overlapping cells that are located at different z-depths is a challenge. The overlap can be resolved by counting every neuron in its best focus z-plane because of their separation on the z-axis. Unbiased stereology is the state-of-the-art for total cell number estimation. The segmentation boundary for cells is required in order to incorporate the unbiased counting rule for stereology application. Hence, we perform counting via segmentation. We propose to achieve neuron segmentation in the optimal focal plane by posing the binary segmentation task as a multi-class multi-label task. Also, we propose to efficiently use a 2D U-Net for inter-image feature learning in a Multiple Input Multiple Output system that poses a binary segmentation task as a multi-class multi-label segmentation task. We demonstrate the accuracy and efficiency of the MIMO approach using a bright-field microscopy z-stack dataset locally prepared by an expert. The proposed MIMO approach is also validated on a dataset from the Cell Tracking Challenge achieving comparable results to a compared method equipped with memory units. Our z-stack dataset is available at https://tinyurl.com/wncfxn9m.
The IEEE802.15.4 standard has been widely used in modern industry due to its several benefits for stability, scalability, and enhancement of wireless mesh networking. This standard uses a physical layer of binary phase-shift keying (BPSK) modulation and can be operated with two frequency bands, 868 and 915 MHz. The frequency noise could interfere with the BPSK signal, which causes distortion to the signal before its arrival at receiver. Therefore, filtering the BPSK signal from noise is essential to ensure carrying the signal from the sen-der to the receiver with less error. Therefore, removing signal noise in the BPSK signal is necessary to mitigate its negative sequences and increase its capability in industrial wireless sensor networks. Moreover, researchers have reported a posi-tive impact of utilizing the Kalmen filter in detecting the modulated signal at the receiver side in different communication systems, including ZigBee. Mean-while, artificial neural network (ANN) and machine learning (ML) models outper-formed results for predicting signals for detection and classification purposes. This paper develops a neural network predictive detection method to enhance the performance of BPSK modulation. First, a simulation-based model is used to generate the modulated signal of BPSK in the IEEE802.15.4 wireless personal area network (WPAN) standard. Then, Gaussian noise was injected into the BPSK simulation model. To reduce the noise of BPSK phase signals, a recurrent neural networks (RNN) model is implemented and integrated at the receiver side to esti-mate the BPSK's phase signal. We evaluated our predictive-detection RNN model using mean square error (MSE), correlation coefficient, recall, and F1-score metrics. The result shows that our predictive-detection method is superior to the existing model due to the low MSE and correlation coefficient (R-value) metric for different signal-to-noise (SNR) values. In addition, our RNN-based model scored 98.71% and 96.34% based on recall and F1-score, respectively.
Many cancer cell lines are aneuploid and heterogeneous, with multiple karyotypes co-existing within the same cell line. Karyotype heterogeneity has been shown to manifest phenotypically, thus affecting how cells respond to drugs or to minor differences in culture media. Knowing how to interpret karyotype heterogeneity phenotypically would give insights into cellular phenotypes before they unfold temporally. Here, we re-analyzed single cell RNA (scRNA) and scDNA sequencing data from eight stomach cancer cell lines by placing gene expression programs into a phenotypic context. Using live cell imaging, we quantified differences in the growth rate and contact inhibition between the eight cell lines and used these differences to prioritize the transcriptomic biomarkers of the growth rate and carrying capacity. Using these biomarkers, we found significant differences in the predicted growth rate or carrying capacity between multiple karyotypes detected within the same cell line. We used these predictions to simulate how the clonal composition of a cell line would change depending on density conditions during in-vitro experiments. Once validated, these models can aid in the design of experiments that steer evolution with density-dependent selection.
Abstract The primary benefit of stereology methods is quantification of well-stained biological objects in tissue sections with the ability to adjust sampling intensity to achieve desired levels of precision. The advent of hand-crafted algorithms and artificial intelligence-based deep learning (DL) provides an opportunity for more standardized collection of stereology data with enhanced efficiency and higher reproducibility compared to state-of-the-art manual stereology. We contrasted and compared the performance of four manual, semi-automatic, and fully automatic approaches for generating data for total number of Neu-N immunostained neurons in neocortex (NCTX) in the mouse brain. The gold standard for these studies was manual counts using the state-of-the-art optical fractionator method on 3-D reconstructed serial z-axis image stacks through a known tissue volume (disector stacks). To allow for direct methodological comparisons on the same images, disector stacks were automatically converted into extended depth of field (EDF) images in which all neurons in the disector stack were imaged at each cell’s maximal plane of focus. Total number of Neu-N neurons on the same EDF images were counted by a fully automatic hand-crafted method [automatic segmentation algorithm (ASA)] and a semi-automatic method [ASA counts manually corrected for false positives and negatives]. All comparison counts were done using unbiased frames and counting rules with total counts of NeuN-immunostained neurons by the optical fractionator method. The results were comparable across methods with wide variations in throughput efficiency and inter-rater agreement. These results are discussed with respect to applications to experimental studies of brain aging, neuroinflammation and neurodegenerative disease.
Across basic research studies, cell counting requires significant human time and expertise. Trained experts use thin focal plane scanning to count (click) cells in stained biological tissue. This computer-assisted process (optical disector) requires a well-trained human to select a unique best z-plane of focus for counting cells of interest. Though accurate, this approach typically requires an hour per case and is prone to inter- and intra-rater errors. Our group has previously proposed deep learning (DL)-based methods to automate these counts using cell segmentation at high magnification. Here we propose a novel You Only Look Once (YOLO) model that performs cell detection on multi-channel z-plane images (disector stack). This automated Multiple Input Multiple Output (MIMO) version of the optical disector method uses an entire z-stack of microscopy images as its input, and outputs cell detections (counts) with a bounding box of each cell and class corresponding to the z-plane where the cell appears in best focus. Compared to the previous segmentation methods, the proposed method does not require time- and labor-intensive ground truth segmentation masks for training, while producing comparable accuracy to current segmentation-based automatic counts. The MIMO-YOLO method was evaluated on systematic-random samples of NeuN-stained tissue sections through the neocortex of mouse brains (n=7). Using a cross validation scheme, this method showed the ability to correctly count total neuron numbers with accuracy close to human experts and with 100% repeatability (Test-Retest).
Intratumoral heterogeneity is a major obstacle for many cancer therapies. Treatment modalities which target a particular phenotype select for cells with different phenotypes. For example, chemotherapy which targets fast-dividing cells may select for a tumor composed of slower-dividing cells which cannot be effectively targeted by the drug. We hypothesize that subpopulations (SPs) of cells defined by somatic copy number alterations (sCNAs) differ in how quickly they divide and how well they can compete at high population densities. Additionally, we expect that sCNA-defined SPs affect the fitness of one another through cooperative (e.g., exchange of growth factors) and competitive (resource depletion) interactions. To test these hypotheses and compare the relative effects of (i) density and (ii) frequency-dependent selection on tumor evolution, we have developed two mathematical models integrated with experimental and computational techniques. In both models, we evaluate the growth dynamics of cancer cell SPs defined by sCNAs detected in single cell RNA/DNA-sequencing data from 4 gastric cancer cell lines (HGC-27, KATOIII, NUGC-4, SNU-16). To investigate the effects of density dependent selection (i), we start by growing the cell lines in our lab in order to infer growth rate (r) and carrying capacity (K). Next, linear models are built correlating pathway expression levels with r/K values. We tested 50 KEGG pathways previously identified as differentially expressed between r and K-selected cells as transcriptomic biomarkers of growth parameters. The best fitting models are then used to infer SP-specific r/K values. For growth, we found r as a function of the KEGG pathway ‘RNA Polymerase’ (R2 = 0.9636, p-val=0.0019). For carrying capacity, we used ‘Pathways in Cancer’ (R2 = 0.7898, p-val=0.0629). In each cell line, an r/K tradeoff existed between at least one pair of SPs, suggesting sCNAs indeed have effect on r/K parameters. For frequency-dependent selection (ii), we use an inverse game theory algorithm which takes SP frequencies over time as input and outputs a parameterization for the replicator equation to recapitulate detected frequencies and predict future growth. The algorithm uses a penalized least squares method that takes the error to be the difference between replicator equation output and SP frequency input. SP growth over time can then be modeled with the replicator equation to characterize conditions for co-existence or dominance. These approaches reveal the dynamics of heterogeneous tumor growth, and make it possible to compare the relative influence of different selective pressures. We can examine how the growth of a tumor would change with the elimination of a given SP. This greater understanding can contribute to a better design of evolution-based therapies that avoid, or at least delay, the evolution of resistance to treatment. Citation Format: Thomas A. Veith, Andrew Schultz, Noemi Andor, Saeed Alahmari. Investigating the effects of density and frequency-dependent selection on subpopulations of cancer cells defined by copy number. [abstract]. In: Proceedings of the American Association for Cancer Research Annual Meeting 2023; Part 1 (Regular and Invited Abstracts); 2023 Apr 14-19; Orlando, FL. Philadelphia (PA): AACR; Cancer Res 2023;83(7_Suppl):Abstract nr 6549.
Automated food detection and recognition methods have been studied to enhance end-user life. However, most existing research focused on food ingredient type recognition, with little work has been done for food ingredient state recognition. Successful recognition of food ingredient state plays a significant role in handling the food ingredient by an intelligent system. In this work, we propose a new novel cascaded multi-head approach based on deep learning to simultaneously recognize the state and type of food ingredients. We trained and evaluated the proposed approach on a benchmark dataset of food ingredient images with nine different food states and 18 food types. We compared the proposed approach with a non-cascaded deep learning approach. The cascaded approach shows improvement in food ingredient state recognition with 87% accuracy compared to 81% using a non-cascaded deep learning method. Our proposed method broadly applies to various tasks where food ingredient state recognition is essential, such as feeding elderly and disabled people and automating food recognition and preparation.
Background: Incorporation of prior information in the form of pathway activity profiles was key in the success of the algorithm that won the DREAM challenge to predict in vitro cell fitness from transcriptomic and other multi-omic datasets (Costello, C. C et al, 2014). We hypothesize that leveraging additional prior information on the spatial distribution of transcriptome activity inside the cell will yield better predictions of cell fitness, which span longer timeframes. Methods: We integrated (i) sequencing and (ii) imaging data obtained from a stomach cancer cell line (NCI-N87). For (i), we used previously published scRNA-seq data available for 3,246 NCI-N87 cells. Cells were assigned to either G0/G1, S or G2M phase; and G0G1 cells were grouped into subpopulations defined by somatic copy number alterations. In addition, we calculated the pathway activity profile of each cell using gene set variation analysis. For (ii), cells were imaged on a Leica confocal SP8 using 63X objective, collecting 70 z slices of target dye and brightfield with interslice interval 0.29 µm. We trained a previously developed label-free U-Net convolutional neural network (CNN) (Ounkomol, C. et al, 2018) on Z-stacks of images containing the nuclei or mitochondria (mito) to calculate the spatial distribution of the two organelles. Models were trained for nucleus using train (N=37)/test (N=5) and mito using train (N=24)/test (N=5) with the Adam optimizer for 150,000 minibatch iterations monitoring the weighted mean squared error (MSE). The model training pipeline was implemented in PyTorch on a Nvidia DGX A100 Tesla V100 GPU. The accuracy of the model was assessed by calculating the Pearson correlation coefficient between the pixel intensities of the model’s predicted output and the independent test images. The predicted 3D organelles were used as input for segmentation using the Cellpose algorithm (String, C. et al, 2021), giving us nucleus and mito coordinates (X,Y,Z) for each cell. To integrate (i) and (ii) we overlaid the distributions of nucleus and mito area and volume onto the activity of pathways expressed in the nucleus, mito, and their respective membranes. Sequenced and imaged NCI-N87 cells were then co-clustered together to obtain a tree that links profiles between the two assays. Results: Overall, the correlation coefficient (r) was higher when using nucleus images for training (r=[0.759, 0.833]; average 0.780) compared to mito (r=[0.633 - 0.783]; average 0.680), even when the sample sizes were equivalent. Of the imaged cells detected within a given field of view, 50-80% were linked to a sequenced cell. Linking sequenced and imaged cells allows visualizing the spatial distribution of pathway activity among various organelles inside a cell. Conclusions: While our results demonstrate how this can be achieved in principle computationally, they will require extensive experimental validation. Doing so will transform omics-based predictions of cell fitness into problems that can be solved by image classification algorithms and recent advances in computer vision. Citation Format: Andrew R. Schultz, Saeed Alahmari, Pallavi Singh, Zaid Siddiqui, Emily Thomas, Emek Demir, Laura Heiser, Noemi Andor. Integrating imaging and sequencing to compute the subcellular organization of a cell’s transcriptome [abstract]. In: Proceedings of the AACR Special Conference on the Evolutionary Dynamics in Carcinogenesis and Response to Therapy; 2022 Mar 14-17. Philadelphia (PA): AACR; Cancer Res 2022;82(10 Suppl):Abstract nr A013.
Incorporation of prior information in the form of pathway activity profiles was key in the success of the algorithm that won the DREAM challenge to predict in vitro cell fitness from transcriptomic and other multi-omic datasets [1]. We hypothesize that leveraging additional prior information on the spatial distribution of transcriptome activity inside the cell will yield better predictions of cell fitness, which span longer timeframes. A prerequisite to achieve this is the ability to integrate transcriptomic and phenotypic measurements at high cellular resolution. One way to achieve this is to leverage the fact that cells sampled for both assay are in various stages of the cell cycle. ScRNA-seq provides a high temporal resolution on the cell cycle progression of sequenced cells. We show that 3D imaging of subcellular compartments can provide a comparable resolution on the cell cycle state of imaged cells. We use a method developed for scRNA-seq on size and shape statistics of subcellular compartments to assign a so-called “pseudotime” to each imaged cell. Preliminary validation with live-cell imaging supports the hypothesis that the inferred pseudotime follows the cells’ progress through the cell cycle.
Mutations matter in cancer. Loss of function in a gene such as tp53 is advantageous for tumor progression. However, we also know that cells can share similar mutational burdens but exhibit starkly different phenotypes. The heterogeneous nature of cancer cell populations that comprise a tumor compounds this problem, and is a known source of treatment failure. We hypothesize that density conditions in the tumor microenvironment select for particular cellular phenotypes. Additionally, we posit that a cell’s neighbor can affect its phenotypes through interactions such as the exchange of growth factors or competition for resources – a phenomenon known as frequency-dependent selection. To test these hypotheses and compare the relative effects of density and frequency dependent selection on tumor evolution, we have developed two mathematical models integrated with experimental and computational techniques. In both models, we investigate the growth dynamics of subclonal populations defined by somatic copy number alterations detected by single cell RNA/DNA-sequencing data in 5 gastric cancer cell lines. For density dependence, we have identified transcriptomic biomarkers of growth rate (r) and carrying capacity (K). These r/K biomarkers are used to parameterize logistic, power-law, and Gompertzian models to evaluate which best captures the observed growth. In the case of frequency dependent selection, we have deployed an inverse game theory algorithm which takes the subclonal frequencies and finds parameterizations for the replicator equation which can recapitulate the detected frequencies. The algorithm uses a penalized least squares method that takes the error in parameterization to be the difference between replicator equation output and detected subclonal frequencies. For density dependence, we tested 25 KEGG pathways as transcriptomic biomarkers of cell line growth parameters. Of these, ‘Pathways in cancer’ fit best for growth rate (R2 = 0.9965) and ‘p53 signaling pathway’ fit best for carrying capacity (R2 = 0.9701). In 4 out of 5 cells lines, all 3 growth models that were tested fit the data well (R2 ≥ 0.93), with logistic being the best fit or tied for best fit. In each cell line, an r/K tradeoff existed between at least 2 subclones, suggesting density conditions will indeed select for certain subclones. In the case of frequency dependence, we found the best fit parameterizations for the replicator equation indicate competition is less intense between different subclones than when a subclone competes with itself. This suggests a cell’s neighbor will have an effect on its growth. Taken together, these approaches reveal the dynamics of heterogeneous tumor growth, and make it possible to compare the relative influence of different types of evolutionarily selective pressures. For example, we can examine how the growth of a tumor would change with the elimination of one subclone. This greater understanding can contribute to a better design of evolution-based therapies that avoid, or at least delay, the evolution of resistance to treatment. Citation Format: Thomas Veith, Andrew Schultz, Saeed Alahmari, Noemi Andor. Models of neighbors and space: frequency and density dependent dynamics of tumor evolution [abstract]. In: Proceedings of the AACR Special Conference on the Evolutionary Dynamics in Carcinogenesis and Response to Therapy; 2022 Mar 14-17. Philadelphia (PA): AACR; Cancer Res 2022;82(10 Suppl):Abstract nr A014.
Microglial cell proliferation in neural tissue (neuroinflammation) occurs during infections, neurological disease, neurotoxicity, and other conditions. In basic science and clinical studies, quantification of microglial proliferation requires extensive manual counting (cell clicking) by trained experts (∼ 2 hours per case). Previous efforts to automate this process have focused on stereology-based estimation of global cell number using deep learning (DL)- based segmentation of immunostained microglial cells at high magnification. To further improve on throughput efficiency, we propose a novel approach using snapshot ensembles of convolutional neural networks (CNN) with training using local images, i.e., low (20x) magnification, to predict high or low microglial proliferation at the global level. An expert uses stereology to quantify the global microglia cell number at high magnification, applies a label of high or low proliferation at the animal (mouse) level, then assigns this global label to each 20x image as ground truth for training a CNN to predict global proliferation. To test accuracy, cross validation with six mouse brains from each class for training and one each for testing was done. The ensemble predictions were averaged, and the test brain was assigned a label based on the predicted class of the majority of images from that brain. The ensemble accurately classified proliferation in 11 of 14 brains (∼ 80%) in less than a minute per case, without cell-level segmentation or manual stereology at high magnification. This approach shows, for the first time, that training a DL model with local images can efficiently predict microglial cell proliferation at the global level. The dataset used in this work is publicly available at: tinyurl.com/20xData-USF-SRC.
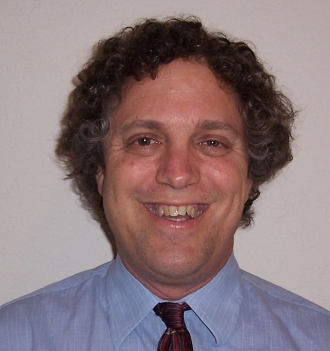 Lawrence O. Hall合作论文数Department of Computer Science and Engineering, University of South Florida;Bellini College of Artificial Intelligence, Cybersecurity and Computing, University of South Florida16
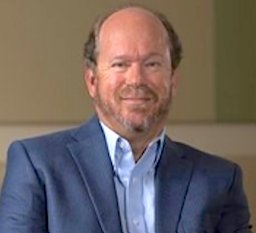 Peter R. Mouton合作论文数National Institute on Aging, The Johns Hopkins University School of Medicine & the Gerontology Research Center15
 Palak Dave合作论文数Dept Comp Sci & Engn, Univ S Florida8
 Dmitry B. Goldgof合作论文数Department of Computer Science and Engineering, Bellini College of Artificial Intelligence, Cybersecurity and Computing, University of South Florida;Health Heart Institute, University of South Florida;H. Lee Moffitt Cancer Center and Research Institute7Andrew Schultz合作论文数6
 Hunter Morera合作论文数Dept Comp Sci & Engn, Univ S Florida6
 Noemi Andor合作论文数6Thomas Veith合作论文数4
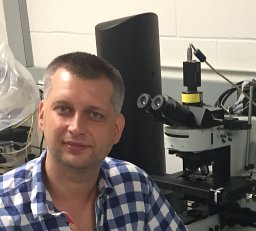 Yaroslav Kolinko合作论文数4
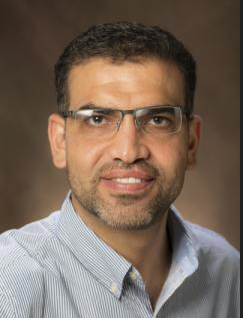 Tawfiq Salem合作论文数School of Applied and Creative Computing, Purdue University4D. Goldgof合作论文数Department of Computer Science and Engineering
University of South Florida4
Tawfiq Salem合作论文数School of Applied and Creative Computing, Purdue University4D. Goldgof合作论文数Department of Computer Science and Engineering
University of South Florida4 Zaid Ali Siddiqui合作论文数Stritch School of Medicine, Loyola University Chicago3
 Hady Ahmady Phoulady合作论文数3Laura M. Heiser合作论文数LBL 1 Cyclotron Rd3Dmitry B Goldgof合作论文数Department of Computer Science and Engineering;University of South Florida3Kurtis Allen合作论文数2
 Michael Gardner合作论文数Purdue University2
 Issam El Naqa合作论文数Michigan Institute for Data Science, University of Michigan;Machine Learning Department, Moffitt Cancer Center;University of South Florida2Suha Al-qahtani合作论文数1Soheir E. Mohamed合作论文数1Emily Thomas合作论文数1
 Mohammad Reza Daliri合作论文数1Arshad Khan合作论文数1
 Jisoo Hwang合作论文数1
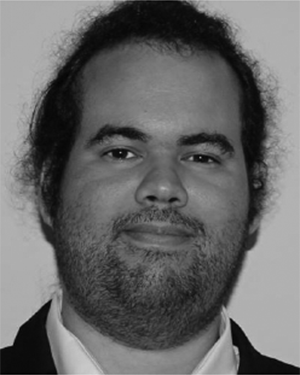 Carlos V. Paradis合作论文数1
 Dmitry Cherezov合作论文数Comp Sci & Engn, Univ S Florida1
 Baderaldeen Altazi合作论文数Dept Med Phys, King Abdullah Med City Holy Capital1
 Osama Ashraf合作论文数1
 Richard A. Bauder合作论文数Florida Atlantic Univ, Boca Raton, FL 33431 USA1
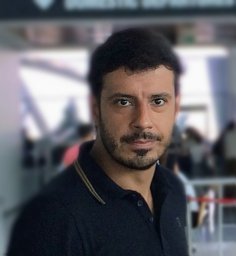 Vural Tagal合作论文数Univ Texas SW Med Ctr Dallas, Dept Biochem, 5323 Harry Hines Blvd, Dallas, TX 75390 USA1
 Richard Beck合作论文数Leiden Univ, Leiden Acad Ctr Drug Res, Div Drug Discovery & Safety, Leiden, Netherlands1
 Daniele Foroni合作论文数Huawei ERC1Joseph Johnson合作论文数1Ayman M. Abdalla合作论文数1Natalia Khuri合作论文数1
 Mesfer Alrizq合作论文数Najran Univ, Coll Comp Sci & Informat Syst, Najran 61441, Saudi Arabia1
 Abdulaziz A. Alsulami合作论文数King Abdulaziz Univ, Fac Comp & Informat Technol, Dept Informat Syst, Jeddah 21589, Saudi Arabia1
 Seyedamin Pouriyeh合作论文数Kennesaw State University1
 Arunkumar Bagavathi合作论文数Univ North Carolina Charlotte, Dept Comp Sci, Charlotte, NC 28223 USA1
 Murtadha Hssayeni合作论文数Dept Comp & Elect Engn & Comp Sci, Florida Atlantic Univ1
 Juan Carlos Manrique Arribas合作论文数UVA, Univ Valladolid1
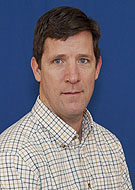 Kyle Caudle合作论文数South Dakota School of Mines and Technology1
 Minghong Fang合作论文数Department of Computer Science, Speed School of Engineering, University of Louisville1
 G. Jean Harry合作论文数National Toxicology Program Laboratory, National Institute of Environmental Health Sciences1
 Kamran Kowsari合作论文数1
 Tianyi Liu合作论文数School of Industrial and Systems Engineering, Georgia Institute of Technolodgy1
 Samuel H. Hawkins合作论文数1
 Vincenzo De Maio合作论文数1
 Changwei Hu合作论文数Amazon;Coldwell Banker1




