The 2021 Fagradalsfjall eruption marked the first in a series of ongoing eruptions in a densely populated region of Iceland (>260 000 residents within 50 km distance). This eruption was monitored by an exceptionally dense regulatory air quality network, providing a unique opportunity to examine fine-scale dispersion patterns of volcanic air pollutants (SO2, PM1, PM2.5, PM10) in populated areas. Despite its relatively small size, the eruption led to statistically-significant increases in PM and SO2 concentrations at distances of at least 300 km. Peak daily-mean concentrations of PM1 (measured in the capital area, 25-35 km distance from the source) rose from 5-6 to 18-20 mu g m(-3), and the proportion of PM1 within PM10 increased by similar to 50 %. In areas with low background pollution, average PM10 and PM2.5 levels increased by similar to 50 % but in places with high background sources, the eruption's impact was not detectable. These findings suggest that ash-poor eruptions are a major source of PM1 in Iceland and potentially in other regions exposed to volcanic emissions. Air quality guidelines for PM1 and SO2 were exceeded more frequently during the eruption than under background conditions. This suggests the potential for an increase in adverse health effects. Moreover, pollutant concentrations exhibited strong fine-scale temporal (<= 1 h) and spatial (<1 km) variability. This suggests disparities in population exposures to volcanic air pollution, even from relatively distal sources, and underscores the importance of a dense monitoring network and effective public communication.
Abstract. The 2021 Fagradalsfjall eruption marked the first in a series of ongoing eruptions in a densely populated region of Iceland (>260 000 residents within 50 km distance). This eruption was monitored by an exceptionally dense regulatory air quality network, providing a unique opportunity to examine fine-scale dispersion patterns of volcanic air pollutants (SO2, PM1, PM2.5, PM10) in populated areas. Despite its relatively small size, the eruption led to statistically-significant increases in PM and SO2 concentrations at distances of at least 300 km. Peak daily-mean concentrations of PM1 (measured in the capital area, 25–35 km distance from the source) rose from 5–6 to 18–20 µg m−3, and the proportion of PM1 within PM10 increased by ∼50 %. In areas with low background pollution, average PM10 and PM2.5 levels increased by ∼50 % but in places with high background sources, the eruption's impact was not detectable. These findings suggest that ash-poor eruptions are a major source of PM1 in Iceland and potentially in other regions exposed to volcanic emissions. Air quality guidelines for PM1 and SO2 were exceeded more frequently during the eruption than under background conditions. This suggests the potential for an increase in adverse health effects. Moreover, pollutant concentrations exhibited strong fine-scale temporal (≤1 h) and spatial (<1 km) variability. This suggests disparities in population exposures to volcanic air pollution, even from relatively distal sources, and underscores the importance of a dense monitoring network and effective public communication.
Series of inflation-deflation cycles have occurred during 2020-2024 in the center of the Svartsengi volcanic system, SW-Iceland. Since 27 October 2023, continuous inflation has been interrupted by deflation periods when nine dike injections and seven eruptions have occurred from 10 November 2023 to 8 December 2024 at the Sundhn & uacute;kur crater row and its extension. Extensive observations of ground deformation using GNSS (Global Navigation Satellite System) geodesy and interferometric analysis of synthetic aperture satellite (InSAR) images is here used to improve understanding of the dynamics of magma accumulation and transfer, both prior to and during repeated rifting events. Joint inversions of the GNSS and InSAR data, considering a deformation source within a uniform elastic half-space, infer pressure changes at about 4-5 km depth near the regional brittle-ductile boundary, with inflow causing volume increase rates of 2.4-9 m(3)/s. Geodetic modelling using GNSS has been undertaken in near real-time throughout the events, using deformation sources in fixed locations inferred in earlier joint inversions. The deflation periods began rapidly when a dike propagated from the eastern edge of the magma accumulation area. The estimated volume of dikes is in the range (1-133) x 10(6) m(3), with the first event being by far the largest and longest (similar to 15 km). Geodetic observations have contributed to success in forecasting diking/eruption onset in the medium and short term, using the expectation that a correlation exists between volume loss in the magma domain during a deflation event and subsequent volume recharge to the system before the next event is triggered.
The Reykjanes Peninsula in SW Iceland is transacted by a divergent plate boundary with oblique spreading. Volcanic unrest periods, marked by fissure eruptions widely across the peninsula, seem to occur with regular intervals, approximately every 800-1000 years. These volcanic unrest periods have durations of 100 up to 400 years. In 2020, it became clear that magma was on the move again after 800 years of quiescence, as repeated uplift was measured in the vicinity of the Svartsengi geothermal area. Minor subsidence was recorded between uplift periods and seismicity increased again, only after the previous state of uplift had been surpassed, in line with the so-called Kaiser effect. A year later, a dike intrusion in Fagradalsfjall triggered earthquake activity tens of km away as stored tectonic stresses along the peninsula were released. After a clear decline in earthquake activity, an eruption took place in Geldingdalir, Fagradalsfjall, on 19 March 2021, the first one in over 6000 years in that region. At the time of writing, 4 volcanic eruptions have occurred since 2021 and in total roughly 20 magmatic intrusive events have taken place on the Reykjanes Peninsula.Recently an escalation in volcanic activity has been observed. In late October 2023, the 5th period of uplift started in Svartsengi signifying faster magma inflow rates than previously inferred. Seismicity increased and was widespread in line with increased stresses above an inflating sill at about 5 km depth. On 10-11 November, during nearly 12 hours of intense seismic activity, the magma found its way from the magma storage beneath Svartsengi some 2 km laterally towards the center of an old crater row and creating a 15 km long shallow dike. Subsidence was observed above Svartsengi as the magma was drained from beneath and a graben formed beneath the coastal town of Grindavík where extensive faulting caused considerable damage. On 18 December, a similar but smaller magma intrusive event originating in Svartsengi occurred, causing an eruption approximately at the center of the original dike. This time, earthquakes only occurred about 90 minutes before the eruption onset and no clear trend of earthquakes migrating from Svartsengi towards the laterally offset dike were detected. At the time of writing (10 January, 2024), a similar amount of magma volume is inferred to have accumulated beneath Svartsengi since shortly before the last eruption, however, seismicity is still at normal background levels. The volcano monitoring team at the Icelandic Meteorological Office in close collaboration with geoscientists at the Insitute of Earth Science at the University of Iceland and HS Orka, have been under immense pressure to interpret the ongoing activity. A vital part has been to interpret seismicity rates and earthquake locations and any changes thereof, along with modeling dike and sill inflow rates from geodetic measurements. We show that meaningful interpretation of earthquake activity can only be done when jointly interpreted together with deformation and stress models as stress changes heavily influence earthquake locations and the temporal onset of earthquake activity.
Since the 1985 Nevado del Ruiz eruption that killed over 23,000 people in Armero, Colombia, risk communication has become central to volcanic crisis management. Despite the development of effective tools and programmes for volcanic risk communication, considerable challenges remain.
Forecasting during a volcanic crisis is vital to the preservation of life and mitigation of loss during eruption. Decisions on when, where and how to evacuate, where to send the evacuees, and when they can return, are all informed by forecasts of impending volcanic activity. We review input data and models that underlie short-term forecasts during an eruption crisis, software and tools applied, how forecasts are framed, ways to integrate data during a crisis, and several case studies of forecasting in action. The workflow during a crisis can be simplified by precalculation of possible hazard impacts using long-term forecasting techniques. Short-term forecasts should be evaluated after a crisis in order to improve methodology and utility of forecast information. As data availability increases, computational tools are developed, unrest patterns are identified, and underlying processes better understood, there will continue to be improvements in volcanic crisis forecasting and decision support tools.
A 15 km long dike formed rapidly in the Reykjanes Peninsula oblique rift on 10 November 2023 and propagated under the town of Grindavík. From just before noon on 10 November until midnight, around 25 MW≥4 earthquakes occurred, two of which were of MW~5.2. Three-dimensional ground deformation is well resolved both temporally and spatially with dense Global Navigation Satellite System (GNSS) geodetic observations, which record cumulative displacements up to about 80 cm occurring mostly over 6 hours in the evening of 10 November and continuing at much reduced rates in the following days. Interferometric analysis of synthetic aperture radar images using Sentinel-1, COSMO-SkyMed, and ICEYE satellites records also well the dike deformation, which occurred simultaneously with deflation over the nearby central part of the Svartsengi volcanic system. Geodetic modelling, assuming uniform elastic host rock behavior, infers a dike volume of (130-139)×106 m3, with up to ~8 m dike opening, as well as some strike-slip shear motion. Deflation at Svartsengi in our model is best fit using a spherical point source with a volume decrease of (76-82)×106 m3up until 12 November. The temporal evolution of the dike opening was further modelled using hourly GNSS displacements, allowing better derivation of the temporal evolution of the flow rate into the dike and the contraction volume of the subsidence source. The maximum flow rate into the dike is inferred to be ~9500 m3/s, between 18:00 and 19:00 on November 10. We infer that the massive magma flow into the dike was established with only modest overpressure in the feeding magma body, a sufficiently large pathway opening at the boundary of the magma body, and pre-failure lowering of pressure along the pathway that had occurred through gradual build-up of high tensile stress over the previous eight centuries. This explains the unprecedented fast maximum magma flow rates that we infer. Such high flow rates provide insight into the formation of giant dike swarms under conditions of high tensile stress, and imply a high hazard potential for dike intrusions, considering their potential to transition into eruptions.
Abstract Unrest began in July 2021 at Askja volcano in the Northern Volcanic Zone (NVZ) of Iceland. Its most recent eruption, in 1961, was predominantly effusive and produced ∼0.1 km3 lava field. The last plinian eruption at Askja occurred in 1875. Geodetic measurements between 1983 and 2021 detail subsidence of Askja, decaying in an exponential manner. At the end of July 2021, inflation was detected at Askja volcano, from GNSS observations and Sentinel‐1 interferograms. The inflationary episode can be divided into two periods from the onset of inflation until September 2023. An initial period until 20 September 2021 when geodetic models suggest transfer of magma (or magmatic fluids) from within the shallowest part of the magmatic system (comprising an inflating and deflating source), potentially involving silicic magma. A following period when one source of pressure increase at shallow depth can explain the observations.
During the low -effusion rate Fagradalsfjall eruption (19 March - 18 September 2021), the emission of sulfur dioxide (SO 2 ) was frequently measured using ground -based UV spectrometers. The total SO 2 emitted during the entire eruption was 970 +/- 540 kt, which is only about 6% of the SO 2 emitted during the similar length Holuhraun eruption (2014 -2015). The eruption was divided into five phases based on visual observations, including the number of active vents and the occurrence of lava fountaining. The SO 2 emission rate ranged from 44 +/- 19 kg/s in Phase 2 to 85 +/- 29 kg/s in Phase 5, with an average of 64 +/- 34 kg/s for the entire eruption. There was notable variability in SO 2 on short timescales, with measurements on 11 August 2021 ranging from 17 to 78 kg/s. SO 2 flux measurements were made using scanning DOAS instruments located at different distances from and orientations relative to the eruption site augmented by traverses. Four hundred and forty-four scan and traverse measurements met quality criteria and were used, along with plume height and meteorological data, to calculate SO 2 fluxes while accounting for wind -related uncertainties. A tendency for stronger SO 2 flux concurrent with higher amplitude seismic tremor and the occurrence of lava fountaining was observed during Phases 4 and 5 which were characterized by intermittent crater activity including observable effusion of lava and gas release interspersed with long repose times. This tendency was used to refine the calculation of the amount of SO 2 emitted during variably vigorous activity. The continuous seismic tremor time series was used to quantify how long during these eruption phases strong/weak activity was exhibited to improve the calculated SO 2 flux during these Phases. The total SO 2 emissions derived from field measurements align closely with results obtained by combining melt inclusion and groundmass glass analyses with lava effusion rate measurements (910 +/- 230 kt SO 2 ). Specifically, utilizing the maximum S content found in evolved melt inclusions and the least remaining S content in accompanying quenched groundmasses provides an identical result between field measurements and the petrological calculations. This suggests that the maximum SO 2 release calculated from petrological estimates should be preferentially used to initialize gas dispersion models for basaltic eruptions when other measurements are lacking. During the eruption, the CALPUFF dispersion model was used to forecast ground -level exposure to SO 2 . The SO 2 emission rates measured by DOAS were used as input for the dispersion model, with updates made when a significant change was measured. A detailed analysis of one mid -distance station over the entire eruption shows that the model performed very well at predicting the presence of volcanic SO 2 when it was measured. However, it frequently predicted the presence of SO 2 that was not measured and the concentrations forecasted had no correlation with the concentrations measured. Various approaches to improve the model forecast were tested, including updating plume height and SO 2 flux source terms based on measurements. These approaches did not unambiguously improve the model performance but suggest that improvements might be achieved in morepolluted conditions.
Eruption source parameters (ESPs) are crucial for characterising volcanic eruptions and are essential inputs to numerical models used for hazard assessment. Key ESPs of explosive volcanic eruptions include plume height, mass eruption rate, eruption duration, and grain-size distribution. Some of these ESPs can be directly observed during an eruption, but others are difficult to measure in real-time, or indeed, accurately and precisely quantify afterwards. Estimates of ESPs for eruptions that cannot be observed, for example, due to the remote location of a volcano or poor weather conditions, are often defined using expert judgement and data from past eruptions, both from the volcano of interest and analogue volcanoes farther afield. Analysis of such information is time intensive and difficult, particularly during eruption response. These difficulties have resulted in the production of datasets to aid quick identification of ESPs prior to or during an eruption for use in operational response settings such as those at volcano observatories and Volcanic Ash Advisory Centres. These resources include the Mastin et al. (2009a) ESP dataset and the Catalogue of Icelandic Volcanoes and European Catalogue of Volcanoes aviation tables. Here, we review and compare these resources, which take different approaches to assigning ESPs. We identify future areas for development of these resources, highlighting the need for frequent updates as more knowledge of volcanic activity is gained and as modelling capabilities and requirements change.
Many examples of exposed giant dike swarms can be found where lateral magma flow has exceeded hundreds of kilometers. We show that massive magma flow into dikes can be established with only modest overpressure in a magma body if a large enough pathway opens at its boundary and gradual buildup of high tensile stress has occurred along the dike pathway prior to the onset of diking. This explains rapid initial magma flow rates, modeled up to about 7400 cubic meters per second into a dike ~15-kilometers long, which propagated under the town of Grindavík, Southwest Iceland, in November 2023. Such high flow rates provide insight into the formation of major dikes and imply a serious hazard potential for high–flow rate intrusions that propagate to the surface and transition into eruptions.
A Digital Twin Component (DTC) provides users with digital replicas of different components of the Earth system through unified frameworks integrating real-time observations and state-of-the-art numerical models. Scenarios of extreme events for natural hazards can be studied from the genesis to propagation and impacts using a single DTC or multiple coupled DTCs. The EU DT-GEO project (2022-2025) is implementing a prototype digital twin on geophysical extremes consisting of 12 interrelated Digital Twin Components, intended as self-contained and containerised software entities embedding numerical model codes, management of real-time data streams and data assimilation methodologies. DTCs can be deployed and executed in centralized High Performance Computing (HPC) and cloud computing Research Infrastructures (RIs). In particular, the DTC-V2 is implementing an ensemble-based automated operational system for deterministic and probabilistic forecast of long-range ash dispersal and local-scale tephra fallout. The system continuously screens different ground-based and satellite-based data sources and a workflow is automatically triggered by a volcanic eruption to stream and pre-process data, its ingestion into the FALL3D dispersal model, a centralized or distributed HPC model execution, and the post-processing step. The DTCs will provide capability for analyses, forecasts, uncertainty quantification, and "what if" scenarios for natural and anthropogenic hazards, with a long-term ambition towards the Destination Earth mission-like initiative.
The London Volcanic Ash Advisory Centre (VAAC) provides forecasts on the expected presence of volcanic ash in the atmosphere to mitigate the risk to aviation. It is fundamentally important that operational capability is regularly tested through exercises, to guarantee an effective response to an event. We have developed exercises which practise the pull-through of scientific advice into the London VAAC, the forecast evaluation process, and the decision-making procedures and discussions needed for generating the best possible forecasts under real-time conditions. London VAAC dispersion model forecasts are evaluated against observations. To test this capability in an exercise, we must create observation data for a hypothetical event. We have developed new methodologies for generating and using simulated satellite and lidar retrievals. These simulated observations enable us to practise our ability to interpret, compare, and evaluate model output and observation data under real-time conditions. Forecast evaluation can benefit from an understanding of how different choices of model setup (input parameters), model physics, and driving meteorological data impact the predicted extent and concentration of ash. Through our exercises, we have practised comparing output from model simulations generated using different models, model setups, and meteorological data, supplied by different institutions. Our exercises also practise the communication and interaction between Met Office (UK) scientists supporting the London VAAC and external experts, enabling knowledge exchange and discussions on the interpretation of model output and observations, as we strive to deliver the best response capability for the aviation industry and stakeholders. In this paper, we outline our exercise methodology, including the use of simulated satellite and lidar observations, and the development of the strategy to compare output generated from different modelling systems. We outline the lessons learnt, including the benefits and challenges of conducting exercises which practise our ability to provide scientific advice for an operational response at the London VAAC.
Volcano observatories (VOs) around the world are required to maintain surveillance of their volcanoes and inform civil protection and aviation authorities about impending eruptions. They often work through consolidated procedures to respond to volcanic crises in a timely manner and provide a service to the community aimed at reducing the potential impact of an eruption. Within the International Airways Volcano Watch (IAVW) framework of the International Civil Aviation Organisation (ICAO), designated State Volcano Observatories (SVOs) are asked to operate a colour coded system designed to inform the aviation community about the status of a volcano and the expected threats associated. Despite the IAVW documentation defining the different colour-coded levels, operating the aviation colour code in a standardised way is not easy, as sometimes, different SVOs adopt different strategies on how, when, and why to change it. Following two European VOs and Volcanic Ash Advisory Centres (VAACs) workshops, the European VOs agreed to present an overview on how they operate the aviation colour code. The comparative analysis presented here reveals that not all VOs in Europe use this system as part of their operational response, mainly because of a lack of volcanic eruptions since the aviation colour code was officially established, or the absence of a formal designation as an SVO. We also note that the VOs that do regularly use aviation colour code operate it differently depending on the frequency and styles of eruptions, the historical eruptive activity, the nature of the unrest, the monitoring level, institutional norms, previous experiences, and on the agreement they may have with the local Air Transport Navigation providers. This study shows that even though the aviation colour code system was designed to provide a standard, its usage strongly depends on the institutional subjectivity in responding to volcano emergencies. Some common questions have been identified across the different (S)VOs that will need to be addressed by ICAO to have a more harmonised approach and usage of the aviation colour code.
Explosive volcanic eruptions inject hot mixtures of solid particles (tephra) and gasses into the atmosphere. Entraining ambient air, these mixtures can form plumes rising tens of kilometers until they spread laterally, forming umbrella clouds. While the largest clasts tend to settle in proximity to the volcano, the smallest fragments, commonly referred to as ash (≤2 mm in diameter), can be transported over long distances, forming volcanic clouds. Tephra plumes and clouds pose significant hazards to human society, affecting infrastructure, and human health through deposition on the ground or airborne suspension at low altitudes. Additionally, volcanic clouds are a threat to aviation, during both high-risk actions such as take-off and landing and at standard cruising altitudes. The ability to monitor and forecast tephra plumes and clouds is fundamental to mitigate the hazard associated with explosive eruptions. To that end, various monitoring techniques, ranging from ground-based instruments to sensors on-board satellites, and forecasting strategies, based on running numerical models to track the position of volcanic clouds, are efficiently employed. However, some limitations still exist, mainly due to the high unpredictability and variability of explosive eruptions, as well as the multiphase and complex nature of volcanic plumes. In the next decades, advances in monitoring and computational capabilities are expected to address these limitations and significantly improve the mitigation of the risk associated with tephra plumes and clouds.
Abstract Outgassing of sulfur (as SO2) is one of the principal hazards posed by volcanic eruptions. However, S emission potentials of most volcanoes globally are poorly constrained due to a short observational record and an incomplete understanding of the magmatic processes that influence pre‐eruptive S concentrations. Here, we use a compilation of published and new data from melt inclusions (MIs)—which can preserve magmatic S concentrations prior to eruptive degassing—from the Iceland hotspot to evaluate the effects of mantle melting and crustal magmatic processes on the S budgets of Icelandic melts. We use MI data to estimate S emission potentials (ΔSmax, in ppm S) for 73 eruptions from 22 of Iceland's presently active ∼33 volcanic systems. We show that the S systematics of Icelandic melts are strongly regulated by the sulfide solubility limit. Sulfide‐saturated conditions during lower‐degree mantle melting, prevalent at off‐rift zones, likely explains observed decoupling between S and Cl. During magmatic differentiation, a local maximum in modeled sulfide solubility occurs in evolved basalts (4–6 wt.% MgO), coinciding with highest MI S concentrations. Highest ΔSmax values (2,100–2,600 ppm) are found in the Hekla 1913 CE, Eldgjá 939 CE, and Surtsey 1963–1967 CE eruptions in the South Iceland Volcanic Zone. Our results extend the record of volcanic sulfur emissions back in time and can be used to assess volcanic gas hazards at Icelandic volcanoes where no direct measurements are available. Broadly, the results underline the governing role of sulfide saturation during melting and magma differentiation in controlling the eruptible S contents of Icelandic magmas.
<p>Precursors to volcanic eruptions vary widely between volcanic systems and their individual eruptions. Volcanic systems in Iceland undergoing unrest include the Reykjanes, Svartsengi, Fagradalsfjall, and Kr&#237;suv&#237;k systems on the obliquely spreading Reykjanes Peninsula. Main precursors prior to the Fagradalsfjall eruptions in 2021 and 2022 were signals associated with the formation of dikes releasing stored tectonic stress over weeks and days, respectively. If volcanic activity occurs at Fagradalsfjall in coming years it may be associated with shorter warning time, as less stored tectonic stress remains. In contrast, the nearby Svartsengi system experienced cumulative uplift of about 15 cm in multiple inflation episodes during 2020 to 2022, modeled as repeating sill intrusions. Prior to, in-between, and following the intrusive events, the surface subsided. We find that the onset of diking accompanied by a sudden increase in seismicity and deformation rates is a likely scenario prior to future eruptions on the Reykjanes Peninsula. A decline in seismicity and/or deformation may occur as unrest activity progresses, as experienced prior to the 2021 and 2022 eruptions. In other areas of Iceland, since 2020 magma storage areas with increasing pressure have been identified at the Askja, Gr&#237;msv&#246;tn, Krafla, and B&#225;r&#240;arbunga calderas, as well as at Hekla volcano. Increasing pressure buildup in the roots of these volcanoes, is expected to a varying degree prior to next eruption, with different amounts of inflation and seismicity. Tectonic stress release as observed during the 2014/15 B&#225;r&#240;arbunga rifting event may occur or not. The largest capacity for pressure increase is expected at the Askja caldera, where the surface over the magma chamber subsided by more than 1 m from 1983 to 2021, but since August 2021 over 45 cm of uplift has occurred and deformation continues. The amount of subsidence prior to present uplift may indicate the scale of further inflation needed to reach critical conditions, assuming that the current inflation is sourced in a similar crustal volume as the deflation, and the strength of the surrounding material remains similar (e.g., no new faulting/fracturing). Examples of intermittent flow of magma to shallow depth, or pressure increase beneath calderas, occurred during 2017-2018 at &#214;r&#230;faj&#246;kull, where a slight increase in seismicity has been detected in recent months, and inflation 2018-2019 at Torfaj&#246;kull caldera. It remains a challenge to promptly identify seismic swarms that may be indicative of formation of magma feeding conduits versus those indicating intermittent increases in seismic activity due to high stress levels, e.g., caused magma recharging, changes in geothermal activity, or glacial retreat. Experience from the Northern Volcanic Zone and the Reykjanes Peninsula oblique rift, suggest precursory activity may take place simultaneously over wide parts of plate boundary areas, indicating to some extent coupled activity of nearby volcanic systems.</p>
This work was born from a wish of remembering the fundamental contribution of Prof. Frank Silvio Marzano to the field of physical volcanology. In fact, for the last fifteen years and in the context of several European projects, Prof. Marzano collaborated with many volcanologists as well as scientists from different fields and wrote many scientific articles aimed at studying the dynamics of explosive eruptions. He left his imprinting in this research sector laying the foundations of radar volcanology in Italy, and extended his studies to other sensors. His work is relevant for the analysis of the main eruption source parameters needed to characterize the eruptive events. Here we show how remote sensing instruments applied to analyze explosive activity of different volcanoes worldwide, are going to increase the knowledge in this multidisciplinary research area and the awareness from the scientific community of the potential of these sensors at various wavelengths.
The 6-month-long effusive eruption at the Fagradalsfjall volcano in 2021 is the most visited eruption site in Iceland to date (June 2023), and it needed intense lava flow hazard assessment. In this study we document how strategies for lava flow modeling were implemented using the stochastic model MrLavaLoba to evaluate hazards during this effusive event. Overall, the purposes were threefold: (a) pre-eruption simulations to investigate potential lava inundation of critical infrastructure, (b) syn-eruption simulations for short-term (2-week time frame) lava flow hazard assessment and (c) syn-eruption simulations for long-term (months to years) hazard assessments. Additionally, strategies for lava barrier testing were developed, and syn-eruption topographic models were incorporated into simulations in near real time. The model provided promising results that were shared regularly at stakeholder meetings with the monitoring personnel, scientists and civil-protection representatives helping to identify potential short-term and long-term lava hazards. This included evaluation of the timing of barrier overflow and the filling and spilling of lava from one valley to another. During the crisis the MrLavaLoba model was updated to increase functionality such as by considering multiple active vents. Following the eruption, the model was optimized substantially, decreasing the computational time required for the simulations and speeding up the delivery of final products.
Abstract Volcano Observatories (VOs) around the world are required to maintain surveillance of their volcanoes and inform civil protection and aviation authorities about impending eruptions. They often work through consolidated procedures to respond to volcanic crises in a timely manner and provide a service to the community aimed at reducing the potential impact of an eruption. Within the International Airways Volcano Watch (IAVW) framework of the International Civil Aviation Organisation, designated State Volcano Observatories (SVOs) are asked to operate a colour coded system designed to inform the aviation community about the status of a volcano and the expected threats associated. Despite the IAVW documentation defining the different colour-coded levels, operating the Aviation Colour Code (ACC) in a standardised way is not easy, as sometimes, different SVOs adopt different strategies on how, when, and why to change it. Following two European VOs and Volcanic Ash Advisory Centres (VAACs) workshops, the European VOs agreed to present an overview on how they operate the ACC. The comparative analysis presented here reveals that not all VOs in Europe use the ACC as part of their operational response, mainly because of a lack of volcanic eruptions since the ACC was officially established, or the absence of a formal appointment as an SVO. We also note that the VOs, which do regularly adopt ACC, operate differently depending on the frequency and styles of eruptions, the historical eruptive activity, the nature of the unrest, the monitoring level, and also on the agreement they may have with the local Air Transport Navigation providers. This study shows that even though the ACC system was designed to provide a standard, its usage strongly depends on the evaluation of the actors responding to the volcano emergencies. Some common questions have been identified across the different (S)VOs that will need to be addressed by ICAO in order to have a more harmonised approach and usage of the ACC.
 M Pfeffer合作论文数49
 michelle parks合作论文数Icelandic Meteorological Office32
 Kristín Vogfjörd合作论文数Icelandic Meteorological Office32
 Freysteinn Sigmundsson合作论文数Nordic Volcanological Centre, Institute of Earth Sciences, University of Iceland27
 Kristín Jónsdóttir合作论文数Iceland Meteorol Off, IS-150 Reykjavik, Iceland26
 benedikt ofeigsson合作论文数Icelandic Meteorol Off, Reykjavik, Iceland26
 Evgenia Ilyinskaya合作论文数Icelandic Meteorological Office24
 Andy Hooper合作论文数School of Earth and Environment, Faculty of Environment, University of Leeds;SatSense23
 Magnus Tumi Gudmundsson合作论文数Institute of Earth Sciences, University of Iceland23
 Sigrun Hreinsdottir合作论文数GNS Sci19
 Halldor Geirsson合作论文数Physics Department, Icelandic Meteorological Office18
 Baldur Bergsson合作论文数Icelandic Meteorological Office17Vincent Drouin合作论文数Iceland GeoSurvey16
 Mattia De’ Michieli Vitturi合作论文数Istituto Nazionale di Geofisica e Vulcanologia Sezione di Pisa Via della Faggiola, 32 56126 Pisa Italy16
 Páll Einarsson合作论文数Department of Geophysics, School of Engineering and Natural Sciences, Faculty of Earth Sciences, University of Iceland15A. Neri合作论文数14
 Bjorn Oddsson合作论文数Icelandic Meteorological Office, Institute of Earth Sciences;University of Iceland14
 Macedonio Giovanni合作论文数Osservatorio Vesuviano, Istituto Nazionale di Geofisica e Vulcanologia;Volcanic Hazards Centre, Istituto Nazionale di Geofisica e Vulcanologia13
 Andri Stefánsson合作论文数School of Engineering and Natural Sciences, Faculty of Earth Sciences, University of Iceland13
 Manuel Titos合作论文数Department of Signal Processing, Telematics and Communications, University of Granada, Granada, Spain12
 Laura Sandri合作论文数Istituto Nazionale di Geofisica e Vulcanologia Bologna Italy12E. B. Jonasdottir合作论文数11
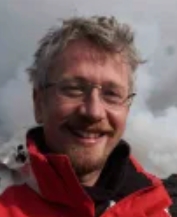 Mike Burton合作论文数Department of Earth and Environmental Sciences, School of Natural Sciences, Faculty of Science and Engineering, The University of Manchester11
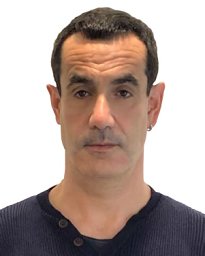 Arnau Folch合作论文数Barcelona Supercomputing Center (BSC), Barcelona, Spain11
 Donovan Amy合作论文数Department of Geography, University of Cambridge11
 Antonio Costa合作论文数Istituto Nazionale di Geofisica e Vulcanologia - Sezione di Bologna11Matthew J. Roberts合作论文数Monitoring and Forecast Division, Icelandic Meteorological Office11
 G. B. M. Pedersen合作论文数11Bergrún Arna Óladóttir合作论文数Icelandic Meteorological Office10
 Anja Schmidt合作论文数Faculty of Physics, Ludwig-Maximilians-Universität München;Institute of Atmospheric Physics, German Aerospace Center;Yusuf Hamied Department of Chemistry, University of Cambridge;School of Earth and Environment, University of Leeds10
 Jóhannsson Thorsteinn合作论文数Environmental Agency of Iceland10Stéphanie Dumont合作论文数10
 Tobias Durig合作论文数Inst Earth Sci, Univ Iceland9
 Tamsin Mather合作论文数Department of Earth Sciences, University of Oxford9
 Gunnar Gudmundsson合作论文数Department of Respiratory Medicine and Allergology, Landspitali-University Hospital9
 Vala Hjorleifsdottir合作论文数Seismological Laboratory, California Institute of Technology9
 G. Stefansdottir合作论文数Julius Centre for Health Sciences and Primary Care, University Medical Centre (UMC),9
 Simona Scollo合作论文数Sezione Catania, Osservatorio Etneo9
 Sibylle von Lowis合作论文数8Talfan D. Barnie合作论文数University of Cambridge, University of Cambridge8
 Nicole S. Keller合作论文数8
 Peter Baxter合作论文数University of Cambridge8
 Eyjólfur Magnússon合作论文数Institute of Earth Sciences, School of Engineering and Natural Sciences, University of Iceland;Faculty of Earth Sciences, School of Engineering and Natural Sciences, University of Iceland8
 Guðrún Nína Petersen合作论文数8
 Þórdís Högnadóttir合作论文数Institute of Earth Sciences, University of Iceland;School of Engineering and Natural Sciences, University of Iceland8
 Augusto Neri合作论文数Istituto Nazionale di Geofisica e Vulcanologia, Sezione di Pisa, Via della Faggiola 32, 56126 Pisa, Italy8Hildur Friðriksdóttir合作论文数7Tryggvi Hjörvar合作论文数7Claire Witham合作论文数7




