Figure S17. Cell deconvolution and cell specificity of spatial transcriptomic expression.
Figure S11. Identified ligand-receptor interactions involving CT-26 KRASG12C cells following no treatment.
Figure S14. Analysis of T-cell function, expansion and TCR clonotype analysis after KRAS(G12C)i and MEKi.
Table S1. Mouse T cell phenotyping antibody panel; Table S2. Mouse macrophage phenotyping antibody panel; Table S3. Mouse dendritic cell phenotyping antibody panel; Table S4. Mouse T cell function antibody panel; Table S5. FACS panel for RNA-seq; Table S6. Antibodies used to BMDC co-culture.
Abstract Although mutant-specific KRAS inhibitors are approved to treat cancer, a deeper understanding of intratumoral changes driven specifically by KRAS inhibition is needed to maximize therapeutic responses. In this study, we used single-cell RNA sequencing, flow cytometry, and spatial transcriptomics to distinguish mechanisms of tumor control after KRASG12C inhibition [KRAS(G12C)i] or MEK inhibition (MEKi). Despite both inhibiting the MAPK pathway, KRAS(G12C)i and MEKi drive the adaptation of distinct neoplastic cell fates affecting metabolism and cell-cycle regulation, and additive tumor suppression is observed after co-administration. KRAS(G12C)i results in the emergence of a specific, cDC1-driven mature conventional dendritic cell (cDC) state. Coculture of treated neoplastic cells with cDC1s is sufficient to upregulate maturation markers such as CCR7, and intercellular communication analyses suggest that activation is augmented through nonimmune mediators. Both KRAS(G12C)i and MEKi increase infiltration of cytotoxic T cells, but MEKi, which also targets nonmalignant cells, is associated with a reduced capacity for T-cell proliferation and degranulation, consistent with distinct adaptive immune activation mechanisms. We observe that combination treatment of KRAS(G12C)i with anti–PD-1 immunotherapy further expands effector T-cell states, increases clonal persistence, and induces proinflammatory macrophages associated with higher overall survival that were largely absent after KRAS(G12C)i alone. Furthermore, combination treatment enhances intercellular communication networks among non–PD-1+–expressing cells that can perpetuate cDC activation. Our findings delineate distinct tumor and immune responses to KRAS and MEK inhibition and identify molecular features of the responding tumor microenvironment that may be leveraged to improve therapeutic efficacy.
Figure S1. Quality filtering of scRNA-seq of all cells from CT-26 KRASG12C syngeneic tumors and classification of cell types.
Figure S18. Spatial transcriptomic analysis of immune signatures and enhanced intercellular communication following KRAS(G12C)i with anti-PD-1 blockade.
Figure S4. Classification of immune cell types in treated CT-26 KRASG12C syngeneic tumors.
Figure S6. Characterization of classical dendritic cell states (cDC) in treated tumors.
Figure S8. In-vitro bone marrow-derived dendritic cell (BMDC) co-culture with treated KRASG12C cell lines.
Figure S10. Identified ligand-receptor interactions involving neoplastic cells following KRAS(G12C)i and MEKi treatment.
Figure S3. Quality assessment of single-cell RNA-seq in CD45+ tumor-infiltrating immune cells.
Figure S15. Cell state dynamics of intratumoral monocytes and macrophages after KRAS(G12C)i and MEKi.
Figure S9. Summary of intratumoral inter-cellular signaling interactions in CT-26 KRASG12C.
Figure S16. CD8 T cell intratumoral dynamics following KRAS(G12C)i and anti-PD1 combination therapy.
Figure S12. Intercellular communication between neoplastic cells and non-immune cells in CT-26 KRASG12C tumors.
Figure S13. Tumor infiltrating T cell states and expression dynamics after KRAS(G12C)i and MEKi.
 Wing Hung Wong合作论文数Department of Statistics, School of Humanities and Sciences, Stanford University11
 Alexander Eckehart Urban合作论文数6
 Rui Jiang (江瑞)合作论文数Department of Automation, School of Information Science and Technology, Tsinghua University6
 Joachim Hallmayer合作论文数Department of Psychiatry and Behavioral Sciences, School of Medicine, Stanford University6Xianglong Zhang合作论文数Stanford Univ, Sch Med, Dept Psychiat & Behav Sci, Stanford, CA 94305 USA4
 Xiang Zhu合作论文数Statistics Department, Stanford University4
 Tao Jiang (姜涛)合作论文数Department of Computer Science and Engineering, University of California - Riverside;Beijing National Research Center for Information Science and Technology, Tsinghua University;Shanghai Center for Bioinformation Technology4Carolin Purmann合作论文数Departments of Genetics, Stanford University School of Medicine4Jonathan A Bernstein合作论文数3Kasey N Davis合作论文数3
 Catherine Tcheandjieu合作论文数VA Palo Alto Hlth Care Syst, Palo Alto, CA USA3
 Scott M. Damrauer合作论文数Surgery Faculty, Perelman School of Medicine, University of Pennsylvania3Reenal Pattni合作论文数3Hilliard Austin T合作论文数Department of Integrative Biology and Physiology, University of California Los Angeles3
 Clarke Shoa L合作论文数Department of Genetics, Stanford University3
 Julie A Lynch合作论文数3
 Christopher J. O'Donnell合作论文数Chobanian & Avedisian School of Medicine, Boston University;Novartis Institutes for BioMedical Research;Harvard Medical School;U.S. Department of Veterans Affairs;Brigham and Women's Hospital3
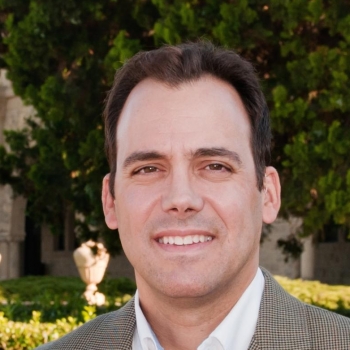 Themistocles (Tim) Assimes合作论文数Division of Cardiovascular Medicine, School of Medicine, Stanford University;Palo Alto Epidemiology Research and Information Center for Genomics, Palo Alto VA Hospital3
 Philip S. Tsao合作论文数Division of Cardiovascular Medicine, School of Medicine, Stanford University;Cardiovascular Institute, School of Medicine, Stanford University3
 Peter Wilson合作论文数Division of Cardiology, Department of Medicine, School of Medicine, Emory University;Rollins School of Public Health, Emory University;Atlanta VA Medical Center3
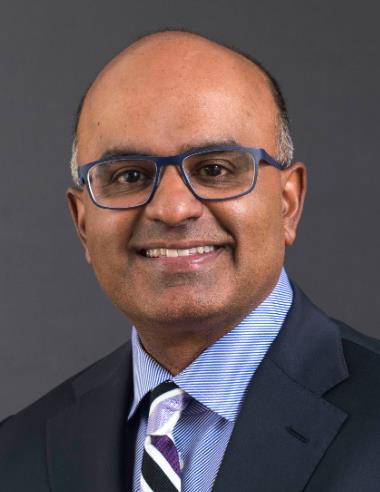 Sekar Kathiresan合作论文数Eli Lilly and Company;Verve Therapeutics;Department of Medicine, Massachusetts General Hospital3
 Si-Ming Zhang合作论文数Kunming Institute of Zoology Chinese Academy of Sciences, Chinese Academy of Sciences3
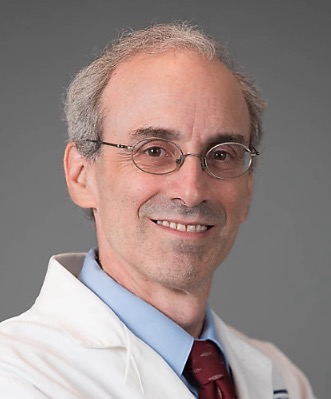 John Michael Gaziano合作论文数Division of Aging, Brigham and Women's Hospital;Harvard Medical School3Yuk-Lam Ho合作论文数2Lian-Shuo Li合作论文数2
 Lynne R. Wilkens合作论文数University of Hawaiʻi Cancer Center, University of Hawaiʻi at Mānoa2Botong Shen合作论文数2
 Pradeep Natarajan合作论文数Mass General Research Institute, Massachusetts General Hospital;Broad Institute of MIT and Harvard;Harvard Medical School2
 Hampton Leonard合作论文数National Institute on Aging and National Institute of Neurological Disorders and Stroke, National Institutes of Health;Data Tecnica International LLC;National Institute on Aging, National Institutes of Health;University of Tuebingen;National Institutes of Health, University of Tuebingen2Rebecca J Song合作论文数2Chi-Ming Li合作论文数2Nasa Sinnott-Armstrong合作论文数Stanford Univ, Dept Genet, Stanford, CA 94305 USA2
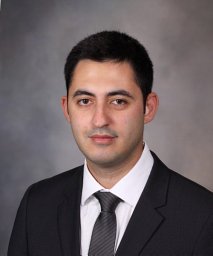 Ozan Dikilitas合作论文数Mayo Clin, Rochester, MN USA2Jeffrey Haessler合作论文数Division of Public Health Sciences, Fred Hutchinson Cancer Research Center, Seattle, WA, USA.2Zheng Wei合作论文数Tsinghua Univ, Ctr Synthet & Syst Biol, TNLIST Dept Automat, Bioinformat Div, Beijing 100084, Peoples R China2Zicheng Wang合作论文数Bioinformatics Division, TNLIST and Department of Automation, Tsinghua University, Beijing 100084, China2Lei Wei (魏磊)合作论文数2Kui Hua合作论文数2Kyung Min Lee合作论文数2Danish Saleheen合作论文数2Thomas Ward合作论文数Stanford Univ, Urban Lab, Dept Psychiat & Behav Sci, Palo Alto, CA 94304 USA2Noah L Tsao合作论文数Department of Surgery, Perelman School of Medicine, University of Pennsylvania, Philadelphia, Pennsylvania, United States of America.2Derek Klarin合作论文数Malcolm Randall VA Med Ctr, Gainesville, FL USA2Aris Baras合作论文数Regeneron Genet Ctr, Tarrytown, NY 10591 USA2
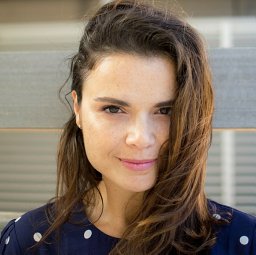 Marijana Vujkovic合作论文数Department of Medicine, University of Pennsylvania Perelman School of Medicine2
 Elizabeth Hauser合作论文数Department of Biostatistics and Bioinformatics, Duke University School of Medicine2
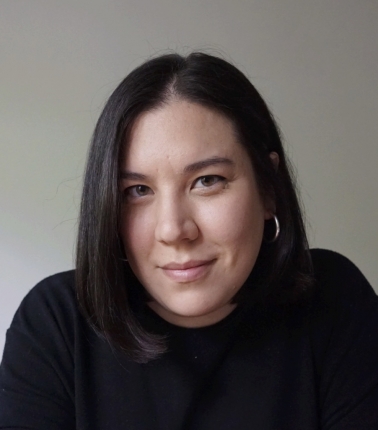 Genevieve Wojcik合作论文数Epidemiology, Bloomberg School of Public Health, Johns Hopkins University2Rachel L. Kember合作论文数Department of Psychiatry, Perelman School of Medicine, University of Pennsylvania2Kyong-Mi Chang合作论文数Division of Gastroenterology, Department of Medicine, Perelman School of Medicine, University of Pennsylvania2




