The usage of machine learning techniques is widely spread and has also been implemented in the wind industry in the last years. Many of these techniques have shown great success but need to constantly prove the expectation of functionality. This paper describes a new method to monitor the health of a wind turbine using an undercomplete autoencoder. To evaluate the health monitoring quality of the autoencoder, the number of anomalies before an event has happened are to be considered. The results show that around 35% of all historical events that have resulted into a failure show many anomalies. Furthermore, the wind turbine subsystems which are subject to good detectability are the rotor system and the control system. If only one third of the service duties can be planned in advance, and thereby the scheduling time can be reduced, huge cost saving potentials can be seen.
Analyzing large amounts of graph data, e.g., from social networks or bioinformatics, has recently gained much attention. Unfortunately, tool support for handling and analyzing such graph data is still weak and scalability to large data volumes is often limited. We introduce the BIGGR approach providing a novel tool for the user-friendly and efficient analysis and visualization of Big Graph Data on top of the open-source software KNIME and gradoop . Users can visually program graph analytics workflows, execute them on top of the distributed processing framework Apache Flink and visualize large graphs within KNIME. For visualization, we apply visualization-driven data reduction techniques by pushing down sampling and layouting to gradoop and Apache Flink. We also discuss an initial application of the tool for the analysis of patent citation graphs.
The reliable integration of decentralized energy technologies and the associated system transformations represent a challenging task. Taking into account existing cross-sectoral demand and supply structures, diverse communities require specific solutions. With an appropriate business model, municipal utilities might be capable to transform themselves in a successful way. For better decision-making, they need to investigate under what conditions certain business cases might represent a sustainable part of the future system and their future portfolio. On the basis of an innovative multi-model and cross-sector approach, this research paper aims to assess opportunities of such business models in terms of four strategic targets: affordability, profitability, autarky and ecology. The results of the combined evaluation of synthetic case studies provide insights under what conditions different business models show positive performance.
Because more than 90 percent of mobile apps are free, advertising on them is a key revenue source for their developers. Advertisements are served on apps through embedded specialized code called ad libraries. Unlike with other types of libraries, app developers can't ignore new ad libraries or new versions of embedded ad libraries without risking revenue loss. However, updating ad libraries incurs costs, which can become problematic as these updates become more frequent. Researchers investigated the costs of updating ad libraries and explored the frequency of ad library updates in Android apps. An analysis of numerous versions of Android apps over 12 months showed that almost half underwent ad library updates (an ad library was added, removed, or updated). Moreover, in nearly 14 percent of the app updates with at least one ad library update, no changes to the app's API occurred. This suggests that maintaining the ad libraries entailed substantial additional effort for the developers.
Unlike products on Amazon.com, mobile apps are continuously evolving, with new versions rapidly replacing the old ones. Nevertheless, many app stores still use an Amazon-style rating system, which aggregates every rating ever assigned to an app into one store rating. To examine whether the store rating captures the changing user satisfaction levels regarding new app versions, researchers mined the store ratings of more than 10,000 mobile apps in Google Play, every day for a year. Even though many apps' version ratings rose or fell, their store rating was resilient to fluctuations once they had gathered a substantial number of raters. The conclusion is that current store ratings aren't dynamic enough to capture changing user satisfaction levels. This resilience is a major problem that can discourage developers from improving app quality.
Because more than 90 percent of mobile apps are free, advertising on them is a key revenue source for their developers. Advertisements are served on apps through embedded specialized code called ad libraries. Unlike with other types of libraries, app developers can't ignore new ad libraries or new versions of embedded ad libraries without risking revenue loss. However, updating ad libraries incurs costs, which can become problematic as these updates become more frequent. Researchers investigated the costs of updating ad libraries and explored the frequency of ad library updates in Android apps. An analysis of numerous versions of Android apps over 12 months showed that almost half underwent ad library updates (an ad library was added, removed, or updated). Moreover, in nearly 14 percent of the app updates with at least one ad library update, no changes to the app's API occurred. This suggests that maintaining the ad libraries entailed substantial additional effort for the developers.
Android applications (apps) are highly interactive, but have— by design—no facilities to declare dependencies reflecting such interactions. Dependencies are hidden in code and uncovering them requires static analysis techniques. This technical note presents our static analysis infrastructure to extract dependency information from Android (Dalvik) bytecode. This infrastructure is used in a study of variability mechanisms in software ecosystems [5]. In the present paper, we provide details on the implementation, our dataset, and the statistics we calculated.
In less than five years, the number of mobile apps has grown exponentially, with more than 1 million available in the largest mobile app stores. One explanation for this growth could be the adoption of well-proven software engineering practices--in particular, software reuse despite the often conjectured lack of training among mobile app developers. A study of hundreds of thousands of Android apps across 30 different categories found substantial software reuse, indicating that while these apps benefit from increased productivity, they're also more dependent on the quality of the apps and libraries that they reuse.
One of the most popular ways to monetize a free app is by including advertisements in the app. Several advertising (ad) companies provide these ads to app developers through ad libraries that need to be integrated in the app. However, the demand for ads far exceeds the supply. This obstacle may lead app developers to integrate several ad libraries from different ad companies in their app to ensure they receive an ad with each request. However, no study has explored how many ad libraries are commonly integrated into apps. Additionally, no research to date has examined whether integrating many different ad libraries impacts an app's ratings. This article examines these two issues by empirically examining thousands of Android apps. The authors find that there are apps with as many as 28 ad libraries, but they find no evidence that the number of ad libraries in an app is related to its possible rating in the app store. However, integrating certain ad libraries can negatively impact an app's rating.
We suggest an algorithm to automatically identify changes in the production of DC power that may indicate malfunctions of two-axis trackers as well as of photovoltaic modules connected to the same string. The algorithm uses DC current sensor data exclusively. No information about the specific characteristics of the PV power plant is needed. The algorithm is sensitive to relative changes in the power production as little as 1% while at the same time being nonsensitive against weather based noise like cloud shadows. The evaluation shows a detection rate of up to 90% while keeping the rate of false alarms low (about 12%). Our method can also be applied as-is to other monitoring tasks like temperature anomalies in inverters (failed cooling) or disturbances in the synchronicity of AC current phases in transformers
Context: Software ecosystems are increasingly popular for their economic, strategic, and technical advantages. Application platforms such as Android or iOS allow users to highly customize a system by selecting desired functionality from a large variety of assets. This customization is achieved using variability mechanisms.Objective: Variability mechanisms are well-researched in the context of software product lines. Although software ecosystems are often seen as conceptual successors, the technology that sustains their success and growth is much less understood. Our objective is to improve empirical understanding of variability mechanisms used in successful software ecosystems.Method: We analyze five ecosystems, ranging from the Linux kernel through Eclipse to Android. A qualitative analysis identifies and characterizes variability mechanisms together with their organizational context. This analysis leads to a conceptual framework that unifies ecosystem-specific aspects using a common terminology. A quantitative analysis investigates scales, growth rates, and-most importantly-dependency structures of the ecosystems.Results: In all the studied ecosystems, we identify rich dependency languages and variability descriptions that declare many direct and indirect dependencies. Indirect dependencies to abstract capabilities, as opposed to concrete variability units, are used predominantly in fast-growing ecosystems. We also find that variability models-while providing system-wide abstractions over code work best in centralized variability management and are, thus, absent in ecosystems with large free markets. These latter ecosystems tend to emphasize maintaining capabilities and common vocabularies, dynamic discovery, and binding with strong encapsulation of contributions, together with uniform distribution channels.Conclusion: The use of specialized mechanisms in software ecosystems with large free markets, as opposed to software product lines, calls for recognition of a new discipline variability encouragement. (C) 2014 Elsevier B.V. All rights reserved.
One of the most popular ways to monetize a free app is by including advertisements in the app. There are several advertising (ad) companies that provide these ads to the app developers through ad libraries that need to be integrated in the app. However, the demand for ads far exceeds the supply for them. This obstacle may lead app developers to integrate several ad libraries from different ad companies in their app to assure receiving an ad when requested. However, there is no empirical evidence so far about how many ad libraries are integrated in an app. Additionally, there is no current research to examine if integrating many different ad libraries has an impact on the ratings of an app. In this paper, we examine these two issues, by empirically examining thousands of Android apps. We find that there are apps with as many as 28 ad libraries. We find no evidence that the number of ad libraries in an app is related to the ratings that an app can get. However, integrating certain specific ad libraries can negatively impact the rating of an app.
Today, the operation of sustainable power plants mainly relies on visualization of power production. Measurement data of such power plants are often discarded. We show the idle potential of such data by applying a state of the art algorithm to recognize malfunctions in a photovoltaic power plant. Up to now, these failures could only be found by manual inspection of the power plant every six weeks. Our results show a substantial financial benefit: power outages of power plant components due to fuse failures often can be recognized within days. This fact results in a reduction of financial losses up to at least 63% by being able to schedule repairs
Web Services sind eine verbreitete Technik zur Realisierung von serviceorientierten Architekturen (SOA). In dezentral organisierten Umgebungen behindert die Notwendigkeit statisch getypter Schnittstellen und die mangelnde Unterstützung fachlicher Intensionen durch technische Realisierungskonzepte die Herausbildung agiler SOA-Communities. In diesem Beitrag wird diskutiert, inwiefern die Implementierungskonzepte des rasant wachsenden Android-Ökosystems Ansatzpunkte für eine höhere Flexibilät und bessere Wiederverwendung von lose gekoppelten SOA-Umgebungen eröffnen und welche Gestaltungshinweise an etablierte Techniken (z. B. Web Services) sich hieraus ableiten lassen.
BioTechniquesVol. 40, No. 2 BenchmarksOpen AccessCalcDalton: a tool for multiplex genotyping primer design for single-base extension reactions using cleavable primersHolger Kirsten, Steffen Dienst, Frank Emmrich & Peter AhnertHolger KirstenUniversity of Leipzig, Leipzig, Germany, Steffen DienstUniversity of Leipzig, Leipzig, Germany, Frank EmmrichUniversity of Leipzig, Leipzig, Germany & Peter Ahnert*Address correspondence to Peter Ahnert, University of Leipzig, Faculty of Medicine, IKIT/BBZ, Center for Biotechnology and Biomedicine, Johannisallee 30, 04103 Leipzig, Germany. e-mail: E-mail Address: peter.ahnert@gmx.netUniversity of Leipzig, Leipzig, GermanyPublished Online:21 May 2018https://doi.org/10.2144/000112115AboutSectionsView ArticleSupplemental MaterialPDF/EPUB ToolsAdd to favoritesDownload CitationsTrack Citations ShareShare onFacebookTwitterLinkedInRedditEmail View article Matrix-assisted laser desorption/ionization time-of-flight mass spectrometry (MALDI-TOF MS) is now one of the most automated and efficient single nucleotide polymorphism (SNP) detection methods. It delivers highly accurate results with exceptional reliability (1). However, one problem in MALDI-TOF MS nucleic acid detection arises from the negatively charged sugar phosphate backbone leading to adducts with cations. Established methods to overcome this problem include cleavage of the genotyping primer at a specific site. The site is defined by incorporating a cleavable linker within the primer during synthesis. Various linker chemistries exist (2–4), and depending on the type of linker, cleavage can occur by photo-optical or chemical means. This releases a smaller product for measurement with a decreased number of charges. Additionally, analysis of smaller fragments increases sensitivity, resolution, and accuracy in mass spectrometry (5). Several methods using this approach have been described (2–4). Another advantage of cleavable sites is the possibility to flexibly space the signals of primers and primer extension products in MALDI-TOF MS detection. The size of the fragments to be detected is directly related to the position of the cleavable linker. Higher multiplexing of genotyping reactions increases throughput and cuts down costs. Determination of optimal linker positions—especially for higher multiplex numbers—is simple in principle but cumbersome and daunting in practice, due to the many parameters to be considered. These include resolution and mass range of the MALDI-TOF MS device, adducts of fragments with cations, matrix effects, and preferred usage order of the photolinkers. To our knowledge, up until now, no software tool is available to make this challenge amenable to the user. We have developed a Java™-based program called CalcDalton. The aim of CalcDalton is to identify optimized linker positions in a set of primers and to assign these to appropriate multiplexes.The program is entirely written in Java 1.4 and available via Java WebStart at www.uni-leipzig.de/∼ahnert/calcdalton.htm. It is distributed under the GNU public license. Minimum requirements are an installed Java Runtime Environment of at least version 1.4 (www.java.com). The program was tested under Linux, Microsoft® Windows 98,2000, and XP. The design applies the JGoodies Looks package (www.jgoodies.com/freeware/looks), and the graphical output is generated using the JFreeChart package (www.jfree.org/jfreechart/index.php). A help document with detailed explanations of all functions and sample data and settings can be found at www.uni-leipzig de/∼ahnert/calcdalton.htm and also as supplementary material.The program has an easily and intuitively usable graphical interface (Figure 1A). The user can specify the applied cleavable linker, maximum and minimum mass ranges of the MALDI-TOF MS device, and excluded mass ranges (e.g., important for mass ranges where matrix signals are expected to occur). The resolution of the instrument is taken into account by the specification of a minimal peak distance. To avoid interference with cationiic adducts, excluded distance between peaks can be defined. The available mass range can be used more efficiently by allowing the MALDI-TOF MS signals of the primers, but not of the genotyping products, to be within excluded peak distances. A favored usage order of linker positions, as well as predefined fixed linker positions, can be specified. Preconfigured settings make the choice between three previously published types of assays (2–4) with different cleavable primers more convenient. Figure 1B shows the overlay of a mass spectrometry trace from the measurement of an 11-plex with the predictions for the same 11-plex. Since absolute masses are used in the prediction, the calculated results are accurately reflecting the measurements to within the accuracy limits of the mass spectrometer. Concrete peak heights and individual genotypes are not predicted by CalcDalton.Figure 1. Screenshot of CalcDalton software and comparison with real data.(A) Input and output screens for the determination of positions for cleavable linkers in genotyping primers are shown. Primer sequence information is loaded or typed into the input mask. Expected genotypes and fixed linker positions may be specified. Pressing the Calculate button generates the Result window showing one of several possible solutions with all expected and possible products. To get an intuitive grasp of the results, a table of all mass differences (Diffs for result 1) and a graphical representation of the expected mass spectrum (MALDI Preview) can be generated. Short peaks (below 1000 rel. units) in the graph indicate the positions of cation adducts. (B) A comparison of the graphical representation of the calculated masses with a real mass spectrum is shown. The mass spectrum resulted from the genotyping of 11 homo- or heterozygous loci using primers with photocleavable linkers. For details of the 11-plex, please refer to www.uni-leipzig.de/∼ahnert/cdhelp.pdf. rel units, relative units.CalcDalton is designed to first attempt to find an optimal linker position assignment in which all primers can be included in one multiplex. This is done by testing all possible linker assignments via brute force. Internally, CalcDalton is performing a depth-first traversal of the solution tree (6). Branches of the solution tree are pruned if these subtrees represent worse solutions than those already identified. In comparison to a standard brute force algorithm without pruning, this strategy decreases calculation time. Multiple optimized solutions are presented to the user. They are equal in respect to the favored photolinker order. To allow inspection of the suitability of the solutions, all mass differences occurring in a solution are displayed in a table, and a preview of the corresponding MALDI-TOF mass spectrum is generated.Given certain settings, it is sometimes not possible to include all primers in a single multiplex. CalcDalton will then seek a solution where all primers can be included in a minimal number of multiplexes. The underlying problem in achieving this goal is equivalent to partitioning a graph into a minimal number of disjoint cliques (7). In the graph, vertices represent possible primers, and connecting edges represent incompatibilities between them. Partitioning such a graph is a so-called NP-complete problem; no known algorithms provide exact solutions in a justifiable time scale for more complex problem instances (8). To deal with this problem, we apply exact algorithms with restricted central processing unit (CPU) calculation times, leading to approximate solutions. The user can choose between two algorithms to place all primers in a minimal number of multiplexes. In the first approach, the reverse of the entire graph is generated, and a maximum clique algorithm (9) separates this reverse graph. In the second approach, a standard naive force graph coloring algorithm (7), acting on the original graph, is applied. Which algorithm gives the best results depends on the number and properties of the primers and the user defined settings. Best results may be obtained by choosing the algorithm empirically.The performance of CalcDalton may be judged from the task of assigning the primers for 60 randomly chosen SNPs to a minimum number of multiplexes. Under Microsoft Windows 2000, running on a machine with an AMD Sempron 2400+ processor and 512MB RAM, default settings, and the maximum clique algorithm, approximately 10 min are needed to find the solution for assigning the 60 primers into four multiplexes (7–22 primers per multiplex). If the calculation time was limited to 5 min, a solution with five multiplexes (1–22 primers each) was found. Dividing the same 60 primers into two sets of 30, it takes about 1 min to assign each set into two multiplexes (11 and 19 primers each). When the graph-coloring algorithm was applied to the same task as above and under the same conditions, only solutions with larger numbers of multiplexes were obtained. However, for different sets of primers and settings, the graph-coloring algorithm may give better results. In principle, the number of primers and the size of multiplexes are not limited. The quality of the results depends on the settings required by the user, the performance of the computer, the properties of the primers, and the preset calculation time.In our hands, CalcDalton saves substantial amounts of time in designing linker positions, allows higher multiplexing, and facilitates the inclusion of existing primers in new multiplexes.AcknowledgmentsWe thank Anke Steiner and Grit Wolfram for the CalcDalton-based design and preparation of the 11-plex and Drs. Markus Kostrzewa and Kristina Fahr from Bruker Daltonics for very helpful advice on general design issues of cleavable primers. This project was supported by grant no. 7692/1187 from the Saechsische Aufbaubank-Förderbank, by grant no. 4212/04-04 from the European Fund for Regional Development (EFRE), and by the Hochschul- und Wissenschaftsprogramm of the German Federal Ministry for Education and Research.Competing Interests StatementThe authors declare no competing interests.Supplementary dataTo view the supplementary data that accompany this paper please visit the journal website at: www.future-science.com/doi/suppl/10.2144/000112115References1. Tost, J. and I.G. Gut. 2005. Genotyping single nucleotide polymorphisms by MALDI mass spectrometry in clinical applications. Clin. Biochem. 38:335–350.Crossref, Medline, CAS, Google Scholar2. Wenzel, T., T. Elssner, K. Fahr, J. Bimmler, S. Richter, I. Thomas, and M. Kostrzewa. 2003. Genosnip: SNP genotyping by MALDI-TOF MS using photocleavable oligonucleotides. Nucleosides Nucleotides Nucleic Acids 22:1579–1581.Crossref, Medline, CAS, Google Scholar3. Shchepinov, M.S., M.F. Denissenko, K.J. Smylie, R.J. Worl, A.L. Leppin, C.R. Cantor, and C.P. Rodi. 2001. Matrix-induced fragmentation of P3′–N5′ phos-phoramidate-containing DNA: high-throughput MALDI-TOF analysis of genomic sequence polymorphisms. Nucleic Acids Res. 29:3864–3872.Crossref, Medline, CAS, Google Scholar4. Li, J., J.M. Butler, Y. Tan, H. Lin, S. Royer, L. Ohler, T.A. Shaler, J. Hunter, et al.. 1999. Single nucleotide polymorphism determination using primer extension and time-of-flight mass spectrometry. Electrophoresis 20:1258–1265.Crossref, Medline, CAS, Google Scholar5. Pusch, W., J.H. Wurmbach, H. Thiele, and M. Kostrzewa. 2002. MALDI-TOF mass spectrometry-based SNP genotyping. Pharmacogenomics 3:537–548.Crossref, Medline, CAS, Google Scholar6. Cooper, S.B. 2004. Computability Theory. Chapman & Hall/CRC Press, Boca Raton.Google Scholar7. West, D.B. 2001. Introduction to Graph Theory, 2nd ed. Prentice Hall, Upper Saddle River, NJ.Google Scholar8. Garey, M.R. and D.S. Johnson. 1979. Computers and Intractability: A Guide to the Theory of NP-Completeness. W.H. Freeman, San Francisco.Google Scholar9. Coudert, O. 1997. Exact coloring of real-life graphs is easy. Proceedings of the 34th Annual Conference on Design Automation. June 1997 121–126.Crossref, Google ScholarFiguresReferencesRelatedDetailsCited ByIdentification of New, Functionally Relevant Mutations in the Coding Regions of the Human Fos and Jun Proto-Oncogenes in Rheumatoid Arthritis Synovial Tissue23 December 2020 | Life, Vol. 11, No. 1Association of Human FOS Promoter Variants with the Occurrence of Knee-Osteoarthritis in a Case Control Association Study19 March 2019 | International Journal of Molecular Sciences, Vol. 20, No. 6Association, characterisation and meta-analysis of SNPs linked to general reading ability in a German dyslexia case-control cohort17 June 2016 | Scientific Reports, Vol. 6, No. 1Cellular Adhesion Gene SELP Is Associated with Rheumatoid Arthritis and Displays Differential Allelic Expression22 August 2014 | PLoS ONE, Vol. 9, No. 8Single nucleotide polymorphisms of the purinergic 1 receptor are not associated with myocardial infarction in a Latvian population4 June 2011 | Molecular Biology Reports, Vol. 39, No. 2Imaging genetics of FOXP2 in dyslexia7 September 2011 | European Journal of Human Genetics, Vol. 20, No. 2Association of the X-Chromosomal Genes TIMP1 and IL9R with Rheumatoid Arthritis1 September 2009 | The Journal of Rheumatology, Vol. 36, No. 10The role of gene DCDC2 in German dyslexics24 February 2009 | Annals of Dyslexia, Vol. 59, No. 1 Vol. 40, No. 2 STAY CONNECTED Supplemental MaterialsMetrics History Received 21 September 2005 Accepted 5 December 2005 Published online 21 May 2018 Published in print February 2006 Information© 2006 Author(s)AcknowledgmentsWe thank Anke Steiner and Grit Wolfram for the CalcDalton-based design and preparation of the 11-plex and Drs. Markus Kostrzewa and Kristina Fahr from Bruker Daltonics for very helpful advice on general design issues of cleavable primers. This project was supported by grant no. 7692/1187 from the Saechsische Aufbaubank-Förderbank, by grant no. 4212/04-04 from the European Fund for Regional Development (EFRE), and by the Hochschul- und Wissenschaftsprogramm of the German Federal Ministry for Education and Research.Competing Interests StatementThe authors declare no competing interests.Supplementary dataTo view the supplementary data that accompany this paper please visit the journal website at: www.future-science.com/doi/suppl/10.2144/000112115PDF download
 Thorsten Berger合作论文数IT University of Copenhagen8
 Bram Adams合作论文数MCIS, École Polytechnique de Montréal6
 Ahmed E. Hassan合作论文数Software Analysis and Intelligence Lab, School of Computing, Queen's University6
 Meiyappan Nagappan合作论文数David R. Cheriton School of Computer Science University of Waterloo6
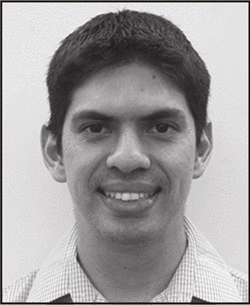 Israel J. Mojica Ruiz合作论文数5
 Stefan Kühne合作论文数Newsgroups: gmane.comp.video.mms3
 Johannes Schmidt合作论文数2
 Volker Berkhout合作论文数1Soren Reichardt合作论文数1Moritz Wilke合作论文数1Marc-Alexander Lutz合作论文数1Stephan Vogt合作论文数1
 Matthias Kricke合作论文数Institute for Informatics, University of Leipzig1
 Fabian Scheller合作论文数Faculty of Business and Engineering, University of Applied Sciences Würzburg-Schweinfurt1Sahami, S.合作论文数1Simon Johanning合作论文数1
 David Georg Reichelt合作论文数Universität Leipzig1
 M. Ali Rostami合作论文数1Andrzej Wasowski合作论文数Programming, Logic & Semantics Group (PLS);Software Development Group (SDG)1
 Stefan Faulstich合作论文数Fraunhofer Institute of Wind Energy and Energy System Technology1
 Holger Kirsten合作论文数Fraunhofer Institute for Cell Therapy and Immunology1
 Krzysztof Czarnecki合作论文数Department of Electrical and Computer Engineering, University of Waterloo;School of Computer Science, University of Waterloo;Generative Software Lab, University of Waterloo1
 Reinhard Tartler合作论文数Friedrich-Alexander University Erlangen-Nuremberg1
 Steven She合作论文数University of Waterloo1Eric Peukert合作论文数1
 Peter Ahnert合作论文数Institute for Medical Informatics, Statistics and Epidemiology, University of Leipzig1
 Thomas Brckner合作论文数1
 Rolf-Helge Pfeiffer合作论文数IT University of Copenhagen1
 Frank Emmrich合作论文数Fraunhofer Institute for Cell Therapy and Immunology1
 Erhard Rahm合作论文数Institut für Informatik, Fakultät für Mathematik und Informatik, Universität Leipzig1




