We present a new all-sky model of low-frequency diffuse Galactic emission in the regime where synchrotron, free-free, and spinning dust dominate. The model extends the Planck 2015 diffuse component-separation analysis by incorporating recent radio and microwave surveys. We fit 35 full- and partial-sky maps at 1 degree resolution, including S-PASS at 2.30 GHz, C-BASS at 4.76 GHz, and QUIJOTE at 10-20 GHz, together with reprocessed WMAP and Planck LFI data from the Cosmoglobe collaboration and Planck HFI channels. Using a Bayesian parametric approach with Commander, we derive spatially varying amplitude and spectral parameter maps for the dominant low-frequency foreground components in total intensity. The main products are a full-sky synchrotron amplitude and spectral-index solution, an all-sky characterization of spinning dust emission with a single-component log-normal spectral model, and a reconstructed all-sky total-intensity map at 4.76 GHz tracing diffuse synchrotron emission with reduced systematics relative to Haslam 408 MHz. The revised low-frequency anchoring increases the recovered synchrotron amplitude: at 4.76 GHz, it is approximately a factor of two higher than the Planck 2015 prediction. The model achieves RMS temperature residuals below 10 K over 95
Anomalous microwave emission (AME) represents an excess of radiation in the 10-60 GHz range, distinct from synchrotron, free-free, or thermal dust emission. Although most commonly attributed to electric dipole radiation from rapidly rotating small dust grains (spinning dust), alternative mechanisms such as magnetic dipole emission (MDE) remain plausible. The detection of AME across diverse environments, from diffuse interstellar clouds to protoplanetary disks and external galaxies, suggests that multiple physical processes or carriers may contribute to its origin. Understanding AME is essential for both Galactic astrophysics and cosmology, as it constitutes a significant foreground for cosmic microwave background (CMB) studies, potentially biasing measurements. This chapter reviews current theoretical frameworks and observational evidence for AME, highlighting the key outstanding questions concerning its emission mechanisms, carriers, and polarization properties. We discuss how the Square Kilometre Array Observatory (SKAO), through its unprecedented sensitivity, angular resolution, and frequency coverage, will transform AME studies. SKA observations will enable detailed mapping of AME morphology, precise characterisation of its spectral energy distribution, and the identification of its carriers in Galactic and extragalactic environments. By combining SKA-mid data with higher-frequency observations from ALMA and other facilities such as SPHEREx, it will be possible to disentangle competing models and exploit AME as a diagnostic probe of interstellar grain physics and the small-scale structure of the interstellar medium.
Anomalous microwave emission (AME) is 30 GHz-peaking continuum emission thought to arise from spinning dust grains. Observations suggest that the local environment shapes the AME spectral energy distribution (SED), so building a spatially resolved sample of AME regions is a key step towards understanding its emission mechanism. Using the Green Bank Telescope Ku-band receiver, we obtained a 1 arcmin resolution map of radius 1.25 deg centered on G107.2+5.20. Our first objective was to constrain the low-frequency side of the AME SED with 13 GHz data. Using matched-resolution aperture photometry, we measure the SED from 408 MHz-3 THz and fit two emission models: one including spinning dust, the other optically thick free-free emission. We find that the spinning dust model is superior, with an amplitude of 14.1±1.1 Jy and a peak frequency of 27±2 GHz. Our second objective was to spatially locate excess 13 GHz emission consistent with spinning dust. We compare our Ku-band map to multi-wavelength gas and dust tracers at 4 arcmin resolution. We observe two sources of 13 GHz excess at 3σ significance consistent with spinning dust emission, though potential contributions from optically thick free-free emission remain ambiguous. “Region A” (G106.95+5.19) is spatially coincident with peak dust radiance. “Region B” (G107.08+4.90) is spatially coincident with peak PAH abundance. If regions A and B are indeed sources of spinning dust emission, they are a resolved example of how AME-dust correlation varies with environment.
Anomalous Microwave Emission (AME) is a major component of Galactic emission in the frequency band 10 to 60 GHz and is commonly modelled as rapidly rotating spinning dust grains. The photodissociation region (PDR) at the boundary of the $\lambda$-Orionis Hii region has been identified by several recent analyses as one of the brightest spinning dust emitting sources in the sky. We investigate the Barnard 30 dark cloud, a dark cloud embedded within the $\lambda$-Orionis PDR. We use total-power observations of Barnard 30 from the CO Mapping Array Project (COMAP) pathfinder instrument at 26 to 34GHz with a resolution of 4.5 arcminutes alongside existing data from Planck, WISE, IRAS, ACT, and the 1.447GHz GALFACTS survey. We use aperture photometry and template fitting to measure the spectral energy distribution of Barnard 30. We find that the spinning dust is the dominant emission component in the 26 to 34GHz range at the $7 \sigma$ level ($S_{30GHz} = 2.85\pm0.43$Jy). We find no evidence that polycyclic aromatic hydrocarbons are the preferred carrier for the spinning dust emission, suggesting that the spinning dust carriers are due to a mixed population of very small grains. Finally, we find evidence for variations in spinning dust emissivity and peak frequency within Barnard 30, and that these variations are possibly driven by changes in dust grain population and the total radiation field. Confirming the origin of the variations in the spinning dust spectrum will require both future COMAP observations at 15GHz combined with spectroscopic mid-infrared data of Barnard 30.
Radio Frequency Interference (RFI) is emitted from various sources, terrestrial or orbital, and create a nuisance for ground-based 21cm experiments. In particular, single-dish 21cm intensity mapping experiments will be highly susceptible to contamination from these sources due to its wide primary beam and sensitivity. This work aims to simulate the contamination effects emitted from orbital sources in the Radio Navigational Satellite System within the 1100-1350 MHz frequency. This simulation can be split into two parts: (I) satellite positioning, emission power, and beam response on the telescope and (II) fitting of the satellite signal to data in order to improve the original model. We use previously observed single dish MeerKAT L-band data which needs to be specially calibrated to include data contaminated by satellite-based RFI. We find that due to non-linearity effects, it becomes non-trivial to fit the satellite power. However, when masking regions where this non-linearity is problematic, we can recreate the satellite contamination with high accuracy around its peak frequencies. The simulation can predict satellite movements and signal for past and future observations, which can help in RFI avoidance and testing novel cleaning methods. The predicted signal from simulations sits below the noise in the target cosmology window for the L-band (970 - 1015 MHz) making it difficult to confirm any out-of-band emission from satellites. However, a power spectrum analysis shows that such signal can still contaminate the 21cm power spectrum at these frequencies. In our simulations, this contamination overwhelms the auto-power spectrum but still allows for a clean detection of the signal in cross-correlations with mild foreground cleaning. Whether such contamination does exist one will require further characterization of the satellite signals far away from their peak frequencies.
The Carbon monOxide Mapping Array Project (COMAP) Pathfinder survey continues to demonstrate the feasibility of line-intensity mapping using high-redshift carbon monoxide (CO) line emission traced at cosmological scales. The latest COMAP Pathfinder power spectrum analysis is based on observations through the end of Season 2, covering the first three years of Pathfinder operations. We use our latest constraints on the CO(1-0) line-intensity power spectrum at $z\sim3$ to update corresponding constraints on the cosmological clustering of CO line emission and thus the cosmic molecular gas content at a key epoch of galaxy assembly. We first mirror the COMAP Early Science interpretation, considering how Season 2 results translate to limits on the shot noise power of CO fluctuations and the bias of CO emission as a tracer of the underlying dark matter distribution. The COMAP Season 2 results place the most stringent limits on the CO tracer bias to date, at $\langle{Tb}\rangle<4.8$ $\mu$K. These limits narrow the model space significantly compared to previous CO line-intensity mapping results while maintaining consistency with small-volume interferometric surveys of resolved line candidates. The results also express a weak preference for CO emission models used to guide fiducial forecasts from COMAP Early Science, including our data-driven priors. We also consider directly constraining a model of the halo-CO connection, and show qualitative hints of capturing the total contribution of faint CO emitters through the improved sensitivity of COMAP data. With continued observations and matching improvements in analysis, the COMAP Pathfinder remains on track for a detection of cosmological clustering of CO emission.
LiteBIRD, the next-generation cosmic microwave background (CMB) experiment, aims for a launch in Japan's fiscal year 2032, marking a major advancement in the exploration of primordial cosmology and fundamental physics. Orbiting the Sun-Earth Lagrangian point L2, this JAXA-led strategic L-class mission will conduct a comprehensive mapping of the CMB polarization across the entire sky. During its 3-year mission, LiteBIRD will employ three telescopes within 15 unique frequency bands (ranging from 34 through 448 GHz), targeting a sensitivity of 2.2 mu K-arcmin and a resolution of 0.5 degrees at 100 GHz. Its primary goal is to measure the tensor-to-scalar ratio r with an uncertainty delta r = 0.001, including systematic errors and margin. If r >= 0.01, LiteBIRD expects to achieve a > 5 sigma detection in the l = 2-10 and l = 11-200 ranges separately, providing crucial insight into the early Universe. We describe LiteBIRD's scientific objectives, the application of systems engineering to mission requirements, the anticipated scientific impact, and the operations and scanning strategies vital to minimizing systematic effects. We will also highlight LiteBIRD's synergies with concurrent CMB projects.
The Carbon monOxide Mapping Array Project (COMAP) Pathfinder survey continues to demonstrate the feasibility of line-intensity mapping using high-redshift carbon monoxide (CO) line emission traced at cosmological scales. The latest COMAP Pathfinder power spectrum analysis is based on observations through the end of Season 2, covering the first three years of Pathfinder operations. We use our latest constraints on the CO(1-0) line-intensity power spectrum at z similar to 3 to update corresponding constraints on the cosmological clustering of CO line emission and thus the cosmic molecular gas content at a key epoch of galaxy assembly. We first mirror the COMAP Early Science interpretation, considering how Season 2 results translate to limits on the shot noise power of CO fluctuations and the bias of CO emission as a tracer of the underlying dark matter distribution. The COMAP Season 2 results place the most stringent limits on the CO tracer bias to date, at < T b > < 4.8 mu K, which translates to a molecular gas density upper limit of rho(H2) < 1.6 x 10(8) M-circle dot Mpc(-3) at z similar to 3 given additional model assumptions. These limits narrow the model space significantly compared to previous CO line-intensity mapping results while maintaining consistency with small-volume interferometric surveys of resolved line candidates. The results also express a weak preference for CO emission models used to guide fiducial forecasts from COMAP Early Science, including our data-driven priors. We also consider directly constraining a model of the halo-CO connection, and show qualitative hints of capturing the total contribution of faint CO emitters through the improved sensitivity of COMAP data. With continued observations and matching improvements in analysis, the COMAP Pathfinder remains on track for a detection of cosmological clustering of CO emission.
The CO Mapping Array Project (COMAP) Pathfinder is performing line intensity mapping of CO emission to trace the distribution of unresolved galaxies at redshift z similar to 3. We present an improved version of the COMAP data processing pipeline and apply it to the first two Seasons of observations. This analysis improves on the COMAP Early Science (ES) results in several key aspects. On the observational side, all second season scans were made in constant-elevation mode, after noting that the previous Lissajous scans were associated with increased systematic errors; those scans accounted for 50% of the total Season 1 data volume. In addition, all new observations were restricted to an elevation range of 35-65 degrees to minimize sidelobe ground pickup. On the data processing side, more effective data cleaning in both the time and map domain allowed us to eliminate all data-driven power spectrum-based cuts. This increases the overall data retention and reduces the risk of signal subtraction bias. However, due to the increased sensitivity, two new pointing-correlated systematic errors have emerged, and we introduced a new map-domain PCA filter to suppress these errors. Subtracting only five out of 256 PCA modes, we find that the standard deviation of the cleaned maps decreases by 67% on large angular scales, and after applying this filter, the maps appear consistent with instrumental noise. Combining all of these improvements, we find that each hour of raw Season 2 observations yields on average 3.2 times more cleaned data compared to the ES analysis. Combining this with the increase in raw observational hours, the effective amount of data available for high-level analysis is a factor of eight higher than in the ES analysis. The resulting maps have reached an uncertainty of 25-50 mu K per voxel, providing by far the strongest constraints on cosmological CO line emission published to date.
We present updated constraints on the cosmological 3D power spectrum of carbon monoxide CO(1-0) emission in the redshift range 2.4-3.4. The constraints are derived from the two first seasons of Carbon monOxide Mapping Array Project (COMAP) Pathfinder line intensity mapping observations aiming to trace star formation during the epoch of galaxy assembly. These results improve on the previous Early Science results through both increased data volume and an improved data processing methodology. On the methodological side, we now perform cross-correlations between groups of detectors ("feed groups"), as opposed to cross-correlations between single feeds, and this new feed group pseudo power spectrum (FGPXS) is constructed to be more robust against systematic effects. In terms of data volume, the effective mapping speed is significantly increased due to an improved observational strategy as well as a better data selection methodology. The updated spherically and field-averaged FGPXS, C(k), is consistent with zero, at a probability-to-exceed of around 34%, with an excess of 2.7 sigma in the most sensitive bin. Our power spectrum estimate is about an order of magnitude more sensitive in our six deepest bins across 0.09 Mpc(-1) < k < 0.73 Mpc(-1), compared to the feed-feed pseudo power spectrum (FPXS) of COMAP ES. Each of these bins individually constrains the CO power spectrum to k PCO(k) < 2400-4900 mu K(2)Mpc(2) at 95% confidence. To monitor potential contamination from residual systematic effects, we analyzed a set of 312 difference-map null tests and found that these are consistent with the instrumental noise prediction. In sum, these results provide the strongest direct constraints on the cosmological 3D CO(1-0) power spectrum published to date.
ABSTRACT The Andromeda galaxy (M 31) is our closest neighbouring spiral galaxy, making it an ideal target for studying the physics of the interstellar medium in a galaxy very similar to our own. Using new observations of M 31 at 4.76 GHz by the C-Band All-Sky Survey (C-BASS), and all available radio data at 1° resolution, we produce the integrated spectrum and put new constraints on the synchrotron spectral index and anomalous microwave emission (AME) from M 31. We use aperture photometry and spectral modelling to fit for the integrated spectrum of M 31, and subtract a comprehensive model of nearby background radio sources. The AME in M 31 is detected at 3σ significance with a peak near 30 GHz and flux density 0.27 ± 0.09 Jy. The synchrotron spectral index of M 31 is flatter than our own Galaxy at α =−0.66 ± 0.03 with no strong evidence of spectral curvature. The emissivity of AME averaged over the total emission from M 31 is lower than typical AME sources in our Galaxy, implying that AME is not uniformly distributed throughout M 31 and instead is likely confined to sub-regions – this will need to be confirmed using future higher resolution observations around 20–30 GHz.
We summarize the second radio synchrotron background workshop, which took place on 2022 June 15–17 in Barolo, Italy. This meeting was convened because available measurements of the diffuse radio zero level continue to suggest that it is several times higher than can be attributed to known Galactic and extragalactic sources and processes, rendering it the least well-understood electromagnetic background at present and a major outstanding question in astrophysics. The workshop agreed on the next priorities for investigations of this phenomenon, which include searching for evidence of the radio Sunyaev–Zel’dovich effect, carrying out cross-correlation analyses of radio emission with other tracers, and supporting the completion of the 310 MHz absolutely calibrated sky map project.
Anomalous microwave emission (AME) is an important emission component between 10 and 60 GHz that is not yet fully understood. It seems to be ubiquitous in our Galaxy and is observed at a broad range of angular scales. Here we use the new QUIJOTE-MFI wide survey data at 11, 13, 17, and 19 GHz to constrain the AME in the Galactic plane (|b| < 10(degrees)) on degree scales. We built the spectral energy distribution between 0.408 and 3000 GHz for each of the 5309 0.9(degrees) pixels in the Galactic plane, and fitted a parametric model by considering five emission components: synchrotron, free-free, AME, thermal dust and CMB anisotropies. We show that not including QUIJOTE-MFI data points leads to the underestimation (up to 50 per cent) of the AME signal in favour of free-free emission. The parameters describing these components are then intercompared, looking for relations that help to understand AME physical processes. We find median values for the AME width, W-AME, and for its peak frequency, nu(AME), respectively of 0.560(-0.050)(+0.059) and 20.7(-1.9)(+2.0) GHz, slightly in tension with current theoretical models. We find spatial variations throughout the Galactic plane for nu AME, but only with reduced statistical significance. We report correlations of AME parameters with certain ISM properties, such as that between the AME emissivity (which shows variations with the Galactic longitude) and the interstellar radiation field, and that between the AME peak frequency and dust temperature. Finally, we discuss the implications of our results on the possible molecules responsible for AME.
ABSTRACT We present QUIJOTE intensity and polarization maps in four frequency bands centred around 11, 13, 17, and 19 GHz, and covering approximately 29 000 deg2, including most of the northern sky region. These maps result from 9000 h of observations taken between May 2013 and June 2018 with the first QUIJOTE multifrequency instrument (MFI), and have angular resolutions of around 1°, and sensitivities in polarization within the range 35–40 µK per 1° beam, being a factor ∼2–4 worse in intensity. We discuss the data processing pipeline employed, and the basic characteristics of the maps in terms of real space statistics and angular power spectra. A number of validation tests have been applied to characterize the accuracy of the calibration and the residual level of systematic effects, finding a conservative overall calibration uncertainty of 5 per cent. We also discuss flux densities for four bright celestial sources (Tau A, Cas A, Cyg A, and 3C274), which are often used as calibrators at microwave frequencies. The polarization signal in our maps is dominated by synchrotron emission. The distribution of spectral index values between the 11 GHz and WMAP 23 GHz map peaks at β = −3.09 with a standard deviation of 0.14. The measured BB/EE ratio at scales of ℓ = 80 is 0.26 ± 0.07 for a Galactic cut |b| > 10°. We find a positive TE correlation for 11 GHz at large angular scales (ℓ ≲ 50), while the EB and TB signals are consistent with zero in the multipole range 30 ≲ ℓ ≲ 150. The maps discussed in this paper are publicly available.
Neutral Hydrogen Intensity Mapping (HI IM) surveys will be a powerful new probe of cosmology. However, strong astrophysical foregrounds contaminate the signal and their coupling with instrumental systematics further increases the data cleaning complexity. In this work, we simulate a realistic single-dish HI IM survey of a 5000 deg^2 patch in the 950 - 1400 MHz range, with both the MID telescope of the SKA Observatory (SKAO) and MeerKAT, its precursor. We include a state-of-the-art HI simulations and explore different foreground models and instrumental effects such as non-homogeneous thermal noise and beam side-lobes. We perform the first Blind Foreground Subtraction Challenge for HI IM on these synthetic data-cubes, aiming to characterise the performance of available foreground cleaning methods with no prior knowledge of the sky components and noise level. Nine foreground cleaning pipelines joined the Challenge, based on statistical source separation algorithms, blind polynomial fitting, and an astrophysical-informed parametric fit to foregrounds. We devise metrics to compare the pipeline performances quantitatively. In general, they can recover the input maps' 2-point statistics within 20 per cent in the range of scales least affected by the telescope beam. However, spurious artefacts appear in the cleaned maps due to interactions between the foreground structure and the beam side-lobes. We conclude that it is fundamental to develop accurate beam deconvolution algorithms and test data post-processing steps carefully before cleaning. This study was performed as part of SKAO preparatory work by the HI IM Focus Group of the SKA Cosmology Science Working Group.
We present early results from the CO Mapping Array Project (COMAP) Galactic Plane Survey conducted between 2019 June and 2021 April, spanning 20 degrees < l < 40 degrees in Galactic longitude and divide b divide < 1.degrees 5 in Galactic latitude with an angular resolution of 4.' 5. We present initial results from the first part of the survey, including the diffuse emission and spectral energy distributions of H ii regions and supernova remnants (SNRs). Using low- and high-frequency surveys to constrain free-free and thermal dust emission contributions, we find evidence of excess flux density at 30 GHz in six regions, which we interpret as anomalous microwave emission. Furthermore we model ultracompact H ii contributions using data from the 5 GHz CORNISH catalog and reject these as the cause of the 30 GHz excess. Six known SNRs are detected at 30 GHz, and we measure spectral indices consistent with the literature or show evidence of steepening. The flux density of the SNR W44 at 30 GHz is consistent with a power-law extrapolation from lower frequencies with no indication of spectral steepening in contrast with recent results from the Sardinia Radio Telescope. We also extract five hydrogen radio recombination lines (RRLs) to map the warm ionized gas, which can be used to estimate electron temperatures or to constrain continuum free-free emission. The full COMAP Galactic Plane Survey, to be released in 2023/2024, will span l similar to 20 degrees-220 degrees and will be the first large-scale radio continuum and RRL survey at 30 GHz with 4.' 5 resolution.
We present the current state of models for the $z\sim3$ carbon monoxide (CO) line-intensity signal targeted by the CO Mapping Array Project (COMAP) Pathfinder in the context of its early science results. Our fiducial model, relating dark matter halo properties to CO luminosities, informs parameter priors with empirical models of the galaxy-halo connection and previous CO(1-0) observations. The Pathfinder early science data spanning wavenumbers $k=0.051$-$0.62\,$Mpc$^{-1}$ represent the first direct 3D constraint on the clustering component of the CO(1-0) power spectrum. Our 95% upper limit on the redshift-space clustering amplitude $A_{\rm clust}\lesssim70\,\mu$K$^2$ greatly improves on the indirect upper limit of $420\,\mu$K$^2$ reported from the CO Power Spectrum Survey (COPSS) measurement at $k\sim1\,$Mpc$^{-1}$. The COMAP limit excludes a subset of models from previous literature, and constrains interpretation of the COPSS results, demonstrating the complementary nature of COMAP and interferometric CO surveys. Using line bias expectations from our priors, we also constrain the squared mean line intensity-bias product, $\langle{Tb}\rangle^2\lesssim50\,\mu$K$^2$, and the cosmic molecular gas density, $\rho_\text{H2}<2.5\times10^8\,M_\odot\,$Mpc$^{-3}$ (95% upper limits). Based on early instrument performance and our current CO signal estimates, we forecast that the five-year Pathfinder campaign will detect the CO power spectrum with overall signal-to-noise of 9-17. Between then and now, we also expect to detect the CO-galaxy cross-spectrum using overlapping galaxy survey data, enabling enhanced inferences of cosmic star-formation and galaxy-evolution history.
We describe the first season COMAP analysis pipeline that converts raw detector readouts to calibrated sky maps. This pipeline implements four main steps: gain calibration, filtering, data selection, and map-making. Absolute gain calibration relies on a combination of instrumental and astrophysical sources, while relative gain calibration exploits real-time total-power variations. High efficiency filtering is achieved through spectroscopic common-mode rejection within and across receivers, resulting in nearly uncorrelated white noise within single-frequency channels. Consequently, near-optimal but biased maps are produced by binning the filtered time stream into pixelized maps; the corresponding signal bias transfer function is estimated through simulations. Data selection is performed automatically through a series of goodness-of-fit statistics, including χ and multi-scale correlation tests. Applying this pipeline to the first-season COMAP data, we produce a dataset with very low levels of correlated noise. We find that one of our two scanning strategies (the Lissajous type) is sensitive to residual instrumental systematics. As a result, we no longer use this type of scan and exclude data taken this way from our Season 1 power spectrum estimates. We perform a careful analysis of our data processing and observing efficiencies and take account of planned improvements to estimate our future performance. Power spectrum results derived from the first-season COMAP maps are presented and discussed in companion papers.
The measurement of diffuse 21-cm radiation from the hyperfine transition of neutral hydrogen (HI signal) in different redshifts is an important tool for modern cosmology. However, detecting this faint signal with non-cryogenic receivers in single-dish telescopes is a challenging task. The BINGO (Baryon Acoustic Oscillations from Integrated Neutral Gas Observations) radio telescope is an instrument designed to detect baryonic acoustic oscillations (BAOs) in the cosmological HI signal, in the redshift interval $0.127 \le z \le 0.449$. This paper describes the BINGO radio telescope, including the current status of the optics, receiver, observational strategy, calibration, and the site. BINGO has been carefully designed to minimize systematics, being a transit instrument with no moving dishes and 28 horns operating in the frequency range $980 \le \nu \le 1260$ MHz. Comprehensive laboratory tests were conducted for many of the BINGO subsystems and the prototypes of the receiver chain, horn, polarizer, magic tees, and transitions have been successfully tested between 2018 - 2020. The survey was designed to cover $\sim 13\%$ of the sky, with the primary mirror pointing at declination $\delta=-15^{\circ}$. The telescope will see an instantaneous declination strip of $14.75^{\circ}$. The results of the prototype tests closely meet those obtained during the modeling process, suggesting BINGO will perform according to our expectations. After one year of observations with a $60\%$ duty cycle and 28 horns, BINGO should achieve an expected sensitivity of 102 $\mu K$ per 9.33 MHz frequency channel, one polarization, and be able to measure the HI power spectrum in a competitive time frame.
The C-Band All-Sky Survey (C-BASS) has observed the Galaxy at 4.76 GHz with an angular resolution of 0${_{.}^{\circ}}$73 full-width half-maximum, and detected Galactic synchrotron emission with high signal-to-noise ratio over the entire northern sky (δ > −15○). We present the results of a spatial correlation analysis of Galactic foregrounds at mid-to-high (b > 10○) Galactic latitudes using a preliminary version of the C-BASS intensity map. We jointly fit for synchrotron, dust, and free–free components between 20 and 1000 GHz and look for differences in the Galactic synchrotron spectrum, and the emissivity of anomalous microwave emission (AME) when using either the C-BASS map or the 408 MHz all-sky map to trace synchrotron emission. We find marginal evidence for a steepening (<Δβ > = − 0.06 ± 0.02) of the Galactic synchrotron spectrum at high frequencies resulting in a mean spectral index of <β > = − 3.10 ± 0.02 over 4.76–22.8 GHz. Further, we find that the synchrotron emission can be well modelled by a single power-law up to a few tens of GHz. Due to this, we find that the AME emissivity is not sensitive to changing the synchrotron tracer from the 408 MHz map to the 4.76 GHz map. We interpret this as strong evidence for the origin of AME being spinning dust emission.
 Clive Dickinson合作论文数Jodrell Bank Centre for Astrophysics, The University of Manchester;School of Physics and Astronomy, University of Manchester42
 Timothy J. Pearson合作论文数Department of Astronomy, California Institute of Technology20
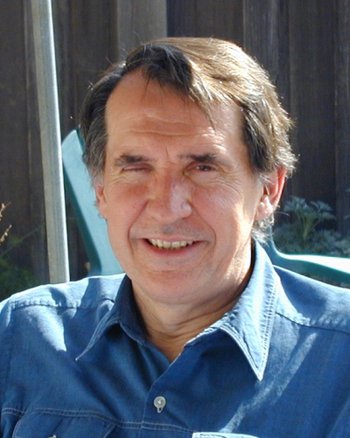 Anthony Readhead合作论文数Division of Physics, Mathematics and Astronomy, California Institute of Technology18
 Hans Kristian Eriksen合作论文数Institute of Theoretical Astrophysics, The Faculty of Mathematics and Natural Sciences, University of Oslo16
 Ingunn Kathrine Wehus合作论文数16
 J.A. Rubiño Martín合作论文数Instituto de Astrofisica de Canarias15
 Joshua O. Gundersen合作论文数Department of Physics;University of Miami;Department of Physics, University of Miami15Ra Watson合作论文数14
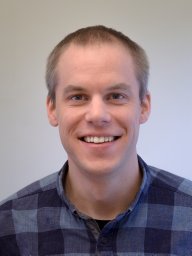 H. T. Ihle合作论文数14
 Lucio Piccirillo合作论文数Department of Physics and Astronomy, School of Natural Sciences, Faculty of Science and Engineering, The University of Manchester14
 R. Belén Barreiro合作论文数Instituto de Física de Cantabria, Joint Centre with the combined effort of Spanish National Research Council and University of Cantabria13
 J. Richard Bond合作论文数Department of Physics, University of Toronto;Canadian Institute for Theoretical Astrophysics, University of Toronto13
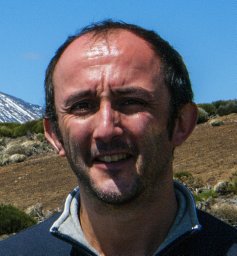 Frederick Poidevin合作论文数Departamento de Astrofísica, Universidad de La Laguna12
 Patricio Vielva合作论文数Instituto de Fisica de Cantabria12
 Diego Herranz Muñoz合作论文数Universidad de Cantabria;Instituto de Física de Cantabria12
 Kieran A. Cleary合作论文数12
 Rafael Rebolo合作论文数Institute of Astrophysics of the Canary Islands12A. Lasenby合作论文数11
 Denis Tramonte合作论文数11
 Keith Grainge合作论文数Astronomy and Astrophysics Theory Group, Department of Physics & Astronomy, School of Natural Sciences, The University of Manchester11
 Norman Murray合作论文数Canadian Institute for Theoretical Astrophysics, University of Toronto;McLennan Physical Laboratories, University of Toronto11
 Francisco Javier Casas合作论文数Instituto de Física de Cantabria, Universidad de Cantabria11
 Enrique Martínez González合作论文数Consejo Superior de Investigaciones Científicas, Instituto de Física de Cantabria10Dongwoo T. Chung合作论文数10R. Vignaga合作论文数10
 Bruno Maffei合作论文数Sch. of Phys. & Astron., Univ. of Manchester;c;Sch. of Phys. & Astron., Univ. of Manchester10
 Richard Battye合作论文数Jodrell Bank Centre for Astrophysics, School of Physics & Astronomy, The University of Manchester10
 Eduardo Artal合作论文数10Andrew I. Harris合作论文数10
 Mark Ashdown合作论文数The Cavendish Laboratory, Department of Physics, University of Cambridge10R. Cepeda-Arroita合作论文数9B. Casaponsa合作论文数9M. McCulloch合作论文数9
 Sarah Church合作论文数Department of Physics, School of Humanities and Sciences, Stanford University;SLAC National Accelerator Laboratory9
 Hamsa Padmanabhan合作论文数Fergusson College;Pune University;Fergusson College, Pune University9Simon J. Melhuish合作论文数School of Physics and Astronomy;Cardiff University;School of Physics and Astronomy, Cardiff University9M. W. Peel合作论文数8
 Patrick N. Breysse合作论文数Johns Hopkins Bloomberg School of Public Health8
 James W. Lamb合作论文数8
 Giampaolo Pisano合作论文数School of Physics and Astronomy;University of Manchester;School of Physics and Astronomy, University of Manchester8J. P. Leahy合作论文数8
 R. J. Hoyland合作论文数8F. Gomez-Renasco合作论文数7Thomas J. Rennie合作论文数7Nils-Ole Stutzer合作论文数7Delaney A. Dunne合作论文数7
 D. J. Watts合作论文数Institute of Theoretical Astrophysics, University of Oslo7
 José María Diego Rodríguez合作论文数Consejo Superior de Investigaciones Cientificas, Instituto de Fisica de Cantabria7
 Enrique Villa合作论文数Dept. of Commun. Eng., Univ. of Cantabria;c;Dept. of Commun. Eng., Univ. of Cantabria7




