Estimating hydrogeologic parameters from time-lapse electrical resistivity tomography (ERT) monitoring data is challenging due to the inherent non-uniqueness and ill-posed nature of mapping measured geophysical responses to subsurface flow and transport properties. In this work, we present an artificial intelligence (AI)-driven methodology employing conditional diffusion models to robustly estimate hydrogeologic simulation parameters while explicitly quantifying uncertainty. Our approach uses a reverse diffusion process that starts with a Gaussian random vector and gradually denoises it conditioned on time-lapse ERT monitoring data to recover a 29-dimensional parameter vector. The trained AI model generates ensembles of subsurface models that honor the conditional data, providing a mechanism for assessing uncertainty. A goodness-of-fit metric assesses the accuracy and precision of the uncertainty distribution for each parameter, avoiding unreliable or overconfident solutions. Experimental results modeled after an in-situ soil flushing treatment conducted at the Hanford 100K East site in Washington State, USA, demonstrate that the recovered parameter sets produce simulated ERT data in close agreement with the given conditional ERT data, highlighting that conditional diffusion models offer a robust solution for geophysical inversion, including parameter uncertainty estimation.
Electrically resistive grout mixtures were evaluated for cross-borehole electrical resistivity tomography (ERT) applications, which are increasingly used for environmental investigations. Grout is typically used to fill the annular space between the electrodes and the surrounding formation and therefore plays a critical role in electrically connecting the electrodes to the surrounding formation. The ideal grout for cross-borehole ERT applications has a resistivity that is higher than the surrounding formation so that the injected current is channeled within the formation instead of along the wellbore. Bentonite and Portland cement are typically used as materials to fill the annulus in wellbore installations; however, the resistivity of these materials is too low for high-quality ERT imaging. In this study, we tested grout mixtures that combine Portland cement with additives to develop resistive grout options to optimize ERT imaging while maintaining acceptable construction properties. Additives were chosen based on known chemical reactions, verified using powdered X-ray diffraction on select samples, whereby pore water and dissolved ions would be reduced, resulting in an increased resistivity. Additives include pozzolans such a Class F fly ash and Hess pumice. Other additives include slag, aluminum sulfate, and gypsum. Grouts were tested in three groups by additive, with one grout from each group with the highest resistivity selected for an X-ray diffraction analysis and other physical characteristic testing (strength, viscosity, and set time). The resistivity of pozzolan grouts can be predicted using the calcium to silicate and aluminate ratio with resistivities ranging from 76 to 680 Omega-m in 90 days. Grouts using sulfate minerals increase in resistivity more quickly than grouts only using pozzolan additives and have a resistivity range from 970 to 1820 Ohm-m in 90 days. Grouts containing pumice had reduced strength and increased viscosity, but grout containing fly ash and slag maintained similar physical properties to neat Portland cement. This study provides quantitative results that can be used to aid in selection of grout formulations that have a high likelihood of success in terms of construction and ERT image quality.
With the goal of better understanding stimulation in crystalline rock for improving enhanced geothermal systems (EGS), the EGS Collab Project performed a series of stimulations and flow tests at 1.25 and 1.5 km depths. The tests were performed in two well-instrumented testbeds in the Sanford Underground Research Facility in Lead, South Dakota, United States. The testbed for Experiment 1 at 1.5 km depth contained two open wells for injection and production and six instrumented monitoring wells surrounding the targeted stimulation zone. Four multistep stimulation tests targeting hydraulic fracturing and nearly year-long ambient temperature and chilled water flow tests were performed in Experiment 1. The testbed for Experiments 2 and 3 was at 1.25 km depth and contained five open wells in an outwardly fanning five-spot pattern and two fans of well-instrumented monitoring wells surrounding the targeted stimulation zone. Experiment 2 targeted shear stimulation, and Experiment 3 targeted low-flow, high-flow, and oscillating pressure stimulation strategies. Hydraulic fracturing was successful in Experiments 1 and 3 in generating a connected system wherein injected water could be collected. However, the resulting flow was distributed dynamically, and not entirely collected at the anticipated production well. Thermal breakthrough was not observed in the production well, but that could have been masked by the Joule-Thomson effect. Shear stimulation in Experiment 2 did not occur - despite attempting to pressurize the fractures most likely to shear - because of the inability to inject water into a mostly-healed fracture, and the low shear-to-normal stress ratio. The EGS Collab experiments are described to provide a background for lessons learned on topics including induced seismicity, the correlation between seismicity and permeability, distributed and dynamic flow systems, thermoelastic and pressure effects, shear stimulation, local geology, thermal breakthrough, monitoring stimulation, grouting boreholes, modeling, and system management.
Electrical double layer (EDL) models are commonly adopted as a framework for understanding electrokinetic properties at mineral-fluid interfaces but the dynamics of ion and water mobilities are typically not well known. Extending the previous work performed at equilibrium conditions, here it is examined how applied electric fields induce mobilities of monovalent and divalent ions at hydroxylated quartz (001) and (101) interfaces with various electrolyte solutions (NaCl, KCl, and CaCl2). The simulations reveal how the diffusion coefficients depend on the orientation and magnitude of the applied electric field, with a particularly strong effect for fields applied parallel to the quartz surfaces. While the effect in perpendicular applied fields is more subtle, nonetheless the disruption of the water in the first layers at the surface with corresponding effects on wettability is observed. The details of EDL ion drift mobilities are found to be strongly correlated to the silanol density and crystallographic orientation at the interface. The findings shed light on the complex interplay between local and external forces affecting how these interfaces respond in applied field applications that include electrical impedance spectroscopy, electroosmotic flow, and ζ -potential measurements.
The EGS Collab project performed well-monitored rock stimulation and flow tests at the 10-m scale in an underground research laboratory to inform challenges in implementing enhanced geothermal system (EGS) technology. This project, supported by the US Department of Energy, gathered data and observations from the field tests and compared these to simulation results to understand processes and to build confidence in numerical modeling of the processes.
ABSTRACT: The Center for Understanding Subsurface Signals and Permeability is a new U.S. Department of Energy Earthshot Center focused on understanding and predicting the long-term evolution of permeability in enhanced geothermal systems. The center will use a highly instrumented testbed within the Sanford Underground Research Facility to conduct field scale experiments that elucidate and test capabilities to simulate geochemical-geomechanical interactions and permeability evolution. Here we demonstrate initial developments using previously collected electrical resistivity tomography (ERT) monitoring data with high-performance multi-physics modelling advancements to inform the optimal location of two new monitoring boreholes. Specifically, ERT monitoring data collected during shear stimulation testing shows marked responses to changes in stress during borehole pressurization. We demonstrate how the same response is being simulated, ultimately to train a machine-learning algorithm to estimate rock properties and enable enhanced prediction of stress and strain responses anticipated during future testing campaigns. 1. INTRODUCTION The Center for Understanding Subsurface Signals and Permeability (CUSSP) is a new U.S. Department of Energy – Office of Science funded Enhanced Geothermal System (EGS) Earthshot center focused on elucidating the complex feedbacks between physical and chemical processes and permeability evolution in EGS systems. CUSSP plans to enhance the highly instrumented testbed on the 4100 level of the Sanford Underground Research Facility, developed under the EGS Collab project, to conduct closely monitored and accurately simulated physiochemical experiments that ultimately demonstrate understanding, predictability, and control of system permeability over time. Multi-physics signal integration is a key aspect of CUSSP. CUSSP will develop and exploit electrical resistivity tomography (ERT) for its ability to inform on stress-induced changes in porosity, which when combined with strain monitoring will help deconvolute relationships between pressure distribution and deformation. The 4100-level testbed will be augmented with new monitoring boreholes containing ERT electrodes and high precision multi-component strain meters. In this paper, we demonstrate how prior pressure, flow, and 4D ERT monitoring data collected under the EGS Collab project during shear stimulation attempts are being used to inform optimal placement of the new monitoring boreholes. The shear stimulation experiments, meant to increase fracture permeability, involved pressurizing isolated sections of an injection borehole below the minimum principal stress to open and shear slip a potential flowable natural fracture. Although each stimulation attempt failed to achieve shear-slip, time-lapse ERT collected during each attempt was inverted to reveal zones of decreased electrical conductivity forming around the isolated and pressured stimulation interval. Because there was no flow into the system, the zone of decreased electrical conductivity could only have been caused by the compressive stress-bulb that developed around pressurized interval, and the corresponding decrease in porosity within the stress-bulb footprint. These results conclusively demonstrate the field-scale sensitivity of electrical conductivity to stress that have been previously demonstrated at the laboratory scale.
Abstract Fluid flow through fractured media is typically governed by the distribution of fracture apertures, which are in turn governed by stress. Consequently, understanding subsurface stress is critical for understanding and predicting subsurface fluid flow. Although laboratory‐scale studies have established a sensitive relationship between effective stress and bulk electrical conductivity in crystalline rock, that relationship has not been extensively leveraged to monitor stress evolution at the field scale using electrical or electromagnetic geophysical monitoring approaches. In this paper we demonstrate the use time‐lapse 3‐dimensional (4D) electrical resistivity tomography to image perturbations in the stress field generated by pressurized borehole packers deployed during shear‐stimulation attempts in a 1.25 km deep metamorphic crystalline rock formation.
Abstract Surface electrical resistivity tomography (ERT) was used at a waste site to monitor vadose zone changes in electrical properties as a proxy for contaminant flux over a span of 17 years. The BC Cribs and Trenches (BCCT) site at the Hanford site contains 20 disposal trenches and six disposal cribs. Wastes include a large inventory of technetium‐99 and large masses of nitrate and uranium‐238. ERT data were collected along 41 profiles in 2005 to characterize regions of elevated bulk electrical conductivity (BEC) associated with past liquid waste discharges. Previous analyses performed on samples from four boreholes showed a high correlation between nitrate concentration and BEC. In 2022, ERT data were re‐collected along the same profiles and six additional profiles in an area not previously surveyed. Compared to background uncontaminated areas, BEC was higher in contaminated areas at the waste sites. Given the correlation between nitrate concentration and BEC previously found at this site, ERT images show the spatial distribution and relative ionic concentration of vadose zone contaminants at BCCT. Between 2005 and 2022, ERT difference images showed a decrease in BEC surrounding most waste sites, with exceptions where there were known anthropogenic surface changes. An evaluation of recharge‐driven nitrate migration using synthetic flow and transport simulations showed that downward migration causes a decrease in BEC from the decrease in ionic strength at the trailing end of the plume where contaminants migrated downward. From this, we interpret ERT difference images as showing the predominant regions of downward ion flux.
Enhanced geothermal systems (EGS) require cost-effective monitoring of fracture networks. We validate the capability of using borehole distributed acoustic sensing (DAS) ambient noise for fracture monitoring using core photos and core logs. The EGS Collab project has conducted 10 m scale field experiments of hydraulic fracture stimulation using 50–60 m deep experimental wells at the Sanford Underground Research Facility (SURF) in Lead, South Dakota. The first EGS Collab testbed is located at 1616.67 m (4850 ft) depth at SURF and consists of one injection well, one production well, and six monitoring wells. All wells are drilled subhorizontally from an access tunnel called a drift. The project uses a single continuous fiber-optic cable installed sequentially in the six monitoring wells to record DAS data for monitoring hydraulic fracturing during stimulation. We analyze 60 s time records of the borehole DAS ambient noise data and compute the noise root-mean-square (rms) amplitude on each channel (points along the fiber cable) to obtain DAS ambient noise rms amplitude depth profiles along the monitoring wellbore. Our noise rms amplitude profiles indicate amplitude peaks at distinct depths. We compare the DAS noise rms amplitude profiles with borehole core photos and core logs and find that the DAS noise rms amplitude peaks correspond to the locations of fractures or lithologic changes indicated in the core photos or core logs. We then compute the hourly DAS noise rms amplitude profiles in two monitoring wells during three stimulation cycles in 72 h and find that the DAS noise rms amplitude profiles vary with time, indicating the fracture opening/growth or closing during the hydraulic stimulation. Our results demonstrate that borehole DAS passive ambient noise can be used to detect fractures and monitor fracturing processes in EGS reservoirs.
Electrical resistivity tomography (ERT) is a broadly accepted geophysical method for subsurface investigations. Interpretation of field ERT data usually requires the application of computationally intensive forward modeling and inversion algorithms. For large-scale ERT data, the efficiency of these algorithms depends on the robustness, accuracy, and scalability on high-performance computing resources. In this regard, we present a robust and highly scalable implementation of forward modeling and inversion algorithms for ERT data. The implementation is publicly available and developed within the framework of PFLOTRAN, an open-source, state-of-the-art massively parallel subsurface flow and transport simulation code. The forward modeling is based on a finite-volume discretization of the governing differential equations, and the inversion uses a Gauss–Newton optimization scheme. To evaluate the accuracy of the forward modeling, two examples are first presented by considering layered (1D) and 3D earth conductivity models. The computed numerical results show good agreement with the analytical solutions for the layered earth model and results from a well-established code for the 3D model. Inversion of ERT data, simulated for a 3D model, is then performed to demonstrate the inversion capability by recovering the conductivity of the model. To demonstrate the parallel performance of PFLOTRAN's ERT process model and inversion capabilities, large-scale scalability tests are performed by using up to 131 072 processes on a leadership class supercomputer. These tests are performed for the two most computationally intensive steps of the ERT inversion: forward modeling and Jacobian computation. For the forward modeling, we consider models with up to 122 ×106 degrees of freedom (DOFs) in the resulting system of linear equations and demonstrate that the code exhibits almost linear scalability on up to 10 000 DOFs per process. On the other hand, the code shows superlinear scalability for the Jacobian computation, mainly because all computations are fairly evenly distributed over each process with no parallel communication.
We performed the first 3D island‐scale tomography of the electrical conductivity of Stromboli volcano (Aeolian Islands, Italy) using 2D acquisition lines (37.2 km) and a total of 18,880 measurements and 2,402 unique electrode locations. This 3D data set was inverted using a Gauss‐Newton algorithm, parallel‐processing on an unstructured tetrahedral mesh containing 678,420 finite‐element nodes and 3,580,145 elements to account for the topography of the volcanic island. The tomogram exhibits a conductive body (10 −2 –1.0 S m −1 ) consistent with the location of CO 2 and temperature anomalies observed at the ground surface. It corresponds to the hydrothermal system with high electrical conductivity associated with alteration. In order to confirm this interpretation, a 2.5D large‐scale induced polarization tomography was performed crossing the volcano. The joint interpretation of the conductivity and normalized chargeability is done with a petrophysical model previously tested and verified at both shield‐ and strato‐volcanoes. This model implies that alteration (through the effect of the cation exchange capacity associated with clay minerals and zeolites) plays a strong role in both controlling the electrical conductivity and normalized chargeability at Stromboli volcano. A temperature tomogram, derived from the geoelectrical measurements, is consistent with surface temperature anomalies and the Very Long Period (VLP) seismicity related to the mild‐explosive activity. This survey displays at 600 m a.s.l. a lateral shift in the highest temperature location, also corresponding to the source of VLP seismicity. Structural boundaries have a major role in the hottest hydrothermal fluids rising below the active crater terrace of Stromboli volcano.
A subsurface air injection at the Hanford Site's Deep Vadose Zone Monitoring Test Bed was completed to realize a change in subsurface hydrologic conditions in accordance with a soil desiccation remedy. The injection mimicked a previous injection at the site that was performed in accordance with a vadose zone treatability study. Unlike the previous test which relied on electrical methods only, the change in hydrologic conditions during the recent test was also monitored using cross-hole seismic sensing methods to assess the ability of the seismic methods to evaluate changes in moisture conditions of desiccated sediment at the field scale. Data from in situ neutron probes indicates a reduction of soil moisture in the vicinity of the injection well due to the air injection. Similar changes were observed in the time-lapse electrical resistivity and seismic data, which indicates a loss of soil moisture over time. Tomographic inversions of the time-lapse geophysical data illustrate the 2D and 3D features of the soil moisture distribution over time. Time-lapse electrical resistivity tomography (ERT) results show a reduction in the electrical conductivity of the subsurface in the vicinity of the injection well, with most changes occurring within the screened interval. Similar patterns are observed in the seismic tomography results, with both methods illustrating two lobe-shaped features of reduced soil moisture. Use of seismic and ERT technologies in tandem takes advantage of two complementary geophysical monitoring technologies, providing increased sensitivity to specific hydrologic conditions. The multiphysics approach, therefore, has the potential to improve the ability to estimate subsurface moisture conditions from sensor-based and remotely sensed geophysical data that will ultimately improve the ability of remediation contractors to evaluate remedy performance.
Migration of groundwater contaminants in the Gable Gap area of the Hanford Site in southeastern Washing-ton State is strongly influenced by the distribution and permeability of basalts that lie beneath an unconfined aquifer. Locally, folding and faulting of the Columbia River Basalt associated with the Yakima fold and thrust belt followed by erosion due to the Lake Missoula floods resulted in a complex basalt surface that represents ei-ther an impermeable lower boundary to the unconfined aquifer system or localized regions of increased per-meability that potentially promote communication be-tween the unconfined aquifer system and deeper, con-fined aquifer systems. Paleo-channels carved into the basalt by floodwaters are thought to provide preferen-tial flow paths for groundwater contaminants. In 2011, a seismic landstreamer campaign was carried out to im-age the basalt surface and produced pre-stack depth mi-grated p-wave reflection images. The reflection images identified two large troughs that may represent paleo-channels and several areas of possible faulting. Here, the streamer data are re-analyzed using refraction travel -time and Rayleigh wave dispersion analyses to obtain images of compressional and shear wave velocities within the suprabasalt sediment sections and the upper basalt surface. The combined interpretation of reflection and seismic velocity images shows complexity in the basalt velocity and elevation, which varies by 50 m or more within the study area. These results, along with other on-going geophysical investigations, will be used to inform the site geologic model and potentially guide placement of future boreholes needed to quantify vertical flow be-tween the confined and unconfined aquifers.
The goal of this Laboratory Directed Research and Development (LDRD) project was to develop a borehole seismic source and sensor array to enable real-time seismic imaging at scales and conditions relevant to the energy industry including both fossil-energy and geothermal. In FY21 and FY22, we designed, built, and tested both a prototype impulse source module for generating seismic energy and a sensing module for recording ground motions generated by the source module array. A pneumatically driven vibratory source was also designed. The source modules were fabricated with all high temperature components and the team has worked to incorporate the current RT-SEISMIC electronics design into a commercially available, high temperature silicon-on-insulator chip integrated circuit. Several issues were identified during fabrication and lab testing that led to redesign of several system components and subsequent retesting. The final round of testing showed that while metal/graphite-based seals worked quite well for static seals, they were unable to provide an adequate gas seal for dynamic, reciprocating part movements which necessitated a final redesign using Kalrez. This change will result in a continuous temperature rating of approximately 275 degrees C for the system. While a field test of the RT-SEISMIC system was targeted in FY22, due to the extended lab testing and redesign efforts, field testing was not achieved. As a result of this LDRD investment, several sponsors have expressed interest in RT-SEISMIC and we expect to continue towards a field demonstration of the full system in the future.
The EGS Collab project, supported by the US Department of Energy, is performing intensively monitored rock stimulation and flow tests at the 10-m scale in an underground research laboratory to address challenges in implementing enhanced geothermal systems (EGS). Data and observations from the field tests are compared to simulations to understand processes and build confidence in numerical modeling of the processes. Experiment 1 examined hydraulic fracturing in a well-characterized fractured phyllite 1.5 km deep at the Sanford Underground Research Facility (SURF). Testbed characterization included fracture mapping, borehole acoustic and optical televiewers, full waveform sonic, conductivity, resistivity, temperature, campaign p- and s-wave investigations and electrical resistance tomography. Borehole geophysical techniques including passive seismic, continuous active source seismic monitoring, electrical resistance tomography, fiber-based distributed strain, distributed temperature, and distributed acoustic monitoring, were used to carefully monitor stimulation events and flow tests. More than a dozen stimulations and nearly one year of flow tests were performed. Quality data and detailed observations were collected and analyzed during stimulation and water flow tests, and these data are available. We achieved adaptive control of the tests using real-time monitoring and rapid dissemination of data and near-real-time simulation. Experiment 2 examines the potential for hydraulic shearing in amphibolite 1.25 km deep at SURF. The testbed consists of nine subhorizontal boreholes, four of which surround the testbed with grouted-in ERT, seismic sensors, CASSM and distributed fiber sensors. The test wells include a “five-spot” set with an injection well and four production/monitoring wells. Like Experiment 1, the testbed was characterized geophysically and hydrologically, and three stimulations have been performed using new tools.
There is a growing need to assess long-term impacts of active remediation strategies on treated aquifers. A variety of biogeochemical alterations can result from interactions of the amendment with the aquifer, conceivably leading to a geophysical signal associated with the long-term alteration of an aquifer. This concept of post-remediation geophysical assessment was investigated in a shallow, chlorinated solvent-contaminated aquifer six to eight years after amendment delivery. Surface resistivity imaging and cross-borehole resistivity and induced polarization (IP) imaging were performed on a transect that spanned treated and untreated zones of the aquifer. Established relationships between IP parameters and surface electrical conductivity were used to predict vertical profiles of electrolytic conductivity and surface conductivity from the inverted cross-borehole images. Aqueous geochemistry data, along with natural gamma and magnetic susceptibility logs, were used to constrain the interpretation. The electrical conductivity structure determined from surface and borehole imaging was foremost controlled by the electrolytic conductivity of the interconnected pore space, being linearly related to fluid specific conductance. The electrolytic conductivity (and thus the conductivity images alone) did not discriminate between treated and untreated zones of the aquifer. In contrast, inverted phase angles and surface conductivities did discriminate between treated and untreated zones of the aquifer, with the treated zone being up to an order of magnitude more polarizable in places. Supporting aqueous chemistry and borehole logging datasets indicate that this geophysical signal from the long-term impact of the remediation on the aquifer is most likely associated with the formation of polarizable, dispersed iron sulfide minerals.
Groundwater surface water exchange plays a critical role in physical, biological, and geochemical function of coastal and riverine systems. Observing exchange flow behavior in heterogeneous systems is a primary challenge, particularly when flows are governed by dynamic river stage or tidal variations. In this paper we demonstrate a novel application of time-lapse 3D electrical resistivity tomography and temperature monitoring where an array of thermistors installed beneath a riverbed double as resistivity electrodes. We use the array to monitor stage driven exchange flows over a 6-day period in a dynamic, stage-driven high order stream. We present a method for addressing the otherwise confounding effects of the moving river-surface boundary on the raw resistivity data, thereby enabling successful tomographic imaging. Temperature time-series at each thermistor location and time-lapse 3D images of changes in bulk electrical conductivity together provide a detailed description of exchange dynamics over a 10-meter by 45-meter section of the riverbed, to a depth of approximately 5 m. Results reveal highly variable flux behavior throughout the monitoring domain including both horizontal and vertical exchange flows.
 Strickland Chris E合作论文数32
 H. A. Knox合作论文数Pacific Northwest National Laboratory24
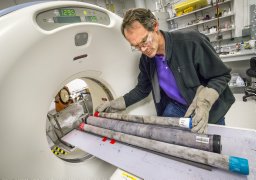 Timothy J. Kneafsey合作论文数Lawrence Berkeley National Laboratory21
 Joseph Morris合作论文数Lawrence Livermore National Laboratory18
 Jonathan Ajo-Franklin合作论文数Earth Science Division, Lawrence Berkeley National Laboratory18
 Pengcheng Fu合作论文数16
 Craig Ulrich合作论文数Lawrence Berkeley National Laboratory Berkeley15
 Roelof Versteeg合作论文数INL15
 Lee Slater合作论文数School of Arts & Sciences-Newark, Rutgers University Newark15
 Jeff Burghardt合作论文数14
 judith robinson合作论文数14
 Patrick F Dobson合作论文数14Mark D White合作论文数14
 Ghanashyam Neupane合作论文数UA Department of Geological Sciences Box 870338 Tuscaloosa AL 35487 USA14
 Huang Lianjie合作论文数Los Alamos Natl Lab13
 Roland Horne合作论文数Department of Earth System Science, School of Sustainability, Stanford University;Woods Institute for the Environment, Stanford University13
 Yves Guglielmi合作论文数Laboratoire de géologie des systèmes et des réservoirs carbonatés, Université de Provence13Paul C. Schwering合作论文数12
 Jonathan N. Thomle合作论文数12Frederick D. Day-Lewis合作论文数U. S. Geological Survey12T. Doe合作论文数11
 Jon Weers合作论文数Natl Renewable Energy Lab, NREL11Luke Frash合作论文数Los Alamos National Laboratory11Michael J. Truex合作论文数11J. Heise合作论文数10
 Satish Karra合作论文数Department of Mechanical Engineering, Texas A & M University10Monica Maceira合作论文数10
 Megan M. Smith合作论文数Rhode Island Hospital10
 Ahmad Ghassemi合作论文数Mewbourne School of Petroleum and Geological Engineering, University of Oklahoma10B. Johnston合作论文数9
 Mark McClure合作论文数European Remanufacturing Council9
 Christine Doughty合作论文数Energy Geosciences Division, Hydrogeology Department, E. O. Lawrence Berkeley National Laboratory9
 John W Lane合作论文数Office of Groundwater, US Geological Survey9
 Bezalel C. Haimson合作论文数Geological Engineering Program, Department of Materials Science and Engineering, University of Wisconsin9Vince R. Vermeul合作论文数9
 James C. Stegen合作论文数Biological Sciences Division, Pacific Northwest National Laboratory9
 Dimitrios Ntarlagiannis合作论文数Department of Earth and Environmental Sciences, Rutgers University9
 Alain Bonneville合作论文数UMR7154, IPGP/CNRS9Z. Frone合作论文数8Mathew D. Ingraham合作论文数Sandia National Laboratory8L. Boyd合作论文数8S. J. Bauer合作论文数8
 Moo Y. Lee合作论文数Sandia National Labs8
 Ankush Singh合作论文数Sch Earth Energy & Environm Sci, Stanford Univ8
 M.M. Hu合作论文数Department of Civil Engineering, Faculty of Engineering, The University of Hong Kong8Baumgartner, T.合作论文数8
 Nataliia Makedonska合作论文数8George Guthrie合作论文数Los Alamos National Laboratory8Seiji Nakagawa合作论文数8




