Supplementary Figure 1. Original comparison of 18 cell lines sequenced by COSMIC and CCLE to display that the conformity of missense mutation detection ranges from 56.75% in HCC2218 cell line to 12.90% in HCC1954. Supplementary Figure 2. Bamfile images of the CRUK MI sequencing shows good read coverage with the PAK4 p.E119Q mutation in 51% of reads compared to CCLE hybrid capture bamfiles of the same area with only 2 reads and neither read showing a mutation. Supplementary Figure 3. Western Blot showing empty vector, PAK4 wildtype, and p.E119Q mutant overexpression in 293T cells with the mutant showing enhanced ERK phosphorylation but no effect on JNK phosphorylation. Supplementary Figure 4. Chart demonstrating an increase in conformity of reported mutations when the CCLE data that has not been filtered for germ line SNPs is used. Supplementary Figure 5. Comparison of mutation detection in four cell lines between COSMIC, CCLE and our own institute (CRUK MI) reveals 29.41% of mutations are missed by CRUK MI but the discrepancy decreases to 17.65% when the comparison is repeated with CRUK MI data that has not been filtered for germ line SNPs.
<p>Supplementary Table 1A. Mutations that were only identified by CCLE in the comparison of sequencing data of 1630 genes across 568 cell lines from CCLE and COSMIC . Supplementary Table 1B. Mutations that were only identified by COSMIC in the comparison of sequencing data of 1630 genes across 568 cell lines from CCLE and COSMIC. Supplementary Table 2. Sequencing cold spots (larger than 100bp) in cancer consensus and kinase genes identified from sequencing data of 10 CCLE whole exome sequencing files (not hybrid capture). Supplementary Table 3. New mutations detected by CRUK Manchester Institute sequencing that were not reported by either CCLE or COSMIC. Supplementary Table 4. Proportion of missense mutations exclusively reported by one institute (CCLE or COSMIC) that were subsequently found by CRUK MI sequencing. Supplementary Table 5. Sequencing statistics for CRUK MI sequencing. Supplementary Table 6. List of kinase and Cancer Census genes that were analyzed to identify sequencing cold-spots in 10 CCLE whole exome sequencing files Supplementary Table 7 Read coverage in CCLE Hybrid Capture data at the midpoint of the 20 largest cold-spots identified in CCLE from 10 lung whole exome sequencing files (not hybrid capture).</p>
Lung cancer is one of the major causes of cancer deaths worldwide and only 30% of patients survive the disease for at least one year after diagnosis. Patients are often too frail to receive systemic chemotherapy and there is an urgent need for less toxic, efficacious, targeted therapies. Despite recent efforts with large-scale genomics data we still lack knowledge about driver mutations for the majority of lung cancers. Increasingly, cancer researchers are using online cancer genomic databases to identify novel targets to investigate. A comparison of two prominent databases from different institutes (CCLE and COSMIC) revealed marked discrepancies in the detection of missense mutations in identical cell lines (57.38% conformity). A major reason for this discrepancy is inadequate sequencing of GC-rich areas. This is a significant issue for lung cancer, with a mutation signature predominantly affecting guanine and cytosine nucleotides and therefore preferring GC-rich regions. We have therefore focused on GC-rich regions that next-generation-sequencing struggle to cover and discovered over 400 of these regions (cold-spots) in Cancer Consensus and kinase genes alone. We demonstrate how a PAK4 mutation, found in a GC-rich cold-spot in a lung adenocarcinoma cell line, activates the pERK pathway. This suggests that specific targeting of GC-rich regions may be required to uncover further oncogenes and tumour suppressors in lung cancer. The high mutational burden of lung cancer creates additional challenges in distinguishing driver mutations from a multitude of passenger mutations. One solution is to use siRNA knockdown screens on all genes that are mutated in a cell line and assess cell viability. However we demonstrate that inconsistencies in mutational profiling of cell lines and passaging effects have the potential to influence these types of studies. These limitations also offer new explanations for the discrepancies seen when comparing pharmacogenomics studies. Citation Format: Andrew M. Hudson, Tim Yates, Chris Wirth, Yaoyong Li, Wendy Trotter, Shameem Fawdar, Crispin Miller, John Brognard. The challenges of using large-scale genomics data to identify novel drivers of lung cancer. [abstract]. In: Proceedings of the AACR Special Conference on Translation of the Cancer Genome; Feb 7-9, 2015; San Francisco, CA. Philadelphia (PA): AACR; Cancer Res 2015;75(22 Suppl 1):Abstract nr A2-18.
Background Whole genomes, whole exomes and transcriptomes of tumour samples are sequenced routinely to identify the drivers of cancer. The systematic sequencing and analysis of tumour samples, as well other oncogenomic experiments, necessitates the tracking of relevant sample information throughout the investigative process. These meta-data of the sequencing and analysis procedures include information about the samples and projects as well as the sequencing centres, platforms, data locations, results locations, alignments, analysis specifications and further information relevant to the experiments. Results The current work presents a sample tracking system for oncogenomic studies (Onco-STS) to store these data and make them easily accessible to the researchers who work with the samples. The system is a web application, which includes a database and a front-end web page that allows the remote access, submission and updating of the sample data in the database. The web application development programming framework Grails was used for the development and implementation of the system. Conclusions The resulting Onco-STS solution is efficient, secure and easy to use and is intended to replace the manual data handling of text records. Onco-STS allows simultaneous remote access to the system making collaboration among researchers more effective. The system stores both information on the samples in oncogenomic studies and details of the analyses conducted on the resulting data. Onco-STS is based on open-source software, is easy to develop and can be modified according to a research group’s needs. Hence it is suitable for laboratories that do not require a commercial system.
Abstract Cancer genome sequencing is being used at an increasing rate to identify actionable driver mutations that can inform therapeutic intervention strategies. A comparison of two of the most prominent cancer genome sequencing databases from different institutes (Cancer Cell Line Encyclopedia and Catalogue of Somatic Mutations in Cancer) revealed marked discrepancies in the detection of missense mutations in identical cell lines (57.38% conformity). The main reason for this discrepancy is inadequate sequencing of GC-rich areas of the exome. We have therefore mapped over 400 regions of consistent inadequate sequencing (cold-spots) in known cancer-causing genes and kinases, in 368 of which neither institute finds mutations. We demonstrate, using a newly identified PAK4 mutation as proof of principle, that specific targeting and sequencing of these GC-rich cold-spot regions can lead to the identification of novel driver mutations in known tumor suppressors and oncogenes. We highlight that cross-referencing between genomic databases is required to comprehensively assess genomic alterations in commonly used cell lines and that there are still significant opportunities to identify novel drivers of tumorigenesis in poorly sequenced areas of the exome. Finally, we assess other reasons for the observed discrepancy, such as variations in dbSNP filtering and the acquisition/loss of mutations, to give explanations as to why there is a discrepancy in pharmacogenomic studies, given recent concerns with poor reproducibility of data. Cancer Res; 74(22); 6390–6. ©2014 AACR.
Strand-specific RNA sequencing of S. pombe revealed a highly structured programme of ncRNA expression at over 600 loci. Waves of antisense transcription accompanied sexual differentiation. A substantial proportion of ncRNA arose from mechanisms previously considered to be largely artefactual, including improper 3' termination and bidirectional transcription. Constitutive induction of the entire spk1+, spo4+, dis1+ and spo6+ antisense transcripts from an integrated, ectopic, locus disrupted their respective meiotic functions. This ability of antisense transcripts to disrupt gene function when expressed in trans suggests that cis production at native loci during sexual differentiation may also control gene function. Consistently, insertion of a marker gene adjacent to the dis1+ antisense start site mimicked ectopic antisense expression in reducing the levels of this microtubule regulator and abolishing the microtubule-dependent 'horsetail' stage of meiosis. Antisense production had no impact at any of these loci when the RNA interference (RNAi) machinery was removed. Thus, far from being simply 'genome chatter', this extensive ncRNA landscape constitutes a fundamental component in the controls that drive the complex programme of sexual differentiation in S. pombe.
Genome annotation is a synthesis of computational prediction and experimental evidence. Small genes are notoriously difficult to detect because the patterns used to identify them are often indistinguishable from chance occurrences, leading to an arbitrary cutoff threshold for the length of a protein-coding gene identified solely by in silico analysis. We report a systematic reappraisal of the Schizosaccharomyces pombe genome that ignores thresholds. A complete six-frame translation was compared to a proteome data set, the Pfam domain database, and the genomes of six other fungi. Thirty-nine novel loci were identified. RT-PCR and RNA-Seq confirmed transcription at 38 loci; 33 novel gene structures were delineated by 5′ and 3′ RACE. Expression levels of 14 transcripts fluctuated during meiosis. Translational evidence for 10 genes, evolutionary conservation data supporting 35 predictions, and distinct phenotypes upon ORF deletion (one essential, four slow-growth, two delayed-division phenotypes) suggest that all 39 predictions encode functional proteins. The popularity of S. pombe as a model organism suggests that this augmented annotation will be of interest in diverse areas of molecular and cellular biology, while the generality of the approach suggests widespread applicability to other genomes.
Background: RNA-Seq exploits the rapid generation of gigabases of sequence data by Massively Parallel Nucleotide Sequencing, allowing for the mapping and digital quantification of whole transcriptomes. Whilst previous comparisons between RNA-Seq and microarrays have been performed at the level of gene expression, in this study we adopt a more fine-grained approach. Using RNA samples from a normal human breast epithelial cell line (MCF-10a) and a breast cancer cell line (MCF-7), we present a comprehensive comparison between RNA-Seq data generated on the Applied Biosystems SOLiD platform and data from Affymetrix Exon 1.0ST arrays. The use of Exon arrays makes it possible to assess the performance of RNA-Seq in two key areas: detection of expression at the granularity of individual exons, and discovery of transcription outside annotated loci.Results: We found a high degree of correspondence between the two platforms in terms of exon-level fold changes and detection. For example, over 80% of exons detected as expressed in RNA-Seq were also detected on the Exon array, and 91% of exons flagged as changing from Absent to Present on at least one platform had fold-changes in the same direction. The greatest detection correspondence was seen when the read count threshold at which to flag exons Absent in the SOLiD data was set to t < 1 suggesting that the background error rate is extremely low in RNA-Seq. We also found RNA-Seq more sensitive to detecting differentially expressed exons than the Exon array, reflecting the wider dynamic range achievable on the SOLiD platform. In addition, we find significant evidence of novel protein coding regions outside known exons, 93% of which map to Exon array probesets, and are able to infer the presence of thousands of novel transcripts through the detection of previously unreported exon-exon junctions.Conclusions: By focusing on exon-level expression, we present the most fine-grained comparison between RNA-Seq and microarrays to date. Overall, our study demonstrates that data from a SOLiD RNA-Seq experiment are sufficient to generate results comparable to those produced from Affymetrix Exon arrays, even using only a single replicate from each platform, and when presented with a large genome.
Affymetrix exon arrays aim to target every known and predicted exon in the human, mouse or rat genomes, and have reporters that extend beyond protein coding regions to other areas of the transcribed genome. This combination of increased coverage and precision is important because a substantial proportion of protein coding genes are predicted to be alternatively spliced, and because many non-coding genes are known also to be of biological significance. In order to fully exploit these arrays, it is necessary to associate each reporter on the array with the features of the genome it is targeting, and to relate these to gene and genome structure. X:Map is a genome annotation database that provides this information. Data can be browsed using a novel Google-maps based interface, and analysed and further visualized through an associated BioConductor package. The database can be found at http://xmap.picr.man.ac.uk.
Affymetrix exon arrays contain probesets intended to target every known and predicted exon in the entire genome, posing significant challenges for high-throughput genome-wide data analysis. X:MAP http://xmap.picr.man.ac.uk, an annotation database, and exonmap http://www.bioconductor.org/packages/2.0/bioc/html/exonmap.html, a BioConductor/R package, are designed to support fine-grained analysis of exon array data. The system supports the application of standard statistical techniques, prior to the use of genome scale annotation to provide gene-, transcript- and exon-level summaries and visualization tools.
UNLABELLEDADAPT is an online database providing comprehensive mappings between Affymetrix probes and RefSeq and Ensembl transcripts. ADAPT was designed to help interpret microarray experiments by providing a means to explore the many-to-many relationships that exist between probes, probesets, transcripts and genes.AVAILABILITYADAPT can be queried via the web at http://bioinformatics.picr.man.ac.uk/adapt
 Crispin J. Miller合作论文数13Yaoyong Li合作论文数Faculty of Biology, Medicine and Health, University of Manchester7
 Andrew Hudson合作论文数Institute of Molecular Plant Sciences, The University of Edinburgh5
 Shameem Fawdar合作论文数School of Biosciences;University of Westminster5John Brognard合作论文数Department of Pharmacology;University of California at San Diego;Department of Pharmacology, University of California at San Diego5eleanor w trotter合作论文数4Paul Lorigan合作论文数Division of Cancer Sciences, School of Medical Sciences, Faculty of Biology, Medicine and Health, The University of Manchester4Chapman Phil合作论文数4
 Andrew Biankin合作论文数Wolfson Wohl Cancer Research Centre, University of Glasgow;Glasgow Precision Oncology Laboratory, University of Glasgow;Gabriel Precision Oncology;ICGC ARGO;Cancer Research UK;Precision-Panc4Bitton Danny A合作论文数Paterson Institute for Cancer Research, The University of Manchester2Scutt Paul J合作论文数2Stuart D Pepper合作论文数2Yvonne Hey合作论文数2Iain M. Hagan合作论文数2Agnes Grallert合作论文数2James R. Bradford合作论文数2Sian Dibben合作论文数1
 Duncan Smith合作论文数Department of Biology, College of Arts & Science, New York University1
 Furney Simon J合作论文数Mol Oncol Grp, Canc Res UK Manchester Inst1
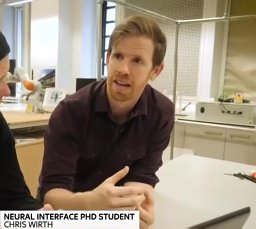 Wirth Christopher合作论文数Cancer Research UK Manchester Institute, University of Manchester1Gavrielides Mike合作论文数1
 Val Wood合作论文数Cambridge Systems Biology Centre, University of Cambridge1
 Claire Wilson合作论文数Centre for English Language Education, School of Education, University of Nottingham1
 Richard Marais合作论文数Oncodrug Ltd1Hui Sun Leong合作论文数1
 Michal Okoniewski合作论文数Department of Electrical and Software Engineering, University of Calgary/Acceleware Ltd.1




