Supplementary Figure S1 showing the flow chart of the analyses for identifying novel, unique, and common risk regions from DEPTH and logistic regression analyses.
Supplementary Table S7 shows the number of risk regions that are common to both CCFR and GECCO datasets in stage 1 DEPTH analysis, as well as whether they are detected by logistic regression analysis or were in previous CRC GWAS studies.
Integrating genome-wide association study (GWAS) and transcriptomic datasets can identify mediators for genetic risk of cancer. Traditional methods often are insufficient as they rely on total gene expression measures and overlook alternative splicing, which generates different transcript-isoforms with potentially distinct effects. We integrate multi-tissue isoform expression data from the Genotype Tissue-Expression Project with GWAS summary statistics (all N > ~20,000 cases) to identify isoform- and gene-level associations with six cancers (breast, endometrial, colorectal, lung, ovarian, prostate) and six related cancer subtype classifications (N = 12 total). Directly modeling isoforms using transcriptome-wide association studies (isoTWAS) significantly improves discovery of genetic associations compared to gene-level approaches, identifying 164% more significant associations (6163 vs. 2336) with isoTWAS-prioritized genes enriched 4-fold for evolutionarily-constrained genes. isoTWAS tags transcriptomic associations at 52% more independent GWAS loci across the six cancers. Isoform expression mediates an estimated 63% greater proportion of cancer risk SNP heritability compared to gene expression. We highlight several isoTWAS associations that demonstrate GWAS colocalization at the isoform level but not at the gene level, including CLPTM1L (lung cancer), LAMC1 (colorectal), and BABAM1 (breast). These results underscore the importance of modeling isoforms to maximize discovery of genetic risk mechanisms for cancers.
Supplementary Table S6 shows the number of risk regions identified by first stage DEPTH analysis.
Supplementary Table S1 shows the original number of cases and controls in both the CCFR and GECCO datasets.
Background:Deep Learning (DL) has emerged as a powerful tool to predict genetic biomarkers directly from digitized Hematoxylin and Eosin (H&E) slides in colorectal cancer (CRC). However, few studies have systematically investigated the predictability of biomarkers beyond routinely available alterations such as microsatellite instability (MSI), and BRAF and KRAS mutations. Methods:Our primary dataset comprised H&E slides of CRC tumors across five cohorts totaling 1,376 patients who underwent comprehensive panel sequencing, with an additional 536 patients from two public datasets for validation. We developed a DL model using a single transformer model to predict multiple genetic alterations directly from the slides. The model's performance was compared against conventional single-target models, and potential confounders were analyzed. Findings:The multi-target model was able to predict numerous biomarkers from pathology slides, matching and partly exceeding single-target transformers. The Area Under the Receiver Operating Characteristic curve (AUROC, mean ± std) on the primary external validation cohorts was: BRAF (0·78 ± 0·01), hypermutation (0·88 ± 0·01), MSI (0·93 ± 0·01), RNF43 (0·86 ± 0·01); this biomarker predictability was mirrored across metrics and co-occurrence analyses. However, biomarkers with high AUROCs largely correlated with MSI, with model predictions depending considerably on MSI-associated morphology upon pathological examination. Interpretation:Our study demonstrates that multi-target transformers can predict the biomarker status for numerous genetic alterations in CRC directly from H&E slides. However, their predictability is mainly associated with MSI phenotype, despite indications of slight biomarker-inherent contributions to a phenotype. Our findings underscore the need to analyze confounders in AI-based oncology biomarkers. To enable this, we developed a validated model applicable to other cancers and larger, diverse datasets. Funding:The German Federal Ministry of Health, the Max-Eder-Programme of German Cancer Aid, the German Federal Ministry of Education and Research, the German Academic Exchange Service, and the EU.
Supplementary Table S4 shows the number of participants filtered out at each QC stage (according to Supplementary Table S2).
Supplementary Figure S5 showing the QQ and Manhattan plots of conventional GWAS on the GECCO and CCFR datasets
BACKGROUND:Waist circumference (WC) and its allometric counterpart, "a body shape index" (ABSI), are risk factors for colorectal cancer; however, it is uncertain whether associations with these body measurements are limited to specific molecular subtypes of the disease. METHODS:Data from 2,772 colorectal cancer cases and 3,521 controls were pooled from four cohort studies within the Genetics and Epidemiology of Colorectal Cancer Consortium. Four molecular markers (BRAF mutation, KRAS mutation, CpG island methylator phenotype, and microsatellite instability) were analyzed individually and in combination (Jass types). Multivariable logistic and multinomial logistic models were used to assess the associations of WC and ABSI with overall colorectal cancer risk and, in case-only analyses, to evaluate heterogeneity by molecular subtype, respectively. RESULTS:Higher WC (ORper 5 cm = 1.06, 95% confidence interval, 1.04-1.09) and ABSI (ORper 1-SD = 1.07, 95% confidence interval, 1.00-1.14) were associated with elevated colorectal cancer risk. There was no evidence of heterogeneity between the molecular subtypes. No difference was observed regarding the influence of WC and ABSI on the four major molecular markers in proximal colon, distal colon, and rectal cancers, as well as in early- and late-onset colorectal cancers. Associations did not differ in the Jass-type analysis. CONCLUSIONS:Higher WC and ABSI were associated with elevated colorectal cancer risk; however, they do not differentially influence all four major molecular mutations involved in colorectal carcinogenesis but underscore the importance of maintaining a healthy body weight in colorectal cancer prevention. IMPACT:The proposed results have potential utility in colorectal cancer prevention.
Supplementary Table S5 shows the summary of known colorectal risk loci that are located in our CCFR and GECCO datasets.
Supplementary Table S9 shows the number of risk regions that are common to both CCFR and GECCO in stage 3 DEPTH analysis, as well as whether they are detected by logistic regression analysis or were in previous CRC GWAS studies.
Supplementary Table S3 shows the number of SNPs filtered out at each QC stage (according to Supplementary Table S2)
Supplementary Table S8 shows the number of risk regions that are common to both CCFR and GECCO in stage 2 DEPTH analysis, as well as whether they are detected by logistic regression analysis or were in previous CRC GWAS studies.
Supplementary Figure S2 of a principle components analysis showing the CCFR and GECCO datasets cluster with European Caucasians.
Supplementary Figure S3 shows further filtering of SNPs that had greater than 20% difference in odds ratio or P values when comparing odds ratios and P values before and after adjusting for the first four principal components.
BACKGROUND:Obesity has been positively associated with most molecular subtypes of colorectal cancer (CRC); however, the magnitude and the causality of these associations is uncertain. METHODS:We used Mendelian randomization (MR) to examine potential causal relationships between body size traits (body mass index [BMI], waist circumference, and body fat percentage) with risks of Jass classification types and individual subtypes of CRC (microsatellite instability [MSI] status, CpG island methylator phenotype [CIMP] status, BRAF and KRAS mutations). Summary data on tumour markers were obtained from two genetic consortia (CCFR, GECCO). FINDINGS:A 1-standard deviation (SD:5.1 kg/m2) increment in BMI levels was found to increase risks of Jass type 1MSI-high,CIMP-high,BRAF-mutated,KRAS-wildtype (odds ratio [OR]: 2.14, 95% confidence interval [CI]: 1.46, 3.13; p-value = 9 × 10⁻⁵) and Jass type 2non-MSI-high,CIMP-high,BRAF-mutated,KRAS-wildtype CRC (OR: 2.20, 95% CI: 1.26, 3.86; p-value = 0.005). The magnitude of these associations was stronger compared with Jass type 4non-MSI-high,CIMP-low/negative,BRAF-wildtype,KRAS-wildtype CRC (p-differences: 0.03 and 0.04, respectively). A 1-SD (SD:13.4 cm) increment in waist circumference increased risk of Jass type 3non-MSI-high,CIMP-low/negative,BRAF-wildtype,KRAS-mutated (OR 1.73, 95% CI: 1.34, 2.25; p-value = 9 × 10⁻⁵) that was stronger compared with Jass type 4 CRC (p-difference: 0.03). A higher body fat percentage (SD:8.5%) increased risk of Jass type 1 CRC (OR: 2.59, 95% CI: 1.49, 4.48; p-value = 0.001), which was greater than Jass type 4 CRC (p-difference: 0.03). INTERPRETATION:Body size was more strongly linked to the serrated (Jass types 1 and 2) and alternate (Jass type 3) pathways of colorectal carcinogenesis in comparison to the traditional pathway (Jass type 4). FUNDING:Cancer Research UK, National Institute for Health Research, Medical Research Council, National Institutes of Health, National Cancer Institute, American Institute for Cancer Research, Brigham and Women's Hospital, Prevent Cancer Foundation, Victorian Cancer Agency, Swedish Research Council, Swedish Cancer Society, Region Västerbotten, Knut and Alice Wallenberg Foundation, Lion's Cancer Research Foundation, Insamlingsstiftelsen, Umeå University. Full funding details are provided in acknowledgements.
Abstract We used deep learning (DL) to predict multiple genetic biomarkers of colorectal cancer (CRC) from routine histopathology images, aiming to identify morphological changes associated with the mutational profile of tumors. A new Transformer-based prediction model was developed which can simultaneously predict multiple biomarkers from a single histopathology image. We compared the performance of the multi-target approach to conventional single-target models. We analyzed five patient cohorts from the Genetics and Epidemiology of CRC Consortium (GECCO) with colorectal cancer (N=1,385 patients). Our model was trained on an internal data set (N=739) to predict the presence of >200 genetic alterations, focusing on genes with non-silent mutations and mutational signatures, which were assessed using targeted sequencing. We used a 7-fold cross validation and validated the model on an independent, external data set (N=646). Morphological features of microsatellite instability (MSI) are detectable by DL models in histopathology images, making MSI a potential confounding factor. Thus, we also assessed whether our model can predict genetic alterations regardless of MSI status, or whether the model identifies the MSI phenotype. For the majority of biomarkers, the multi-target transformer reached a higher prediction performance as measured by the mean Area Under the Receiver Operating Characteristic (AUROC) Curve and lower standard deviation than single-target DL models. For the external validation set, the mean AUROC of the multi-target versus the single-target model was 0.78 (+/- 0.01) versus 0.72 (+/- 0.06) for BRAF mutations, 0.88 (+/- 0.01) versus 0.86 (+/- 0.03) for hypermutation status, 0.94 (+/- 0.01) versus 0.91 (+/- 0.02) for MSI, 0.86 (+/- 0.01) versus 0.80 (+/- 0.05) for RNF43 mutations and 0.72 (+/- 0.02) versus 0.69 (+/- 0.05) for TP53 mutations, respectively. However, our analysis of the individual prediction scores suggests that the model does not identify the phenotype of the alterations themselves. Instead, the model seems to determine the status of specific genetic alterations based on their correlation with MSI. Consequently, biomarkers which are associated with microsatellite stability have prediction scores negatively correlated with predicted MSI scores. Conversely, biomarkers which are associated with MSI have prediction scores positively correlated with predicted MSI scores. Our results demonstrate potential benefits of multi-target DL models in improving the predictive power and efficacy of histology-based biomarker extraction compared to single-target DL models. However, our results crucially highlight the importance of considering potential confounders, such as MSI status in CRC, and emphasize the need for extensive analysis beyond AUROC in studies focusing on DL-based biomarker detection. Citation Format: Marco Gustav, Marko van Treeck, Zunamys I. Carrero, Chiara M. Loeffler, Nic G. Reitsam, Bruno Märkl, Asier Rabasco Meneghetti, Lisa A. Boardman, Amy J. French, Ellen L. Goode, Andrea Gsur, Stefanie Brezina, Marc J. Gunter, Neil Murphy, Paul Limburg, Stephen Thibodeau, Sebastian Foersch, Robert Steinfelder, Tabitha Harrison, Ulrike Peters, Amanda Phipps, Jakob N. Kather. Assessing microsatellite instability dominance in colorectal cancer phenotype: A multi-study initiative using multi-target transformers for genomic biomarker prediction [abstract]. In: Proceedings of the American Association for Cancer Research Annual Meeting 2024; Part 1 (Regular Abstracts); 2024 Apr 5-10; San Diego, CA. Philadelphia (PA): AACR; Cancer Res 2024;84(6_Suppl):Abstract nr 4924.
Quantile-quantile plots of the genome-wide interaction scans for red meat and processed meat.
Abstract Tribal Health Organizations recognize the high rates of colorectal cancer (CRC) among Alaska Native peoples and are undertaking initiatives to address it. The tumor microenvironment (TME) is a complex ecosystem including tumor, stromal, and immune cells. Understanding the cell composition and spatial organization of the TME among Alaska Native patients with CRC will provide new insights into disease progression. We performed spatial profiling on 3 tissue microarrays (TMA) from 37 patients using the Akoya Biosciences’ s PhenoCycler system. Patients with CRC were selected from a nested case-control study which includes 16 patients who died of CRC and 21 patients who lived as long as patients with lethal CRC and matched on age at diagnosis, sex, tumor site and tumor stage. We designed a 40-antibody panel that captured tumor, epithelium, stromal, vascular, and immune cells, as well as cell functional states (e.g., PD1). Initial images were processed using QuPath for image stitching, artifact removal, background subtraction, cell segmentation, and measurement of average intensity of each marker per cell. Cell quality control (QC) was performed to filter out low quality cells based on cell size and log10-transformed sum of intensity. After quantile normalization and arcsinh transformation, cells that passed QC were clustered using the R package ‘Seurat’ and manually annotated based on the cell type and function marker intensities for each cluster. We identified 1.17 million cells and 15 cell types. Those cell types included 3 stromal and vascular cells, 1 epithelium, 1 mixed immune cluster, and 10 different immune cells. We quantified each cell type as a fraction of total cells on a per-patient basis. Among the subset of immune cells, the proportions of macrophages, CD4+T cells, and CD8+T cells were high (21%, 11.2%, and 14.5%, respectively), and the proportion of B cells was low (5.1%). We also identified regulatory T cells, cytotoxic CD8+T cells, and monocytes at 1-3%. We observed differences in the composition of cell clusters by CRC-specific death. The frequency of epithelium was higher among patients with lethal CRC, and the frequency of CD4+T cells and CD8+T cells were higher among patients without lethal CRC. In summary, the overall composition of tumor and immune cells varies between patients with and without CRC-specific death, indicating TME heterogeneity. Further investigation of spatial domains and relationships with clinical molecular features may facilitate discovery of novel predictors of CRC-specific death among Alaska Native peoples. We are clustering cell types into different cellular neighborhoods using spatial information and conducting statistical analysis integrating RNA sequencing data from the same patients. Further, we are generating spatial profiling data for an additional 5 TMAs comprising 60 additional patients and will present results of the combined data analyses. Citation Format: Hang Yin, Diana Redwood, Kimberly Smythe, Daniel Jones, McGarry Houghton, Kevin C. Barry, Amanda L. Koehne, Elizabeth Donato, Cecilia Yeung, Mingang Lin, James J. Tiesinga, Tabitha A. Harrison, Sushma S. Thomas, Li Hsu, Jane C. Figueiredo, Li Li, Timothy K. Thomas, Christopher Li, Ulrike Peters, Jeroen R. Huyghe. Spatial-resolved single-cell analysis of the tumor microenvironment in Alaska Native colorectal cancer patients [abstract]. In: Proceedings of the American Association for Cancer Research Annual Meeting 2024; Part 1 (Regular Abstracts); 2024 Apr 5-10; San Diego, CA. Philadelphia (PA): AACR; Cancer Res 2024;84(6_Suppl):Abstract nr 3423.
 Ulrike Peters合作论文数Department of Epidemiology, School of Public Health, University of Washington184
 Andrew Chan合作论文数Clinical and Translational Epidemiology Unit, Massachusetts General Hospital;Mass General Cancer Center, Massachusetts General Hospital154
 Polly Newcomb合作论文数Public Health Sciences Division, Fred Hutchinson Cancer Center144
 Li Hsu合作论文数Fred Hutchinson Canc Res Ctr, Div Publ Hlth Sci, 1124 Columbia St, Seattle, WA 98104 USA132
 Michael Hoffmeister合作论文数125
 Hermann Brenner合作论文数Division of Clinical Epidemiology and Aging Research, German Cancer Research Center, Heidelberg University113
 Jenny Chang-Claude合作论文数Division of Cancer Epidemiology, German Cancer Research Center111Martha L. Slattery合作论文数109
 Emily White合作论文数School of Public Health, University of Washington106
 Mark A. Jenkins合作论文数Centre for Epidemiology and Biostatistics, School of Population and Global Health, University of Melbourne105
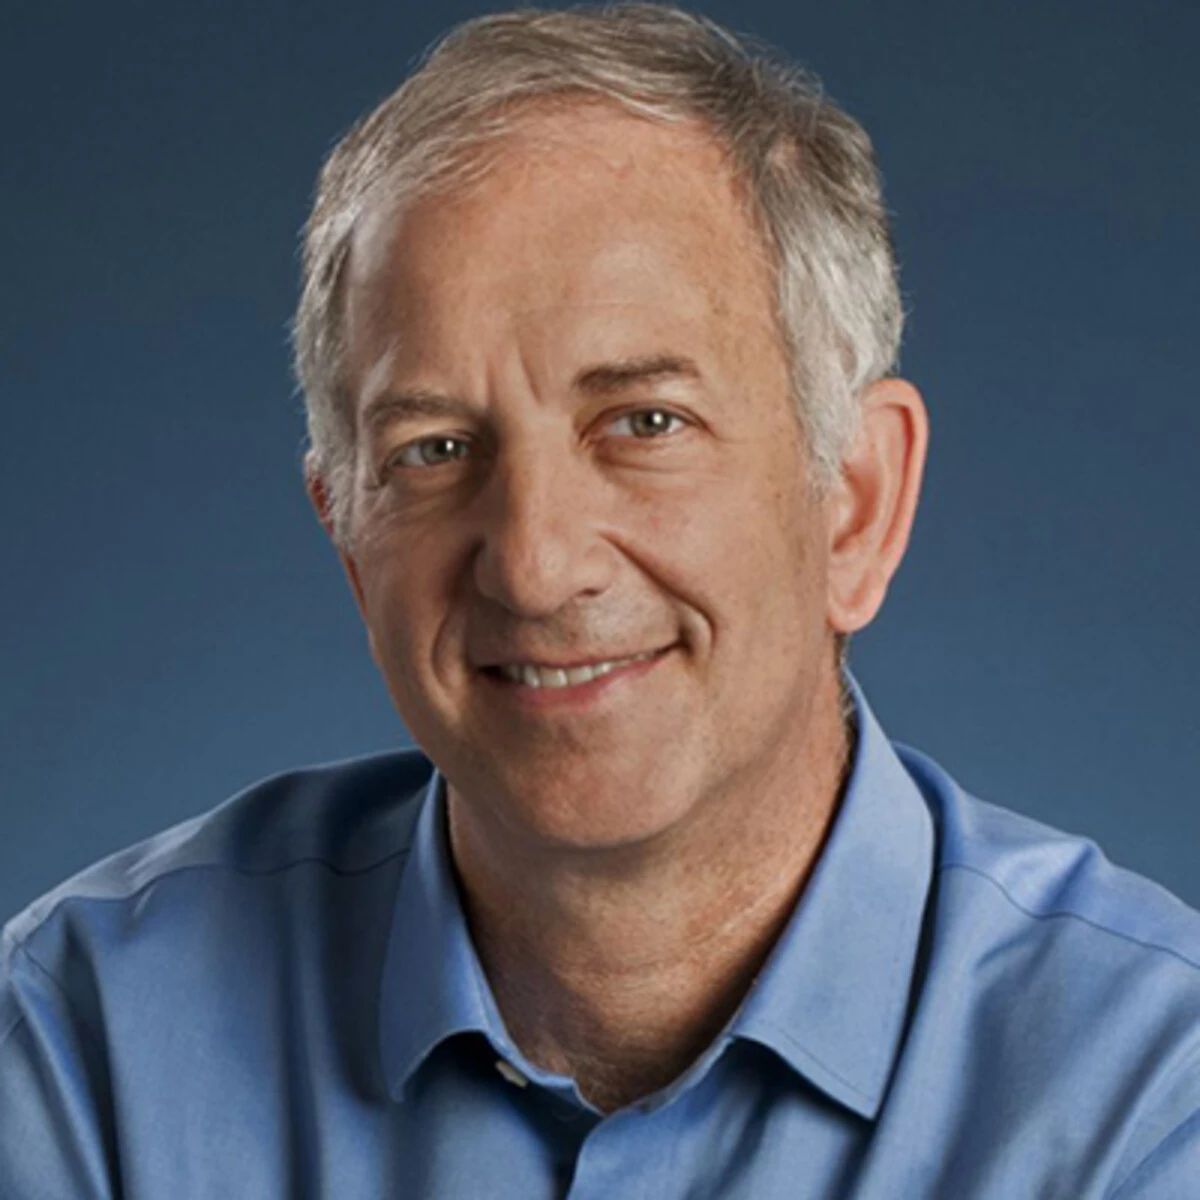 Steven Gallinger合作论文数Department of Surgery, Temerty Faculty of Medicine, University of Toronto105
 John Potter合作论文数Department of Epidemiology, School of Public Health, University of Washington98
 Le Marchand Loïc合作论文数University of Hawaiʻi Cancer Center;John A. Burns School of Medicine, University of Hawaiʻi at Mānoa94
 Sonja Berndt合作论文数Occupational and Environmental Epidemiology Branch, Division of Cancer Epidemiology & Genetics, National Cancer Institute, National Institutes of Health92
 Peter T. Campbell合作论文数Department of Epidemiology, American Cancer Society90
 Robert E. Schoen合作论文数Division of Gastroenterology, Hepatology and Nutrition, Department of Medicine, School of Medicine, University of Pittsburgh86Daniel D Buchanan合作论文数Department of General Practice, Melbourne Medical School, Faculty of Medicine, Dentistry and Health Sciences, The University of Melbourne82
 Jane C Figueiredo合作论文数Departamento de Engenharia Florestal;Instituto Superior de Agronomia;Institute da Conserva77Casey Graham合作论文数75
 Shuji Ogino (荻野周史)合作论文数Harvard Medical School, Harvard University;Department of Epidemiology, Harvard T.H. Chan School of Public Health, Harvard University;Brigham and Women's Hospital74
 Marc Gunter合作论文数International Agency For Research On Cancer, World Health Organization68Lin Yi合作论文数67Conghui Qu合作论文数Fred Hutchinson Canc Res Ctr, Div Publ Hlth Sci, 1124 Columbia St, Seattle, WA 98104 USA64
 Stephen Gruber合作论文数Center of Precision Medicine, Department of Medical Oncology & Therapeutics Research, City of Hope National Medical Center;Division of Molecular Pharmacology, Department of Medical Oncology & Therapeutics Research, City of Hope National Medical Center64
 Victor Moreno合作论文数58
 John Hopper合作论文数Centre for Epidemiology and Biostatistics, School of Population Global Health, The University of Melbourne56
 Jeroen R Huyghe合作论文数Fred Hutchinson Canc Res Ctr, Div Publ Hlth Sci, 1124 Columbia St, Seattle, WA 98104 USA55
 Cornelia Ulrich合作论文数School of Medicine, University of Utah;Department of Population Health Sciences, University of Utah;Department of Pathology, University of Utah55
 Richard B. Hayes合作论文数Department of Population Health, Grossman School of Medicine, New York University55
 Amanda I. Phipps合作论文数Department of Epidemiology, School of Public Health, University of Washington54
 Stephen N. Thibodeau合作论文数Laboratory Medicine and Pathology, Mayo Clinic52
 Bethany Van Guelpen合作论文数Dept Radiat Sci, Umea Univ50
 Michael O Woods合作论文数Mem Univ Newfoundland, Discipline Genet, St John, NF, Canada47
 Stéphane Bézieau合作论文数Service de Génétique Médicale, Centre Hospitalier Universitaire de Nantes46
 Graham Giles合作论文数Cancer Epidemiology Division, Cancer Council Victoria45Murphy Neil合作论文数Sect Nutr & Metab, Int Agcy Res Canc44
 Andrea Gsur合作论文数44
 David Duggan合作论文数Translat Genom Res Inst43
 Thomas J. Hudson合作论文数AbbVie43
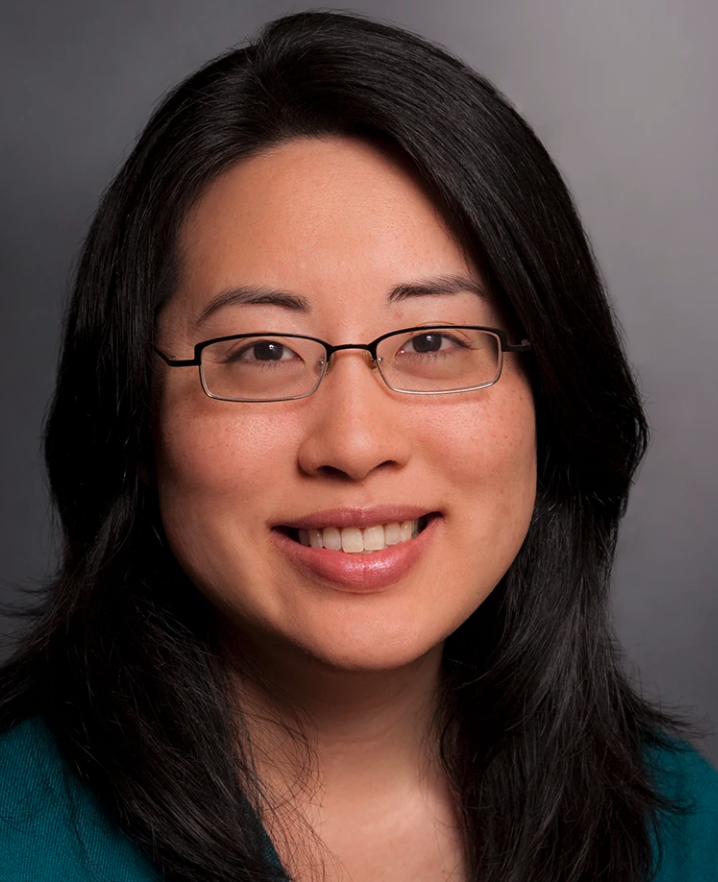 Lori C. Sakoda合作论文数Division of Public Health Sciences, Fred Hutchinson Cancer Research Center;Division of Research, Kaiser Permanente Northern California;Kaiser Permanente Bernard J. Tyson School of Medicine43
 Bette J. Caan合作论文数Division of Research, Kaiser Permanente Northern California42
 Mingyang Song合作论文数Harvard T.H. Chan School of Public Health, Harvard University40
 Edward Giovannucci合作论文数Department of Epidemiology, Harvard T.H. Chan School of Public Health, Harvard University;Department of Nutrition, Harvard T.H. Chan School of Public Health, Harvard University40
 Stephen J. Chanock合作论文数Division of Cancer Epidemiology & Genetics, National Cancer Institute, National Institutes of Health39
 Stephanie Bien (Rosse)合作论文数37
 Charles S. Fuchs合作论文数Genentech and Roche;EvolveImmune Therapeutics36Mathieu Lemire合作论文数36Yu-Ru Su合作论文数35
 Syed Zaidi合作论文数University of Pittsburgh Medical Center Stroke Institute35




