Supplementary Table S7. Confounding analyses for the association between the interaction of the TGF-B-Polygenic Risk Score and red meat intake in relation to colorectal cancer risk.
Supplementary Figure S3 shows participant selection flowchart for adenoma analysis. Flow diagram illustrating inclusion and exclusion of participants in the Nurses’ Health Study II to define the analytic cohort for colorectal adenoma analyses.
Supplementary Table S9 shows sensitivity analyses of colorectal cancer precursors risk with alternative dietary adjustment using red and processed meat intake.
Supplementary Table S11 shows sensitivity analyses of cumulative history of depression and risk of colorectal cancer precursors.
Supplementary Table S17 shows sensitivity analyses of depression defined by depressive symptoms (MHI-5 score or physician-diagnosed depression) in relation to colorectal cancer precursors.
Supplementary Table S7 shows sensitivity analysis of depression and colorectal cancer precursors excluding potential mediators (BMI, diet, physical activity, sedentary behavior, smoking, and alcohol).
Mendelian randomization can reveal the etiological association between body mass index (BMI) and lung cancer. However, the associations between the trajectories of BMI and the risk of lung cancer remain inconclusive. We employed growth mixture modeling to identify trajectories of pre-diagnostic BMI in 163 545 individuals (117 445 women from the Nurses' Health Study and 46 100 men from the Health Professionals Follow-Up Study). We assessed the associations between BMI trajectories and lung cancer risk, as well as the effects within subgroups. Four trajectories were identified: normal-moderate increasing (class 1), overweight-marked increasing (class 2), overweight-obese turning (class 3), and obese-persistent (class 4). We observed a decreased risk of lung cancer in class 2 (adjusted hazard ratio [aHR], 0.53; 95% CI, 0.38-0.75; P = 2.32 ×10⁻⁴) and class 3 (aHR, 0.67; 95% CI, 0.48-0.94; P = .022). In stratification analysis, we observed that the effects of class 4 on lung cancer risk vary among histological subtypes. Additionally, within the class 1 population, the top quintile of BMI also demonstrated different effects among histological subtypes. Increasing lifetime BMI was associated with a decreased risk of lung cancer, with this association varying by histological subtypes, indicating histology-specific mechanisms in lung carcinogenesis.
Supplementary Figure S9. The combined T-cell status of precursor and carcinoma tissue categories in relation to anatomic location. (A-B) CD3+CD4+ and CD3+CD8+ T-cell densities in overall tissue regions stratified by anatomic location. (C-D) CD3+CD4+FOXP3+ and CD3+CD8+FOXP3+ T-cell densities in overall tissue regions stratified by anatomic location. P values were calculated with the Mann-Whitney U test (Wilcoxon rank-sum test) as compared to colorectal normal mucosa near precursor lesions (Normal mucosa) and carcinoma with proficient mismatch repair (pMMR). ***: P <0.0005, **: P <0.005, *: P <0.05. Abbreviations: CA, colorectal invasive carcinoma; dMMR, deficient mismatch repair; Non-serrated, non-serrated adenomas, Normal, colorectal normal mucosa near the precursor lesions; pMMR, proficient mismatch repair; Serrated without SSL, serrated lesions including hyperplastic polyp and traditional serrated adenoma; SSL, sessile serrated lesions.
Supplementary Table S3. Weights used for polygenic risk score estimation and coordinates from single nucleotide polymorphisms considered in the study.
Supplementary Table S12 shows sensitivity analysis of antidepressant use and colorectal cancer.
Supplementary Table S8 shows sensitivity analyses of colorectal cancer risk with alternative dietary adjustment using red and processed meat intake.
Antibodies and Staining Conditions for Multiplex Identification of T-cell Subsets and Epithelial Cells
OBJECTIVE:The purpose of this study was to estimate the lifetime risk of alcohol-attributable mortality and morbidity in the United States based on a person's average lifetime weekly alcohol consumption to assess the impact of per-occasion alcohol consumption on health. METHOD:Lifetime risks were estimated using a cause-specific modeling approach that combined exposure data from national health surveys, relative risks, population data from the U.S. Census Bureau, mortality data from the Centers for Disease Control and Prevention, and morbidity data from the Institute for Health Metrics and Evaluation. A narrative review assessed the health impact of per-occasion alcohol consumption on health. RESULTS:At low levels of consumption, no protective net effect of alcohol consumption on health was observed. Elevated mortality and morbidity risks were associated with alcohol consumption starting at relatively low levels. Males consuming >6.5 (95% CI [<1, 13.5]) and females consuming >7.0 (95% CI [<1, 11.5]) drinks per week had life-time alcohol-attributable mortality risks >1:1,000. At >8.5 (95% CI [2.5, 13]) drinks per week for both males and females, these risks increased to >1:100. At 14 drinks per week for males (the upper limit of the former Dietary Guidelines for males), the risk of an alcohol-caused death was 1:25 (4%). Drinking patterns also impacted risk. Above 1 drink per occasion, higher consumption was associated with progressively increased risks of breast cancer, cardiovascular disease, and injury. CONCLUSIONS:Alcohol consumption, including at what may be perceived as "moderate" levels, is associated with increased mortality and morbidity risks. These results support tightening alcohol use guidance in the United States, for both males and females, to no more than 1 drink per day.
 Andrew Chan合作论文数Clinical and Translational Epidemiology Unit, Massachusetts General Hospital;Mass General Cancer Center, Massachusetts General Hospital433
 Edward Giovannucci合作论文数Department of Epidemiology, Harvard T.H. Chan School of Public Health, Harvard University;Department of Nutrition, Harvard T.H. Chan School of Public Health, Harvard University352
 Shuji Ogino (荻野周史)合作论文数Harvard Medical School, Harvard University;Department of Epidemiology, Harvard T.H. Chan School of Public Health, Harvard University;Brigham and Women's Hospital316
 Kana Wu合作论文数Department of Nutrition, Harvard T.H. Chan School of Public Health, Harvard University221
 Charles S. Fuchs合作论文数Genentech and Roche;EvolveImmune Therapeutics169
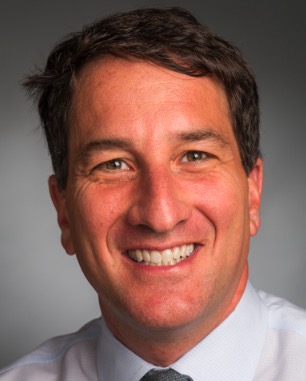 Jeffrey A. Meyerhardt合作论文数Colon and Rectal Cancer Center, Dana-Farber Cancer Institute;Harvard Medical School142
 Marios Giannakis合作论文数133Yin Cao合作论文数121
 Xuehong Zhang (张学宏)合作论文数Channing Division of Network Medicine, Brigham And Women's Hospital;Harvard Medical School, Harvard University;Dana-Farber / Harvard Cancer Center111
 Jonathan Nowak合作论文数Harvard Medical School, Harvard University;Hale Family Center For Pancreatic Cancer Research, Dana-Farber Cancer Institute;Department Of Pathology, Brigham And Women’s Hospital;Department Of Pathology, Dana-Farber Cancer Institute106
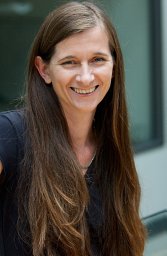 Ulrike Peters合作论文数Department of Epidemiology, School of Public Health, University of Washington99
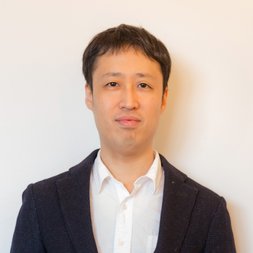 Tomotaka Ugai合作论文数Department of Epidemiology, Harvard T.H. Chan School of Public Health, Harvard University;Harvard Medical School;Pathology-Brigham and Women's Hospital, Harvard Medical School81Wen-jie Ma合作论文数West China Hospital, Sichuan University80
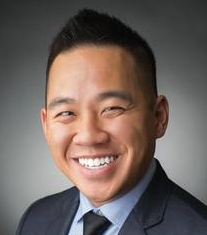 Long H. Nguyen合作论文数Harvard Medical School;Massachusetts General Hospital78
 Li Hsu合作论文数Fred Hutchinson Canc Res Ctr, Div Publ Hlth Sci, 1124 Columbia St, Seattle, WA 98104 USA73
 Kai Wang (王凯)合作论文数Department of Epidemiology, Harvard T.H. Chan School of Public Health72Reiko Nishihara合作论文数70
 David A. Drew合作论文数Clinical & Translational Epidemiology Unit, Massachusetts General Hospital;Division of Gastroenterology, Harvard Medical School70
 Walter C. Willett合作论文数Department of Epidemiology, Harvard T.H. Chan School of Public Health, Harvard University;Thich Nhat Hanh Center for Mindfulness in Public Health, Harvard T.H. Chan School of Public Health, Harvard University;Department of Nutrition, Harvard T.H. Chan School of Public Health, Harvard University69
 Curtis Huttenhower合作论文数Department of Biostatistics, Harvard T.H. Chan School of Public Health, Harvard University;Department of Immunology and Infectious Diseases, Harvard T.H. Chan School of Public Health, Harvard University68
 Hermann Brenner合作论文数Division of Clinical Epidemiology and Aging Research, German Cancer Research Center, Heidelberg University67
 Molin Wang合作论文数Department of Biostatistics, Harvard T.H. Chan School of Public Health, Harvard University;Department of Epidemiology, Harvard T.H. Chan School of Public Health, Harvard University;Department of Medicine, Brigham and Women’s Hospital65
 Le Marchand Loïc合作论文数University of Hawaiʻi Cancer Center;John A. Burns School of Medicine, University of Hawaiʻi at Mānoa63
 Amit D Joshi合作论文数61
 Victor Moreno合作论文数61
 Koichiro Haruki合作论文数Institute of DNA Medicine, Jikei University School of Medicine61
 Wendy Garrett合作论文数Department of Immunology and Infectious Diseases, Harvard T.H. Chan School of Public Health, Harvard University;Department of Molecular Metabolism, Harvard T.H. Chan School of Public Health, Harvard University59
 Peter T. Campbell合作论文数Department of Epidemiology, American Cancer Society58
 Mark A. Jenkins合作论文数Centre for Epidemiology and Biostatistics, School of Population and Global Health, University of Melbourne56
 Jenny Chang-Claude合作论文数Division of Cancer Epidemiology, German Cancer Research Center56
 Mehta Raaj S合作论文数Division of Gastroenterology, Massachusetts General Hospital;Division of Gastroenterology, Massachusetts General Hospital53Michael Hoffmeister合作论文数51Conghui Qu合作论文数Fred Hutchinson Canc Res Ctr, Div Publ Hlth Sci, 1124 Columbia St, Seattle, WA 98104 USA50
 Steven Gallinger合作论文数Department of Surgery, Temerty Faculty of Medicine, University of Toronto48Eliassen A Heather合作论文数47
 Polly Newcomb合作论文数Public Health Sciences Division, Fred Hutchinson Cancer Center47
 Alicja Wolk合作论文数Institute of Environmental Medicine, Karolinska Institutet46
 Jane C Figueiredo合作论文数Departamento de Engenharia Florestal;Instituto Superior de Agronomia;Institute da Conserva46
 Kosuke Mima合作论文数45Qian Zhi Rong合作论文数44
 Dong Hang (杭栋)合作论文数Department of Epidemiology, School of Public Health, Nanjing Medical University43
 Lori C. Sakoda合作论文数Division of Public Health Sciences, Fred Hutchinson Cancer Research Center;Division of Research, Kaiser Permanente Northern California;Kaiser Permanente Bernard J. Tyson School of Medicine43
 Bethany Van Guelpen合作论文数Dept Radiat Sci, Umea Univ42
 Gad Rennert合作论文数Department of Community Medicine and Epidemiology, Carmel Medical Center;Ruth and Bruce Rappaport Faculty of Medicine, Technion - Israel Institute of Technology42
 Temitope O Keku合作论文数42
 Marc Gunter合作论文数International Agency For Research On Cancer, World Health Organization42Fränzel J B van Duijnhoven合作论文数Wageningen Univ & Res, Div Human Nutr & Hlth, Wageningen, Netherlands41Lin Yi合作论文数41
 Tsuyoshi Hamada合作论文数41




