According to the development velocity, the ratio of food industry output value and the output value of agriculture, and per capita GDP index, this article divides the development of China's food industry into four stages for the first time, which are slowly growth stage, awakening development stage, rapid growth stage, and medium-rapid growth stage. Moreover, article systematically analyzes the development characteristics and achievements of each stage. According to China's food industry development history, present situation and the developing trend, article gives out the judgment of the transition of food industry from the high-speed growth stage to medium-speed growth stage, also gives the prospects for the food industry development based on development goals, supply and consumption, scientific and technological innovation, new enterprise formats, and industrial structure. Furthermore, suggestions are given for future development of China's food industry from different aspects of developing mode, developing directions, and developing pathways.
In order to quantify the differences, correlation and use conditions between different forms of water use efficiency evaluation indi-ces, this paper calculates water use efficiency under 5 different definitions by DSSAT-CERES-Wheat model simulation, including five com-monly used evaluation indices, namely farmland total water use efficiency( WUEg), generalized water resources use efficiency(WUEu), crop water productivity (WP), irrigation water use efficiency (WUEi) and real irrigation water use efficiency(WUEti). The research con-cludes that:①The evaluation results of WUEu and WUEg are consistent among the interannual, site level and regional level. ② WUEi can't represent the real irrigation water use efficiency, but WUEi represents the total water use efficiency in Huang huaihai area. ③WUEti is hard to calculate and inconvenient to use on site level and regional level. ④Pearson's correlation coefficient ( R) is different among variety water use efficiency indices on site level, but in a good positive correlation on regional level. The conclusion is that there are differences among the evaluation results of variety water use efficiency indices on site level and regional level. The evaluation results of WP are the most stable on site level and WUEg on regional level.
With globe climate changing, the intensifying uncertainty of precipitation induced inconsistency of irrigation schedule in different years and at different growth stages of crops. Therefore, conventional irrigation schedule fails to guide irrigation activities precisely. It becomes increasingly important for irrigation management and sustainable development of agriculture to explore changes of agricultural irrigation requirement against the background of frequently extreme meteorology events. In this paper, meteorological data of the recent 63 years (from 1951 to 2013) and soil data in Xinxiang City of northern Henan, as well as crop growth parameters were used to establish the model of drought irrigation index according to the relationships among precipitation, irrigation, evapotranspiration (ETC) and available soil water. In the model, drought irrigation index (DII) was [-1, 1]. Once DII was less than 0, irrigation was necessary. On the basis of winter wheat-summer maize planting schedule in the study area, the model was used to calculate multi-year DIIs for the recent 63 years. Consequently, annual irrigation times potentially meeting the agricultural requirement were obtained based on DIIs from 1951 to 2013. Three representative growing seasons of winter wheat and summer maize were selected as wet (1985-1986 for winter wheat, 2003 for summer maize), normal (2004-2005 for winter wheat, 1993 for summer maize) and dry (1983-1984 for winter wheat, 2009 for summer maize) growing seasons. Water requirement of two crops in different growing seasons were calculated, and DIIs in there representative growing seasons of winter wheat and summer maize were calculated too under the conditions with and without irrigation. The results showed that required annual irrigation times ranged from 2 to 7 with an average of 5.1 in recently 63 years in norther Henan Province. ETC of winter wheat and summer maize in wet, normal, dry growing seasons were 489.4 mm, 551.4 mm, 481.7 mm and 466.1 mm, 477.8 mm, 529.3 mm, respectively. Under the condition without irrigation, the winter wheat and summer maize suffered varying degrees of drought in typical growing seasons. Winter wheat respectively needed 2, 3, and 4 times irrigation, while summer maize respectively needed 1, 2 and 3 times irrigation in wet, normal and dry actual representative growing seasons. Even if in wet growth seasons of summer maize, irrigation also required during periods with high ETC but no timely rainfall. DII could guide irrigation well according to the relationship among meteorology, available soil water and crop growth information. It was practicable to decide irrigation time with DII. With climate changing from 2003 to 2013, the frequency of irrigation times fluctuated more remarkable, and interannual drought stress took place more frequently than the past 63 years. Scientific and reasonable irrigation managements should be worked out in order to reduce the influence of drought stress on crop growth.
To properly assess irrigation water use efficiency, the definite and comparable indicators are urgently needed. Many evaluation indexes of irrigation water use efficiency are used, which often cause confusion. In order to quantify their differences, correlation, influence factors and application conditions, a comparative study was carried out in this paper. The winter wheat, the most important staple crop in China, was chosen as an example. The Decision support system for agrotechnolgy transfer (DSSAT) CERES-Wheat model, which was driven by daily weather data, soil data and crop management data, was applied to construct two scenarios, namely, irrigated and rainfed of winter wheat in Xinxiang area of Henan province, using data from 1963 to 2013. And the rainfed yield, rainfall of the growth period, required irrigation water, evaporation, irrigation yield in irrigation situation were simulated by DSSAT- CERES-Wheat model. Thus, five evaluation indexes of irrigation water use efficiency, namely, farmland total water use efficiency(WUEg), generalized water resources use efficiency(WUEu), irrigation water use efficiency(WUEi) and crop water productivity(WP) in irrigation situation, real irrigation water use efficiency(WUEti) by rainfed and irrigation situation synthetically, were obtained. The results showed that WUEg and WUEu, WUEgand WP, and WUEuand WP had strong positive linear correlation, and correlation coefficients were all greater than 0.8. WUEi and WUEti were negatively correlated. The average value of WUEg, WUEu and WP for winter wheat in Xinxiang area during 1963-2013 were 1.43, 1.48 and 1.63 kg/m3, respectively. Three results had the consistent change trend, and were on the rise over time. The value of WUEi was larger than WUEti. The mean values of two indicators were 2.46 and 1.49 kg/m3, respectively. And the change of interannual evaluation value for the two indexes was inconsistent. Rainfall of growth period had influence on these indexes. WUEg and WP had a downward trend with the increase of rainfall, and the two indexes remained consistent. With the increase of rainfall in growth period, WUEishowed a trend of increase while WUEti only fluctuated, and the differences between these two indexes increased significantly. The application of WUEi was confined to the influence of rainfall. Compared to WUEi, WUEti had more reasonable definition, but the increased yield in irrigation situation, in contrast to rainfed situation, was difficultly acquired. So WUEiand WUEti are not practical for irrigation water use efficiency evaluation. The values of WUEg and WUEuwere both about 1.45 under different hydrological years. For all the five indexes, there was no significant change in different hydrological year. These conclusions provide information for evaluation of agricultural water resource.
四川木蓝复合群(Indigofera szechuensis complex)为豆科木蓝属植物,共包含四川木蓝等9个种.本研究以四川木蓝复合群9个种的31个居群为材料进行形态特征变异及其ITS序列分析,结果表明:四川木蓝复合群9个种的形态性状差异主要集中在叶片大小及花序长短上;主成分分析显示,最大叶长、叶片毛被、花药毛被、小叶长宽比是种间主要形态特征差异;ITS序列分析显示,除滇木蓝外,四川木蓝复合群其余8个种的ITS序列差异较小且难以区分,因此四川木蓝复合群的这8个种可能是一个正处于分化过程中的类群,横断山区多样化的生境及复杂的地质历史可能是促使其分化的主要原因.
The experiment on the effect of amounts of top-dressing fertilizer on growth,yield,quality and photosynthesis of watermelon grown in eco-organic type soilless culture was carried out.The results indicated that the amounts of top-dressing fertilizer had remarkable effects in the middle and late stage of watermelon growth,and the most remarkable effects occurred in the treatment with top-dressing fertilizer of 60 g per plant.
The increasing soil salinization limited the growth of plant, resulted in the yield and quality decline. In order to increase crop yield under salt stress, it was very important to improve plant salt resistance. Some measures of improving plant salt resistance were reviewed in this article, which included the breeding of salt resistant varieties, the utilizing of calcium or microelements, Plant Salt Resistor and plant hormones and other measures including using organic manure, reasonable irrigation and plastic mulching in the expectation of offering technical guidance for the plant cultivation under salt stress.
本文从植物形态发育、质膜透性、光合和呼吸作用以及能量代谢等方面概述了盐胁迫下植物的生理生化反应,分析了盐害条件下离子胁迫和渗透胁迫作用机理以及植物的耐盐机制:植物小分子物质的积累、离子摄入和区域化、基因表达和大分子蛋白质的合成等,并简要综述了植物抗盐的分子生物学研究进展.
The effect of selenium (Se) on the biomass, root/shoot ratio and stem diameter of lettuce at different growth stage under different salt concentrations was studied in pot experiment with substrates .The results showed that the biomass, root/shoot ratio and stem diameter of lettuce were significantly reduced under salt stress. The salt stress on lettuce was reliefed to some extent through adding Se to different salt concentrations, adding Se increased biomass and stem diameter of lettuce. The root/shoot ratio increased in the treatment of Se adding to all the salt stress in the early and middle growth period of lettuce, it decreased in the treatment of selenium adding to high salt stress except the treatment of adding 1.5 mg/kg selenium in the late growth period.
 Hongjun Yu (余宏军)合作论文数Institute of Vegetables and Flowers, Chinese Academy of Agricultural Sciences4
 Weijie Jiang (蒋卫杰)合作论文数Institute of Vegetable and Flower, Chinese Academy of Agricultural Sciences4
 Xiuqiao Huang (黄修桥)合作论文数Institute of Farmland Irrigation of CAAS;School of Water Conservancy, North China University of Water Resources and Electric Power3
 Min Wei (魏珉)合作论文数College of Horticultural Science and Engineering, Shandong Agricultural University3
 Xiulu Sun (孙秀路)合作论文数2
 LinKe Wu (吴林科)合作论文数2Xue-Li Zhao合作论文数1Xinxin Zhang (张辛欣)合作论文数1FENG Li-bo (冯利波)合作论文数1Shuai Tian (田帅)合作论文数1FuYi Duan (段福义)合作论文数1YanHui Jia (贾艳辉)合作论文数1
 Jinshan Li (李金山)合作论文数Institute of Farmland Irrigation of Chinese Academy of Agricultural Sciences1
 Jinglei Wang (王景雷)合作论文数Institute of Farmland Irrigation, Chinese Academy of Agricultural Sciences1
 Dequan Zhang (张德权)合作论文数Institute of Food Science and Technology, Chinese Academy of Agricultural Sciences1
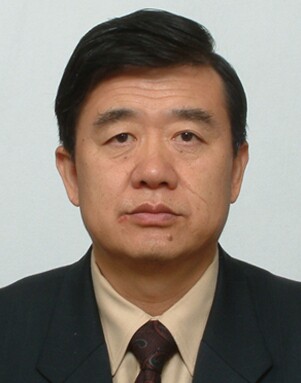 Hong Zhang (张泓)合作论文数Institute of Food Science and Technology, Chinese Academy of Agricultural Sciences1Zhe Meng (孟哲)合作论文数1
 Xiaofeng Dai (戴小枫)合作论文数Training Center of Chinese Academy of Agricultural Sciences;College of Food Science and Technology, Northwest University1Qibiao Han (韩启彪)合作论文数1
 Xinfen Gao (高信芬)合作论文数Chengdu Institute of Biology, Chinese Academy of Sciences;University of Chinese Academy of Sciences1




