The internal ice layers and ice-bedrock interfaces are critical indicators for understanding ice sheet evolution, englacial dynamics, and climate change impacts. Ice-penetrating radar (IPR) delivers high-resolution imaging of the englacial structures; however, low contrast of internal ice layers and ambiguous layer boundaries in IPR profiles challenge the concurrent extraction of these features. Traditional amplitude-based methods often struggle to efficiently process large-scale profiles or maintain accuracy under complex stratigraphic conditions. Therefore, we propose a U-Net-based pipeline that integrates IPR instantaneous phase analysis to simultaneously extract ice layers and ice-bedrock interfaces from the IPR data at Dome A, Antarctica. To enhance performance, a discriminator first classifies IPR profiles based on layer roughness differences. To address the scarcity of annotated data, we design a synthetic data generation method using morphological profile analysis and introduce an innovative post-processing operation to enhance the continuity of the extracted layers. Compared with existing methods widely used in layer extraction, such as U2-Net and DeeplabV3+, our results not only maintain high accuracy in identifying deep ice-bedrock interfaces but also improve the detection of low-contrast internal ice layers. The proposed method establishes an IPR-attribute-driven system for the automatic processing of IPR data, improving the interpretation accuracy of complex englacial environments by calibrating with ice core records, and provides a tentative technical reference for analyzing the ice flow patterns of the Antarctic Ice Sheet.
Geophysical investigations were conducted utilizing Electrical Resistivity Tomography (ERT) and Ground Penetrating Radar (GPR) to assess a Non-Aqueous Phase Liquid (NAPL) contaminated site in the southeast of China. Traditional drilling and sampling methods combined with geochemical analysis are limited in deriving reliable spatial interpolations due to low sampling density and high heterogeneity of shallow groundwater. Variations in soil physical properties, such as conductivity and dielectric properties, resulting from NAPL infiltration, provide the physical basis for geophysical detection. While the combined use of ERT and GPR is established in geophysics, its effective application to NAPL sites remains challenging due to complex site conditions and ambiguous signatures. Our ERT results reveal high resistivity anomalies potentially indicative of NAPL contamination, and overlaying GPR attribute analysis (including amplitude, phase, coherence, and texture) onto these results enhances subsurface characterization and anomaly discrimination. The integrated approach demonstrates its capability to clarify subsurface contamination patterns under heterogeneous conditions, providing a spatially continuous interpretation framework that complements sparse direct sampling.
This study was conducted to determine potential groundwater storage areas in the semi-arid Oltu Basin in northeastern Turkey. The groundwater potential of the basin was analyzed by evaluating eight geographical factors: lithology, linear density, soil depth, land use, precipitation, geomorphology, slope, and drainage density. These factors were classified and weighted using remote sensing, geographical information systems (GIS), and the analytic hierarchy process (AHP). The obtained data were modeled using ArcGIS software, and a potential groundwater storage map of the Oltu Basin was created. The results show that there is a high groundwater potential in areas of the basin close to the stream bed, while the groundwater potential is low in mountainous and steeply sloped regions. The study provides significant findings for sustainable water resource management in the region and future water resources planning.
AbstractGeophysical methods can efficiently identify and map archaeological features or changes in the matrix of a site. They have been extensively used in Chinese archaeological prospection since the survey for the Mausoleum of the Emperor Wanli of Ming Dynasty in mid-1950s. The evolution of archaeo-geophysics in China is closely linked to advances in emerging geophysical technology, the needs of non-destructive detection from the archaeological community and Chinese fast-growing economy. Throughout the past 70 years, researchers and practitioners witnessed the rapid development of geophysics in the field of Chinese Archaeology. In this chapter, we introduce some key archaeo-geophysical events, for example, a multi-geophysical project was performed by China Geological Survey (CGS), to evaluate the applicability and the effectiveness for archaeological characterisation at the Mausoleum of Qinshihuang, i.e. the first Emperor of the Qin Dynasty, during 2002 and 2003, the scale of which has been the largest in Chinese archaeo-geophysics so far. Besides, we divide these events into four periods, i.e. embryonic stage (1950s–1980), initial stage (1980–2000), development stage (2000–2010), and internationalisation stage (2010–present). Moreover, we also provide some significant case studies, namely ancient city sites and ancillary building remains, ancient tombs, cultural heritage protection, urban underground remains, and underwater archaeology. In a word, the development has paved the way to regular use of geophysical methods in almost all types of potential archaeological interests in China.
Ground-penetrating radar (GPR) is one of the powerful tools to reveal the subsurface structure of planetary bodies and has obtained great success in planetary exploration. Permittivity estimation with radar data can provide the geometric and physical parameters of near-surface materials of planetary bodies. In this study, we propose to use the adaptive genetic algorithm (AGA), which can prevent the result from converging to local minima and not subject to the initial model setting, to improve the reliability and efficiency of the estimation of the permittivity with the GPR data. Based on the convolution forward model and simulation data, the inversion method with AGA has demonstrated an excellent performance on curve fitting. The statistical probability of the estimation result proves that the AGA, compared with the standard genetic algorithm (SGA), has the ability of sustainable evolution and well convergence in the high dimension problem. In the simulation experiments, the mean value of the 95% confidence interval of the permittivity inversion results narrowed from 8.4 to 2.6. Next, we used AGA to GPR experimental data collected in the lava tube field on the Earth and successfully detected the low permittivity characteristics within the lava tubes. This result can provide a workable inversion method for finding lava tubes and other unknown subsurface features in future planetary exploration, especially lack of background information in planetary or polar exploration.
Road collapse has always been an important safety hazard for urban traffic, causing a serious threat to the safety of passing vehicles and citizens. However, the complex urban surface environment with obstacles such as huge buildings, hardened roads, and river network limits the application of ERT in cities. Here we present an innovative cross-street electrical resistivity imaging method. This method abandons the mandatory electrode grid layout that conventional 3D ERT required. Only two survey lines are required to be laid along sides of the street parallelly, gathering the apparent resistivity data set by the combination of current supply and potential electrodes across the street and obtaining the 3D resistivity imaging under street. It is well suitable for detecting and monitoring of hardened road and enhances the feasibility and the adaptability of ERT in urban. A series of numerical models and comparisons among this method and conventional ERT had been done. The modeling results show that this cross-street method reaches the resolution of the conventional 5-lines ERT, and its resolution to objects cross road are better than the conventional ERT. This method can both satisfy the exploration needs with difficult surface conditions such as roads, and greatly reduce the exploration workload. It shows well application prospects, such as hidden geological problem monitoring while combining with time-lapse ERT instruments.
A full PDMS micro-droplet chip for 3D cell culture was prepared by using SLA light-curing 3D printing technology. This technology can quickly customize various chips required for experiments, saving time and capital costs for experiments. Moreover, an injection molding method was used to prepare the full PDMS chip, and the convex mold was prepared by light-curing 3D printing technology. Compared with the traditional preparation process of micro-droplet chips, the use of 3D printing technology to prepare micro-droplet chips can save manufacturing and time costs. The different ratios of PDMS substrate and cover sheet and the material for making the convex mold can improve the bonding strength and power of the micro-droplet chip. Use the prepared micro-droplet chip to carry out micro-droplet forming and manipulation experiments. Aimed to the performance of the full PDMS micro-droplet chip in biological culture was verified by using a solution such as chondrocyte suspension, and the control of the micro-droplet was achieved by controlling the flow rate of the dispersed phase and continuous phase. Experimental verification shows that the designed chip can meet the requirements of experiments, and it can be observed that the micro-droplets of sodium alginate and the calcium chloride solution are cross-linked into microspheres with three-dimensional (3D) structures. These microspheres are fixed on a biological scaffold made of calcium silicate and polyvinyl alcohol. Subsequently, the state of the cells after different time cultures was observed, and it was observed that the chondrocytes grew well in the microsphere droplets. The proposed method has fine control over the microenvironment and accurate droplet size manipulation provided by fluid flow compared to existing studies.
随着中国经济的快速发展和城市化进程的加快,有限的土地资源和城市发展之间的矛盾越来越突出,城市地下空间的安全、合理利用和地质环境保护具有重要的战略意义.为了解决G20、亚运会以及数字经济为杭州市快速发展带来的人口快速增长与土地资源有限的瓶颈问题,针对以杭州为代表的南方丘陵地区地下空间精细探测需求,开展了弹性波法、电法与电磁法等多种地球物理方法的可行性研究.结果 表明:不同勘探方法在探测深度、分辨率以及勘探效率上具有明显的差异性,需要根据地下地质状况以及地表条件选择合适的勘探方法进行探测,这对类似丘陵地区城市地下空间开发及利用具有指导意义和参考价值.
Within electrical resistivity tomography (ERT), the selection of arrays and electrode locations can effectively enhance the resolution of imaging. By properly selecting and optimizing the survey design, a better resolution will be obtained with fewer electrodes and configurations than traditional arrays. Previous work has demonstrated that the optimized survey design using the ‘Compare R’ method can provide better resolution than conventional arrays. This paper adds target-oriented selection and modified the original ‘Compare R’ method. The modified method first selects the target area in the comprehensive data sets, then optimizes the choice by the modified CR method, and finally combines the optimization results of multiple sets of target areas. For the target area, this method can select fewer electrodes and arrays than the original CR method, get better resolution than conventional arrays, and take less calculation time.
In urban areas, dense buildings, traffic road networks, and concrete floors severely restrict geoelectric methods, preventing the arrangement of ideal straight lines or grid survey layouts. We present herein an optimized three-dimensional (3D) electrical resistivity tomography (ERT) survey design based on arbitrarily distributed electrodes with a dipole–dipole array as the basic unit. Each unit is independent and can be randomly distributed and adjusted in length. The component electrodes can be used as current or potential electrodes as required. This method can eliminate the limitations of grids and cables. However, the random distribution of electrodes does not mean that there are no restrictions, as one must optimize the most suitable ones based on measurements showing data volumes that far exceed those of conventional survey designs. The compared target resolution by batch method is used as the optimized array. It focuses on the target area and filters out data before the Compare-R calculation is applied. This is faster than the traditional Compare-R algorithm due to its batch calculation. Furthermore, the frequency of electrodes was analyzed to reduce the number of electrodes used while maintaining good results. A field example with drilling information verification demonstrates the effectiveness of the method. We use the adjusted optimization method for the random distribution of electrodes in the exploration design, achieving good imaging results in combination.
One of the most widely used geophysical surveying techniques in the urban environment is the electrical resistivity tomography (ERT) method. However, traditional ERT can only utilize regular grid and equidistant electrode layouts. Furthermore, all electrodes must be connected by long cables, and the existence of obstacles in urban environments makes it challenging to implement such layouts. We therefore present an optimized 3D ERT survey design consisting of arbitrarily distributed electrodes. We use the dipole-dipole array as the data acquisition unit. Each unit is independent and can be randomly distributed and adjusted in length. The unit can be used as a current or potential electrode as required. In this way, the limitations of grids and cables can be eliminated. Arbitrary distribution does not mean doing whatever you want. Must follow the basic principles of the geoelectric method. Based on this, we have formulated a set of reasonable procedures in the survey design, including the ‘main-sub unit’ and the ‘effective measurement circle’, which make the surveying system run more quickly and accurately. We select a complex urban area with partial prior information as the field sample to verify our survey design. This approach can effectively avoid the disadvantages of the traditional ERT method and obtain correct and effective results in a complex urban environment.
遥感与地球物理考古探测数据类型多样,然而各种探测数据因缺少综合管理和分析平台,使综合分析更加困难,从而限制了考古探测技术应用效果.在了解遥感与地球物理考古探测技术的基础上,本文对当前遥感地球物理考古探测数据管理系统进行逻辑和业务需求分析,构建基于ArcGIS Engine开发引擎和Visual Studio 2017平台的遥感与地球物理考古探测数据综合管理系统.系统通过分层次设计功能模块,实现考古探测数据的编辑、解释、分析以及数据之间的交互和管理.实际应用表明,对于遥感地球物理考古探测技术与地理信息技术相结合的思路和研究,能够提升遥感与地球物理考古探测数据的综合分析能力,促进考古探测技术的有效应用.
The rheology and evolution of the polar ice sheet are deeply influenced by the anisotropy of ice crystals. Studying the anisotropy of ice crystals can help to well understand and predict the behavior of the polar ice sheet and then the sea level rising and global climate change. In this paper, firstly, we deduce the expression of eigenvalues and eigenvectors of anisotropic media, which are determined by permittivity tensor and geometry of media. Then, the analytic formulas of reflection and transmission coefficients are derived directly by matrix transformation. Some models with real ice parameters are tested, and they present some special features at the anisotropic interface. We also discuss the physical meanings of eigenvalues and eigenvectors and the geometry analyzing to polarimetric radar. This analytic solution reveals the functional relationship between the macroradar reflection and the microphysical properties of ice crystals, which provides a feasibility of ice fabric identification by polarimetric radar detection.
In recent decades, geoelectrical methods have played a very important role in near-surface investigation. The most widely used of these methods is electrical resistivity tomography (ERT). Regardless of the forward and inversion algorithms used, the original data collected from a survey is the most important factor for quality of the resulted model. However, 3D electrical resistivity survey design continues to be based on data sets recorded using one or more of the standard electrode arrays. There is a recognized need for the 3D survey design to get better resolution using fewer data. Choosing suitable data from the comprehensive data set is a great approach. By reasonable selecting, better resolution can be obtained with fewer electrodes and measurements than conventional arrays. Previous research has demonstrated that the optimized survey design using the 'Compare R' method can give a nice performance. This paper adds target-oriented selection and modified the original 'Compare R' method. The survey design should be focused on specific target areas, which need a priori information about the subsurface properties. We select electrodes and configurations as the target set by the comprehensive set firstly which meets the requirements of the target area. The number of measurements and electrodes is much less than the comprehensive set and the model resolution matrix takes less time to calculate. At the next step for rank, we calculate the sensitivity matrix of the target set only once and then calculate the contribution degree of each measurement separately from it. The time of iterative calculation of the resolution matrix when measurements set changing is less than the original method. The traditional method of evaluating RMS is not appropriate for comparing the quality of collected data by different survey designs. SSIM (structural similarity index) gives more reliable measures of image similarity better than the RMS. The curves of SSIM values in three dimensions and the average SSIM are given as quantitative comparisons. Besides, the frequency of electrodes utilized given to guides on selecting the highest used electrodes. Finally, the curves of the average relative resolution S and the number of electrodes as the number of measurements increase are given, which proves the method works effectively. The results show the significance of using target-oriented optimized survey design, as it selects fewer electrodes and arrays than the original CR method. Also, it produces better resolution than conventional arrays and takes less calculation time. 3D SSIM, frequency of electrodes used, the relationship between average relative resolution, number of electrodes and number of measurements, these quantitative comparison methods can effectively evaluate the data collected in various survey designs.
ABSTRACTRadio-echo sounding (RES) can be used to understand ice-sheet processes, englacial flow structures and bed properties, making it one of the most popular tools in glaciological exploration. However, RES data are often subject to ‘strip noise’, caused by internal instrument noise and interference, and/or external environmental interference, which can hamper measurement and interpretation. For example, strip noise can result in reduced power from the bed, affecting the quality of ice thickness measurements and the characterization of subglacial conditions. Here, we present a method for removing strip noise based on combined wavelet and two-dimensional (2-D) Fourier filtering. First, we implement discrete wavelet decomposition on RES data to obtain multi-scale wavelet components. Then, 2-D discrete Fourier transform (DFT) spectral analysis is performed on components containing the noise. In the Fourier domain, the 2-D DFT spectrum of strip noise keeps its linear features and can be removed with a ‘targeted masking’ operation. Finally, inverse wavelet transforms are performed on all wavelet components, including strip-removed components, to restore the data with enhanced fidelity. Model tests and field-data processing demonstrate the method removes strip noise well and, incidentally, can remove the strong first reflector from the ice surface, thus improving the general quality of radar data.
Remote photoplethysmography (rPPG) provides an approach of non-contact heart rate measurement, which can be used in natural light conditions to record human face video using an ordinary camera. However, this kind of experiment is currently sensitive to illumination, movement and skin color. In this paper, we introduce a simple and robust heart rate signal extraction method, by converting to CIELab color space as well as using a* channel to extract the original signal, rather than commonly used RGB space and g* channel. We utilized MAHNOB-HCI-TAGGING Database and self-built dataset to evaluate the results. Compared with g* channels, using a* channel in CIELab color space achieved higher accuracy, with the error rate reduced by 4.85%. The design has the characteristics of fast and convenient operation, with low cost and non-contact feature, that are suitable for a wider monitoring heart rate in daily life.
It is important to both monitor and predict the behaviors and evolutionary trends of ice sheets in rela-tion to future changes of climate and sea level. Geophysics has particular importance in scientific polar ex-ploration, and the unique advantages provided by airborne geophysical surveys make it an active and prom-ising field of research. China has become the fourth country with a polar airborne geophysical platform, and it has surveyed thousands of square kilometers area of Princess Elizabeth Land, East Antarctica. The objec-tive of this study was to undertake post-processing of GPS data, and to evaluate the accuracy of precise point positioning through comparison experiments. Based on the results of the experiments, we developed soft-ware for matching and linking GPS and geophysical data. Then, we summarized a workflow procedure for GPS data processing and we formulated a practical scheme for the post-processing of GPS data acquired during a polar airborne geophysical expedition. The findings of this study can be considered a guiding ref-erence for future related work.
Abstract Ice cores in Antarctica and Greenland reveal ice-crystal fabrics that can be softer under simple shear compared with isotropic ice. Owing to the sparseness of ice cores in regions away from the ice divide, we currently lack information about the spatial distribution of ice fabrics and its association with ice flow. Radio-wave reflections are influenced by ice-crystal alignments, allowing them to be tracked provided reflections are recorded simultaneously in orthogonal orientations (polarimetric measurements). Here, we image spatial variations in the thickness and extent of ice fabric across Dome A in East Antarctica, by interpreting polarimetric radar data. We identify four prominent fabric units, each several hundred metres thick, extending over hundreds of square kilometres. By tracing internal ice-sheet layering to the Vostok ice core, we are able to determine the approximate depth–age profile at Dome A. The fabric units correlate with glacial–interglacial cycles, most noticeably revealing crystal alignment contrasts between the Eemian and the glacial episodes before and after. The anisotropy within these fabric layers has a spatial pattern determined by ice flow over subglacial topography.
A sparse spike deconvolution method for GPR signals was put forward in order to improve the vertical resolution of ground penetrating radar (GPR) data and solve the noise-sensitive problem of traditional deconvolution technique. Firstly the wavelet was acquired by experiment. Then a constraint inversion method using the deterministic wavelet was carried out to obtain the dominating reflectivity series from signals. The signals of single channel, profiles, spectrums, etc. before and after the process were analyzed through two numerical simulation experiments, as well as a practical case. Results were compared with that of the traditional deconvolution. The analyzing and comparing results show that the method can improve the resolution very well and is less affected by noise, which can provide a better image of the target. Our method is proved to be an effective and feasible GPR signal processing technique.
 Gang Tian (田钢)合作论文数School of Earth Sciences, Zhejiang University31
 Wenke Zhao (赵文轲)合作论文数School of Earth Sciences, Zhejiang University11
 Zhanjie Shi (石战结)合作论文数School of Earth Sciences, Zhejiang University9
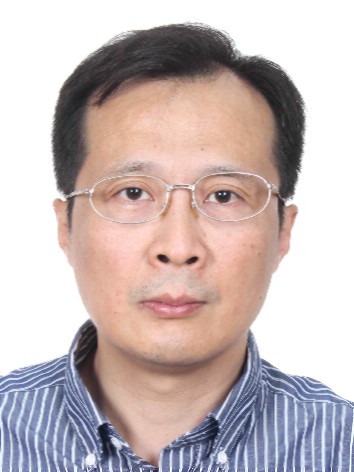 Bo Sun (孙波)合作论文数Institute of Soil Science, Chinese Academy of Sciences8
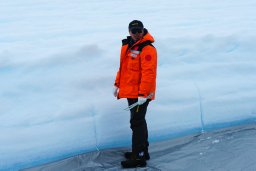 Cui Xiangbin合作论文数Department of Earth Science, Zhejiang University8
 Xiangpei Zhang (张向培)合作论文数6
 Lincheng Jiang合作论文数5Jinxin Lin (林金鑫)合作论文数5
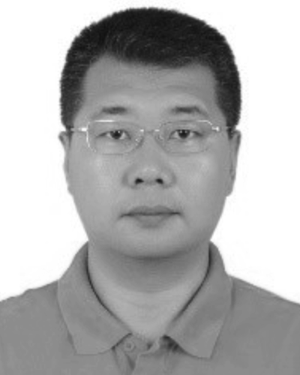 Jingxue Guo合作论文数5
 Jinghua Liu (刘菁华)合作论文数College of Geoexploration Science and Technology, Jilin University4Huanyuan Chen合作论文数3Anxing Zou合作论文数3
 Amr Abd El-Raouf合作论文数School of Earth Sciences, Zhejiang University3Tianxiang Yu合作论文数3
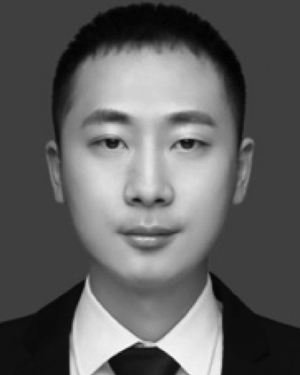 Yu Liu合作论文数3
 Zhuwen Wang (王祝文)合作论文数3Zhanhai Zhang合作论文数3Guo Jinxue合作论文数2Xinxin He合作论文数2Wu Guochao合作论文数2Xuejing Li合作论文数2Xia GUO (郭霞)合作论文数2
 Xueyuan Tang (唐学远)合作论文数School of Oceanography, Shanghai Jiao Tong University2Zheng-Yu Wang (王征宇)合作论文数2YuanSheng Li (李院生)合作论文数2Yang Ding (丁阳)合作论文数2
 Martin Siegert合作论文数University of Exeter;The Grantham Institute for Climate Change, Faculty of Natural Sciences, Imperial College London;School of Geosciences, University of Edinburgh2
 Fausto Ferraccioli合作论文数British Antarctic Survey2Hon Kuan Wong合作论文数1Samuel Seddon合作论文数1Kai Ding合作论文数1Xia Guo合作论文数1Ding Yang合作论文数1
 Carol A Finn合作论文数1
 Carlos Martin合作论文数1LI Na (李娜)合作论文数1Sait Tasci合作论文数1Mohammed S. Fnais合作论文数1
 Duncan A. Young合作论文数Institute for Geophysics, Jackson School of Geosciences, University of Texas at Austin1Jamin Greenbaum合作论文数1
 Serkan Senocak合作论文数Dept Civil Engn, Ataturk Univ1Qingyuan Ji (季青原)合作论文数1Ziyan FANG (方子炎)合作论文数1Lei Qiu合作论文数state oceanic administration1LIU Jie (刘杰)合作论文数1Fikret Dogru合作论文数1
 Chong Zhang合作论文数Chinese Academy of Geological Sciences1
 Yang Chen合作论文数Northeastern Univ, Sch Mech Engn & Automat, Shenyang, Liaoning, Peoples R China1
 Binbin Mi (宓彬彬)合作论文数School of Earth Sciences, Zhejiang University1




