Having the ability to accurately and effectively obtain soil organic carbon (SOC) spatial information is critical for assessing soil carbon sequestration capacity and mitigating climate change. However, there remains a significant research gap in the collaborative application of multi-source data and their impact on model estimation accuracy. This gap limits the ability to assess soil carbon pools accurately. Therefore, we propose a data-model fusion framework that uses three types of multi-source data-environmental variables, optical remote sensing, and synthetic aperture radar (SAR)- along with three machine learning algorithms to predict SOC. We conducted data fusion of SOC field observation data and model simulations using high-accuracy surface modeling (HASM). The results showed that: (1) The data VII combination, which incorporates all three data types, paired with support vector machine (SVM), random forest (RF), and Extreme Gradient Boosting (XGBoost) models, obtained higher prediction accuracy (R2 increased by 4 % - 53 %, and RMSE decreased by 18 % - 25 %) compared to other data combinations. (2) After data fusion using HASM, simulation accuracy improved significantly (R2 increased by 18 % - 22 %, and RMSE decreased by 2 % - 12 %). Additionally, the spatial distribution pattern was more reasonable, with corrections made to previously underestimated and overestimated SOC content. This study demonstrates that multi-source data fusion combined with machine learning techniques can achieve optimal results for SOC prediction. This approach provides an accurate and novel method for estimating SOC at national and global scales and offers scientific guidance for the spatial planning of terrestrial carbon sink strategies.
To overcome longstanding issues of error propagation and low computational efficiency in geographical information systems (GIS) and computer-aided design (CAD) systems, high-accuracy surface modeling (HASM) methods were developed through the systematic integration of systems theory, optimization cybernetics, and surface theory. Following nearly two decades of numerical experimentation and empirical investigation, a universal fundamental theorem of surface modeling (UFTSM) was formulated. This theorem provides a general theoretical framework applicable to spatial interpolation, upscaling, downscaling, data fusion, and model-data assimilation across a wide range of disciplines, including Earth surface system science, eco-environmental informatics, medical imaging, and computer-aided design. The UFTSM was first successfully applied to the simulation of eco-environmental surfaces. Within the conceptual framework of the Intergovernmental Science-Policy Platform on Biodiversity and Ecosystem Services (IPBES), ecoenvironmental components were classified into three categories: nature (including species diversity, ecosystem structure, and geographical features), nature's contributions to people (such as food provision, freshwater supply, and environmental pollution remediation), and drivers of natural change (including climate change, land-use change, policies, and regulations). The term eco-environmental surface is used as a unified concept to represent surfaces describing nature, nature's contributions to people, or drivers of natural change. Numerous studies have demonstrated that intrinsic information (e.g., ground-based observations) and extrinsic information (e.g., satellite observations) provide complementary perspectives, and that neither alone can fully characterize an eco-environmental surface. Instead, such surfaces are governed by the joint influence of intrinsic and extrinsic information, and cannot be adequately understood without considering both. To address the challenge of simulating eco-environmental surfaces through the integration of these two information sources, an iterative differential method for HASM-based machine learning was developed, and a fundamental theorem for eco-environmental surface modeling (FTEEM) was proposed. In addition, a suite of high-efficiency algorithms suitable for classical computing platforms, including a modified conjugate gradient algorithm, a multigrid algorithm, an adaptation algorithm, and adjustment computation, was designed to accelerate eco-environmental surface modeling. Compared with existing surface modeling approaches, HASM-based applications exhibit substantially improved accuracy. However, computational cost remains a major bottleneck for global-scale eco-environmental surface modeling, particularly as spatial resolution becomes increasingly fine. To address the limitations of classical algorithms and hardware, HASM was reformulated as a large sparse linear system using the Lagrange multiplier method. This system was then implemented on both a real quantum computer and a virtual quantum computing platform by employing two widely used quantum linear solvers: the Harrow-Hassidim-Lloyd (HHL) algorithm and the iterative refinement of the variational quantum linear solver (iVQLS). Based on these approaches, two HASM-oriented quantum linear solvers, HASM-HHL and HASM-iVQLS, were developed, enabling the solution of simulation problems that are intractable for classical computers. The respective advantages and limitations of HASM-HHL and HASM-iVQLS, as quantum machine learning algorithms, were systematically evaluated through simulation experiments conducted on both real and virtual quantum computing platforms. The comparative results highlight the urgent need for a universal tool library that supports both classical and quantum intelligent computing. Moreover, the development of a full-stack quantum input-computing-output system is essential for overcoming the principal challenges currently faced by HASM-based quantum machine learning.
Climate change has significantly altered plant habitats within the Earth’s surface system, reshaping the global distribution and succession of vegetation. The spatiotemporal simulation of vegetation dynamics is essential for effective ecosystem management and conservation at regional scales. In this study, an improved method is developed to analyze the vegetation patterns and scenarios in the Poyang Lake basin, based on the High-Accuracy Surface Modeling (HASM) method and the improved Holdridge Life Zone (HLZ) ecosystem model. HASM is applied to generate high-resolution (250 m × 250 m) spatial grid data for key climate parameters, including mean annual biotemperature (MAB), total annual precipitation (TAP), and potential evapotranspiration ratio (PER), for each decade from 1961 to 2050. The distribution thresholds of vegetation types are calculated based on current vegetation data, MAB, TAP, PER, longitude, latitude, and elevation datasets. In the improved HLZ ecosystem model, the classification parameters of vegetation types have been expanded from three to six. The simulation results indicate that cultivated vegetation, subtropical coniferous forest, and subtropical grassland are the dominant vegetation types, accounting for 75.88% of the total area. Between 2020 and 2050, subtropical coniferous forest is projected to experience the greatest decrease in area, shrinking by an average of 2.65 × 10³ km2 per decade. In contrast, subtropical evergreen–deciduous broadleaf mixed forest is expected to undergo the largest increase, expanding by an average of 1.96 × 10³ km2 per decade. Vegetation types in high-altitude regions exhibit the most rapid changes, with an average decadal variation of 15.26%, whereas low-altitude regions show relatively slower changes, averaging 0.52% per decade. Overall, subtropical grassland, subtropical coniferous forest, and subtropical evergreen–deciduous broadleaf mixed forest in the Poyang Lake basin demonstrate high sensitivity to projected climate change scenarios.
The rapid development and urbanization along the GT roadside has brought severe potentially toxic elements (PTEs) contamination to the soil and may lead to considerable risk to the ecosystem. In this study, the concentrations, spatial distribution along with ecological risk, and health risk assessments of PTEs (Pb, Cr, Cu, and Cd) in the GT roadside soil from Sialkot to Rawalpindi are evaluated, aiming to provide a theoretical understanding of managing and mitigating the PTEs contamination. 200 samples are collected at varying distances from the road's edge across 4 different zones (Sialkot, Gujrat, Jhelum, and Rawalpindi). A non-linear fitting model is applied to analyze the correlation between PTEs and roadside distance and shows PTEs concentration decrease with an increase in the road proximity. As distance from the road increases, ERI decreases with the highest risk at 0 m (265.99) and the lowest risk at 100 m (59.46), highlighting the gradual dissipation of the pollutant. The maximum concentration of PTEs is observed in Sialkot, while the minimum is noted in Jhelum. The mean concentrations of PTEs at 0 m were 34.9, 14.3, 27.1 and 0.66 for Pb, Cu, Cr and Cd, respectively in this descending order: Pb > Cu > Cr > Cd. The mean concentration of ERI of PTEs was 120.84 at Sialkot, 86.61 at Gujrat, 50.03 at Jhelum, and 69.63 at Rawalpindi. Cr and Cu pose a lower ecological risk as compared to Pb and Cd. Roadside soil ranges from “unpolluted” to “moderately polluted” for all metals excluding Cr. Nemerow Integrated Pollution Index (NIPI) value of 1.005 indicates that the contamination level slightly exceeds the acceptable limit. The trend of the average daily dose of PTEs (ADD) in soil via the three pathways is noted in the order of ADDinh ˂ ADDderm ˂ ADDing. Among ADD of soil, ADDderm has maximum value in adults, while ADDing and ADDinh values are maximum for children. The hazard index (HI) for all inspected PTEs in the soil is below 1, demonstrating no considerable health risk for either children or adults. The Pakistani government should prioritize traffic, and industrial-related environmental issues along GT road. This study is helpful to further analyze and assess the health risks associated with exposure to PTEs near highways, including those in industrial areas globally.
Understanding how biotic and environmental drivers jointly shape forest carbon dynamics over time is essential for climate-adapted management of subtropical forests. We investigated the long-term interactions between biotic factors, environmental factors, and forest carbon dynamics in the subtropical forests of Jiangxi Province, China, over the period 1989–2019. The High Accuracy Surface Modelling (HASM) multi-source data fusion method integrates ground observation points with area-wide data from remote sensing and existing datasets to simulate the spatial distribution of forest carbon density across the entire study area. In Zixi, forest carbon density increased most rapidly between 1989 and 2009, after which the rate slowed as forest stands matured. Structural Equation Modelling (SEM) disentangled direct and indirect effects of drivers, and identified species richness and community-weighted functional traits as key positive drivers of aboveground carbon density. The influence of environmental factors reversed over the study period. Under ongoing global warming, the combined effects of altitude, temperature, and precipitation shifted from suppressing to reinforcing carbon accumulation in later years, increasingly operating through pathways mediated by functional traits. These findings enhance our understanding of carbon dynamics in subtropical forests and underline the importance of preserving species richness, especially in subtropical mountain forest. This study provides valuable insights for adaptive forest management and climate change mitigation strategies, aiming to improve ecosystem resilience and sustain carbon sequestration efforts in the face of ongoing global warming.
Accurate estimates of soil organic carbon (SOC) stocks are important in understanding terrestrial carbon cycling. Based on the fundamental theorem of surfaces, an alternative method, high accuracy surface modelling (HASM) combined with soil depth information was applied to predict the spatial pattern of SOC stocks in Hebei Province, China. In this study, we collected 434 soil samples and key environmental covariates related to soil-forming factors (soil, climate, organisms, topography, and soil depth information) in the study area, and compared the accuracy of 16 spatial prediction models (including single models, hybrid models, and HASM combined with single or hybrid models) on the spatial distribution of SOC stocks. The results confirmed that the method of HASM combined with the generalized additive model (GAM) with soil depth covariate (HASM_GAMD) achieved a better performance than other methods at soil depths of 0-30, 0-100 and 0-200 cm. The root-mean-square error and coefficient of determination values of predicting the spatial pattern of SOC stocks by the HASM_GAMD model demonstrated a 43% and 49% improvement, respectively, compared with models without depth information. The prediction uncertainty of the HASM_GAMD model based on 90% prediction interval was lower than that of other models. The HASM_GAMD model excels in addressing not only the nonlinear relationship between covariates and SOC stocks, but also in incorporating point observation data that varies with soil depth. Furthermore, the model conducts modelling by integrating surface and optimal control theories. Results obtained from the HASM_GAMD demonstrated that the SOC stocks in Hebei Province amounted to 1449.08 Tg C. Our study introduces an alternative model for modelling of SOC stocks and our findings are a valuable reference for assessing carbon stocks in Hebei Province to support sustainable land management and climate change mitigation.
Various investigations have been conducted to analyze the water-coverage area of the Aral Sea and the Aral Sea Basin (ASB). However, the investigations incorporated considerable uncertainty and the used water indices had misclassification problem, which made different research groups present different results. Thus we first ascertain the boundaries of the ASB, the Syr and Amu river basins as well as their upper, middle and lower reaches. Then a four-band index for both liquid and solid water (ILSW) is proposed to address the misclassification problems of the classic water indices. ILSW is calculated by using the reflectance values of the green, red, near infrared, and thermal infrared bands, which combines the normalized difference water index (NDWI) and land surface temperature (LST) together. Validation results show that the ILSW water index has the highest accuracy by far in the Aral Sea Basin. Our results indicate that annual average decline of the water-coverage area was 963 km 2 in the southern Aral Sea, whereas the northern Aral Sea has experienced little change. In the meanwhile, permanent ice and snow in upper reach of ASB has retreated considerably. Annual retreating rates of the permanent ice and snow were respectively 6233 and 3841 km 2 in upper reaches of Amu river basin (UARB) and Syr river basin (USRB). One of major reasons is that climate has become warmer in ASB. The climate change has caused serious water deficit problem. The water deficit had an increasing trend since the 1990s and its increasing rates was 3.778 billion m 3 yearly on average. The total water deficit was 76.967 billion m 3 on average in the whole area of ASB in the 2010s. However, up reaches of Syr river basin (USRB), a component area of ASB, had water surplus of 25.461 billion m 3 . These conclusions are useful for setting out a sustainable development strategy in ASB.
In the context of achieving global carbon neutrality, forests play a pivotal role in sequestering atmospheric CO2, particularly in China, where forest management is central to national climate strategies. This study evaluates the forest carbon sink capacity in Zixi County, a subtropical region, under varying climate scenarios (SSP2-4.5 and SSP5-8.5). Using the Forest-DNDC (Denitrification–Decomposition) model, combined with high-precision climate data and a random forest model, we simulate forest carbon density and forest carbon sink under different management strategies. The results indicate that under the baseline scenario, forest carbon density in Zixi County increases by 31% over 42 years under the SSP2-4.5 climate scenario and by 28.6% under SSP5-8.5. In the enhancing economic scenario, carbon density increases by 8.5% under SSP2-4.5 and by 7.2% under SSP5-8.5. For the natural development scenario, a significant increase of 130% is observed under SSP2-4.5, while SSP5-8.5 shows an increase of 120%. Spatially, forest carbon sinks in Zixi County total 843,152 T C in 2020, 542,852 T C in 2030, and 877,802 T C in 2060 under the baseline SSP2-4.5 scenario; under SSP5-8.5, these values are 841,321 T C in 2020, 531,301 T C in 2030, and 1,016,402 T C in 2060. In the enhancing economic scenario, the total carbon sink is 34,650 T C in both 2020 and 2030, increasing to 427,351 T C in 2060 under SSP2-4.5, while under SSP5-8.5, it is 46,200 T C in 2020, 34,650 T C in 2030, and 415,801 T C in 2060. The natural development scenario shows the total carbon sink under SSP2-4.5 as 11,157,332 T C in 2020, 3,441,910 T C in 2030, and 1,409,104 T C in 2060, and under SSP5-8.5, it is 10,903,231 T C in 2020, 3,337,960 T C in 2030, and 1,131,903 T C in 2060. Spatial analysis reveals that elevation and forest type significantly affect carbon density, with high-altitude areas and forests dominated by Chinese fir and broadleaf species showing higher carbon accumulation. The findings highlight the importance of targeted forest management, prioritizing species with higher carbon sequestration potential and considering spatial heterogeneity. These strategies, applied locally, can contribute to broader national and global carbon neutrality efforts.
The evolution process of ephemeral gully (EG) is a major content in the study of gully erosion and geomorphology. However, due to the short duration of EG existence, field-based continuous quantitative observation information is still lacking. The objective of this study was to characterize the morphological changes and evolution mechanisms of EG under natural conditions in the Dry-hot Valley. A representative EG was observed from 2016 to 2020 by using laser scanning. Results showed that after four years, the erosion area and erosion volume increased 4.5 and 17.3 times, respectively. The length, width, and depth of the main channel continuously increased over time but the growth rates decreased. During the four monitoring periods, the average growth rates of width were 0.12, 0.26, 0.33 and 0.06 m/year, respectively; the average growth rates of depth were 0.07, 0.08, 0.03 and 0.02 m/year, respectively; and the growth rates of length were 7.58, 1.78, 2.17 and 1.17 m/year, respectively. EG morphological parameters varied at different locations of the hillslope. The crosssection area increased gradually towards downslope, especially in the middle and lower parts of the channel. However, the width-depth ratio of EG decreased gradually from upper to lower parts of the hillslope, and the values were generally greater than 1.0. In addition, the variation of sinuosity, density and tortuosity complexity were influenced by both headward and lateral erosion, which increased and then decreased. The vertical gradient increased significantly and then tends to be stable. The results of this study are helpful to enrich current studies on the evolution process of ephemeral gully.
The miniaturization of transistors led to advances in computers mainly to speed up their computation. Such miniaturization has approached its fundamental limits. However, many practices require better computational resources than the capabilities of existing computers. Fortunately, the development of quantum computing brings light to solve this problem. We briefly review the history of quantum computing and highlight some of its advanced achievements. Based on current studies, the Quantum Computing Advantage (QCA) seems indisputable. The challenge is how to actualize the practical quantum advantage (PQA). It is clear that machine learning can help with this task. The method used for high accuracy surface modelling (HASM) incorporates reinforced machine learning. It can be transformed into a large sparse linear system and combined with the Harrow-Hassidim-Lloyd (HHL) quantum algorithm to support quantum machine learning. HASM has been successfully used with classical computers to conduct spatial interpolation, upscaling, downscaling, data fusion and model-data assimilation of eco-environmental surfaces. Furthermore, a training experiment on a supercomputer indicates that our HASM-HHL quantum computing approach has a similar accuracy to classical HASM and can realize exponential acceleration over the classical algorithms. A universal platform for hybrid classical-quantum computing would be an obvious next step along with further work to improve the approach because of the many known limitations of the HHL algorithm. In addition, HASM quantum machine learning might be improved by: (1) considerably reducing the number of gates required for operating HASM-HHL; (2) evaluating cost and benchmark problems of quantum machine learning; (3) comparing the performance of the quantum and classical algorithms to clarify their advantages and disadvantages in terms of accuracy and computational speed; and (4) the algorithms would be added to a cloud platform to support applications and gather active feedback from users of the algorithms.
Bamboo forest has undergone dramatic expansion due to climate changes and human activities, and its direct effects on both carbon storage and biodiversity of the forest ecosystem have occurred in tropical and subtropical regions, especially in China. However, the uncertainty in tracking bamboo forest extent and expansion intensity substantially influenced our assessment of them due to the poor resolution and persistent cloud covers in optical images (e.g., Landsat and Sentinel-2). We developed a straightforward and superior algorithm by coupling vegetation phenology and cloud-free SAR using Sentinel-1 and -2 images to identify bamboo forest at large scales and higher spatial resolution. Specifically, (1) this study analyzed the spectral and phenological characteristics during the bamboo forest growth season; (2) the optimum parameter sets for the SAR backscatter were calibrated against field data by using the genetic algorithm; (3) and then we generated bamboo forest and expansion intensity maps at 10 m spatial resolution for seven study regions in China in 2020. The results showed that the Kappa of the maps was 0.89, and the OA was 94.7% in all study areas, compared with the field data. The accuracy among each study area also performed well in mapping bamboo forest, indicated by Kappa varying from 0.82 to 0.94, and OA ranging from 91.1% to 97.33%. Compared to the national forestry inventory map, our results showed a significant positive linear relationship, with a higher R2 (0.96, p < 0.001). With the high-resolution results, we found that the tree was most severely affected by bamboo forest, followed by grassland, sparse vegetation, and shrubland. This product can be a key input for many carbon cycles, climate, and vegetation models.
Grassland areas occupy 60% of the Qinghai-Tibetan Plateau (QTP) and play a critical role in enhancing the ecological barrier functions of the QTP. Grassland ecosystems, and net primary productivity (NPP) in general, have dramatically changed in time and space since the 1980s, with climate warming and the intensification of human activities. Current research widely believes that climate and human activities are the common driving factors of grassland ecosystem changes on the QTP. However, there is still controversy over their dominant driving factors and their contribution rates, especially during different research periods. Therefore, this study calculated the relative contributions of climate change, human activities (except LUCC) and LUCC to actual NPP (aNPP) changes during the two periods from 1982 to 2000 to 2001–2020. This study simulated three kinds of NPPs, that is, actual NPP, potential NPP, and human-appropriated NPP, using climate productivity, the light use efficiency model, and the residual method, respectively. Moreover, the study area was divided into two parts, and then the contributions of the three factors were calculated objectively. The results showed that (1) the actual NPP (aNPP) of the QTP increased dramatically from 1982 to 2000 but did not change obviously from 2001 to 2020. (2) Comprehensive evaluation showed that climate was the dominant factor for the aNPP net increase, and its contribution rate dramatically increased from 36.3% during 1982–2000 to 224.2% during 2001–2020. Human activities changed from a positive contribution (53.3%) to a negative contribution (−124.8%) to the aNPP net increase. The contribution rate of LUCC to the aNPP increase significantly decreased from 10.4% to 0.6%. Therefore, finer grassland restoration measures and government policies must be implemented to increase NPP against the background of favorable warm-wet climate conditions for increasing grassland NPP in the QTP. These results benefit the scientific management of grassland resources and ecological barrier building on the QTP.
通过晶体管小型化增加芯片上的晶体管数量一直是计算进步的最基本部分.然而,晶体管小型化已达到极限水平.与此同时,现有计算机已无法满足许多实际问题对计算资源的巨大需求.幸运的是,量子计算机初见端倪.有关研究表明, 54量子比特的量子计算机在数分钟内就可完成传统计算机需要用1万年才能完成的计算任务;机器学习可提高量子算法的精度.机器学习方法可区分为监督学习、非监督学习、强化学习和多法混合学习.本文引入的高精度曲面建模(HASM)方法是一种强化学习方法,它可转换为大型线性稀疏系统.这个大型线性系统可运用HHL量子算法进行求解.我们将HASM机器学习与HHL量子算法的合成称为HASM-HHL量子机器学习.训练实验表明,精度设置对HASM-HHL性能和量子电路参数有很大影响;量子计算对量子比特总数的需求依赖于计算域的栅格总数.运用HASM-HHL模拟整个地球表面时,在1 km×1 km空间分辨率,需要40量子比特;在1 m×1 m空间分辨率,需要45量子比特. HASM-HHL可实现相对传统计算机算法的指数级加速.由于HASM已成功应用于各种空间尺度的数字高程模型构建以及生态多样性变化、人口动态、土壤属性动态、食物供给动态、碳储量动态、二氧化碳浓度变化、气候变化和新冠病毒传播动态等的模拟分析, HASM-HHL有望成为模拟分析地球表层系统及其生态环境要素的通用量子机器学习平台.
机载激光测深系统在珊瑚礁栖息地的调查研究中发挥着重要的作用,能够为复杂珊瑚礁系统的地图制图和信息量化提供高精度的海洋地理信息数据.为此,将高精度曲面模型算法(H ASM)应用于珊瑚礁栖息地的曲面建模,建立了基于H ASM算法的高分辨率珊瑚礁栖息地地形模型;然后,将其与传统地理信息建模方法(克里金插值、样条插值)进行了对比.实验结果表明:该模型的精度更高,反映的地形特性更逼近真实情况,具有更好的地形建模效果.
The computer advances of the past century can be traced to the increase in their numbers on chips that has accompanied the miniaturization of transistors.However,computers are nearing the fundamental limits of such miniaturization[1].Many practical problems require huge amounts of computational resources that exceed the capabilities of today's computers.A 54-qubit quantum computer on the other hand can solve in minutes a problem that would take a classical machine 10,000 years[2].
Soil Cd pollution is a serious environmental issue associated with human activities. However, the factors determining exogenous Cd dynamics in the soil profile in a complex environment are not well understood. Based on regional observations from 169 soil profiles across the Chengdu Plain, this study explored the key factors controlling Cd accumulation in the soil profile under actual field conditions. Results showed that total soil Cd contents decreased from 0.377 to 0.196 mg kg(-1) with increasing soil depth. The effects of phosphate fertilizer rates, road density and precipitation on the difference in total soil Cd content were only observed in topsoil, while agricultural land-use type and topography had no impact. In contrast, significant differences in the total soil Cd content among different parent material types were found in the 0-20,40-60 and 60-100 cm soil depths. One sample t-tests showed that significant Cd accumulation occurred in the whole soil profile in soils formed from Q4 (Quaternary Holocene) grey alluvium, while soils formed from Q3 (Quaternary Pleistocene) old alluvium and Q4 grey-brown alluvium showed significant Cd accumulation only in the 0-40 cm soil layers. In the topsoil, acid soluble Cd accounted for the largest proportion of the total Cd in soils formed from Q4 grey alluvium, reducible Cd was the main fraction in soils formed from Q4 grey-brown alluvium, while reducible Cd and residual Cd contributed the largest proportion of the total soil Cd in soils formed from Q3 old alluvium. The above results indicated that parent material was the decisive factor determining the magnitudes and depths of exogenous Cd accumulation in the soil profile due to its impacts on the Cd fraction distributions. These findings suggested that the parent material-induced Cd fraction distributions and accumulation should be considered for effectively exploring targeted remediation strategies for Cd pollution. (C) 2021 Elsevier B.V. All rights reserved.
 Tianxiang Yue (岳天祥)合作论文数Institute of Geographic Sciences and Natural Resources Research, Chinese Academy of Sciences;University of Chinese Academy of Sciences65
 Zemeng Fan (范泽孟)合作论文数Institute of Geographic Sciences and Natural Resources Research, Chinese Academy of Sciences, Beijing20
 Na Zhao (赵娜)合作论文数Institute of Hydroecology, Ministry of Water Resources of the People's Republic of China & Chinese Academy of Sciences16
 Dunjiang Song (宋敦江)合作论文数中国科学院科技政策与管理科学研究所16
 Wenjiao Shi合作论文数Institute of Geographic Sciences and Natural Resources Research, Chinese Academy of Sciences16
 Yicheng Cao合作论文数16
 Mingwei Zhao合作论文数12
 Chuanfa Chen (陈传法)合作论文数School of Surveying and Mapping, Shandong University of Science and Technology11
 Shoubin Dong (董守斌)合作论文数School of Computer Science & Engineering, South China University of Technology10
 Yifu Wang合作论文数9
 John P. Wilson合作论文数Spatial Sciences Institute, Dana and David Dornsife College of Letters, Arts and Sciences, University of Southern California8Saibo Li合作论文数6Yimeng Jiao (焦毅蒙)合作论文数Institute of Geographic Sciences and Natural Resources Research, Chinese Academy of Sciences6
 Wei Zhou合作论文数6
 Xiao-Fang Sun合作论文数6
 Qiquan Li (李启权)合作论文数College of Resources, Sichuan Agricultural University6Zong Wang合作论文数5
 Ming Lu合作论文数5
 Lili Zhang合作论文数5Pengfei Liu (刘鹏飞)合作论文数5
 Jiyuan Liu (刘纪远)合作论文数Institute of Geographic Sciences and Natural Resources Research, Chinese Academy of Sciences5
 Zhe Xu合作论文数4Yinjun Song合作论文数4
 John Peter Wilson合作论文数Institute of Geographic Sciences and Natural Resources Research, Chinese Academy of Sciences;University of Chinese Academy of Sciences;Department of Computer Science, University of Sout4
 Xiaozhe Yin合作论文数Dept Prevent Med, Univ Southern Calif4
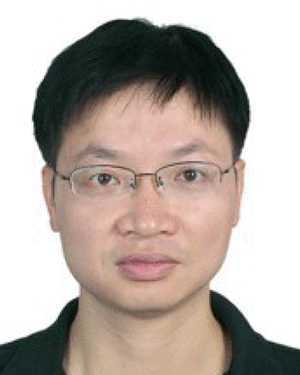 Yimin lu (卢毅敏)合作论文数4HongSheng Huang (黄宏胜)合作论文数4
 Yongzhong Tian (田永中)合作论文数School of Geographical Sciences, Southwest University4
 Min Zhuo (卓敏)合作论文数School of Biology and Biological Engineering, South China University of Technolegy4
 Bin Zhang (张斌)合作论文数College of Resources & Environmental Sciences, Nanjing Agricultural University4
 Ufra Naseer合作论文数3Bin Fan合作论文数3
 Changqing Yan合作论文数Department of Information Engineering, Shandong University of Science and Technology, 271019 Taian, China3Miaomiao Zhao合作论文数3Zhengyi Bao合作论文数3
 Qing Wang合作论文数Chinese Ctr Dis Control & Prevent, Div Infect Dis, Beijing, Peoples R China3Yapeng Zhao合作论文数3Shihai Wang合作论文数3Xiang FANG (方翔)合作论文数3
 Muhammad Adnan合作论文数Department of Botany, Kohat University of Science and Technology3Zhenwu Zhang (张珍武)合作论文数School of Biology and Biological Engineering, South China University of Technolegy3
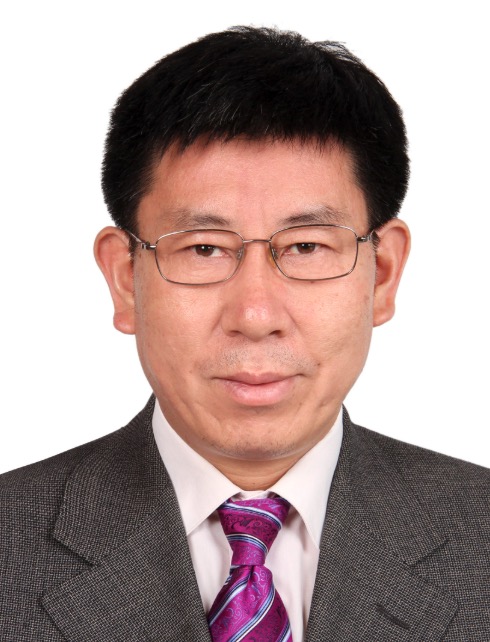 Chenghu Zhou (周成虎)合作论文数Institute of Geographic Sciences and Natural Resources Research, Chinese Academy of Sciences;University of Chinese Academy of Sciences;Xinjiang Institute of Ecology and Geography , Chinese Academy of Sciences3Xu Guo (郭旭)合作论文数3Ying An Wang合作论文数3Chenliang Wang合作论文数3ZENG Bing-jia (曾炳佳)合作论文数2wang wei (薇 王)合作论文数2
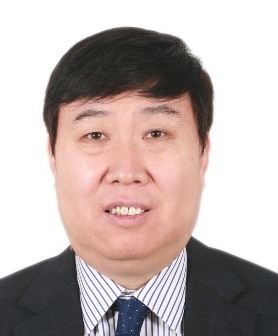 Bojie Fu (傅伯杰)合作论文数Research Centre for Eco-Environmental Sciences, Chinese Academy of Sciences;University of Chinese Academy of Sciences2




