Tropomyosin receptor kinase (TRK), belonging to the tyrosine kinase family, is associated with tumor proliferation, invasion, and survival in various cancers. Upon activation by neurotrophic factors, TRK regulates crucial cellular processes through downstream signaling pathways. Dysregulation of TRK signaling can lead to a range of diseases including cancers. Moreover, mutations in TRK kinases leading to resistance remain a critical issue, necessitating the discovery of new TRK inhibitors to overcome acquired resistance. Recently, several selective TRK inhibitors have been reported, making it possible to address off-target effects and adverse reactions associated with the target. This review summarizes the recent advances in small molecular TRK inhibitors with diverse structural types, activities, and selectivity. It highlights promising small molecules that have shown breakthrough achievements in the field.
Supplementary Figure 5, Molecular pathway enrichment of CARMIL3. Related to Fig. 5. A. KEGG pathway enrichment plots of Gene Set Enrichment Analysis (GSEA) with gene ex-pression profiles of 4T1 WT and Carmil3 KO cells. B. Biological Process (BP) analysis result of DAVID with genes whose readout counts>100 and the fold change >=4 of RNA-seq. C. Western blot result of WT and Carmil3 KO 4T1 cells, together with WT and Carmil3 KO cells re-expressing FLAG-CARMIL3 with indicated antibodies. D. Enrichment analysis of CARMIL3 in TCGA-BRCA. CARMIL3 high group was defined by Z-score >1 (RNA-seq). Statistic meth-od: Student's t test.
PURPOSE:Renal cell carcinoma (RCC) is the most common cancer of kidney. Evidences have shown that RCC is sensitive to various immunotherapies. Tim-3 plays a role in suppressing Th1-mediated immune responses. However, no study has yet examined the effect of Tim-3 on tumor infiltrating lymphocytes (TILs) in RCC.METHODS:We investigated the expression and function of Tim-3 on TIL CD4+ T cells and TIL CD8+ T cells from 30 RCC patients.RESULTS:Levels of Tim-3 were significantly increased on both TIL CD4+ T cells and TIL CD8+ T cells and were associated with higher stages of the cancer. Also, GATA-3 and interferon gamma (IFN-γ) were down-regulated, whereas T-bet was up-regulated in TIL Tim-3+ T cells, indicating that Tim-3 expression defined a population of dysfunctional TIL Th1/Tc1 cells. Mechanism analyses showed that TIL Tim-3-expressing CD8+ T cells exhibited impaired Stat5 and p38 signaling pathway. Blocking the Tim-3 pathway restored cell proliferation and increased IFN-γ production in TIL CD4+ and CD8+ T cells of RCC.CONCLUSIONS:These results suggest that Tim-3 may be used as a novel target for increasing immune responses in RCC tumor microenvironment.
BACKGROUND:Dysregulation of Long Non-coding RNAs (lncRNAs) emerges to be a hallmark of cancers. Metastatic prostate cancer and localized disease that recurs after treatment are clinical challenges, it remains unclear how lncRNA plays a role in those processes. METHODS:From previous RNA-Seq data on 65 prostate cancer and adjacent normal tissues. We identified a novel lncRNA ENST00000503625 down-regulated in prostate cancer and correlated with tumor progression characteristics. Public datasets were examined for associations between ENST00000503625 expression and clinical parameters and prognoses. Subsequently, we constructed and externally validated a nomogram for predicting biochemical recurrence (BCR). Finally, in vitro experiments were carried out to determine how ENST00000503625 functions biologically in prostate cancer. RESULTS:Low ENST00000503625 in tumor was associated with poor clinical features and prognoses. TCGA pan-cancer analysis found that ENST00000503625 was deregulated in a variety of tumors and correlated with overall survival, disease-specific survival, and progression-free survival. The nomogram for predicting BCR was constructed using TCGA data, which exhibited excellent accuracy in external validation with Chinese Prostate Cancer Genome and Epigenome Atlas data. Gene Ontology and KEGG pathway analysis found that genes related to ENST00000503625 were enriched in multiple tumor progression related pathways. When ENST00000503625 was knocked down in vitro, the epithelial-mesenchymal transition was induced, by which cancer cells migrated and invaded more readily. CONCLUSION:Our data suggested that ENST00000503625 may serve as a potential prognostic marker or a therapeutic target for prostate cancer metastases.
PDF file - 77KB, The fold-changes in miR-100 was confirmed by qRT-PCR, relative to the control as 1, as a consequence of either up-regulating after infection with miR-100-expressing lentivirus/vector control lentivirus(EJ and 5637) or down-regulating after transfected by miR-100 inhibitor/control RNA oligo(J82 and HT-1376).
Supplementary Table 1A shows multivariate Cox regression analysis of prognostic factors of breast cancer patients (cohort TCGA-BRCA PAM50 Luminal A, N=303)
Supplementary Figure 4, EGFP-mCARMI3 localizes at cortical plasma membrane as well as in cytoplasm. Related to Fig. 4. A. HEK293T cells were transfected with empty vector(MSCV-FLAG) or FLAG tag CAR-MIL3(MSCV-FLAG-CARMIL3), followed by immunoprecipitation (IP) with FLAG antibody and Western blot. B. Functional annotation of Gene Ontology (GO) by GeneMANIA with CARMIL3 potential interacting proteins listed is Table 1. C and D. Localization of exogenous EGFP tagged CARMIL3 in HEK293T (C) and 4T1 (D).
Supplementary Table 1B shows multivariate Cox regression analysis of prognostic factors of breast cancer patients (cohort GSE42568, N=104)
Supplementary Figure 7, CARMIL3 regulates β-catenin. Related to Fig. 7. A. qRT-PCR measurement of Ctnnb1 mRNA level in WT and Carmil3 KO 4T1 cells. B. HEK293T cells were transfected with CARMIL3-His or β-catenin-FLAG expressing plasmid. After 48 h, the cells were harvested for protein extraction, followed by immunoprecipitation with FLAG M2 antibody and WB. C. Correlation analysis of CARMIL3 mRNA and β-catenin protein expression with primary tumor samples of TCGA BRCA dataset, n=407, method: spearman.
Supplementary Figure 1, CARIML3 expression is upregulated among various types of cancer. Related to Figure 1. A. CARMIL3 copy number variance (CNV) level across various types of cancer in TCGA. B. CARMIL3 mRNA (RNA-Seq) expression among different types of cancer samples compared with their normal counterpart in TCGA. C. Analysis of CARMIL3 mRNA (RNA-seq) expression in TCGA-BRCA cohort grouped by major subclasses (with TNBC). D. Immunohistochemistry (IHC) staining image of CARMIL3 with breast cancer patient sample (ID: 2565). The image was from The Human Protein Atlas (HPA) database. E. CARMIL3 mRNA expression analysis in prostate cancer patients, dataset from GEO GSE3325. (F-I). Analysis of CARMIL3 mRNA expression in prostate cancer samples, in cBioPortal dataset (Beltran, 2016, Nature medicine) (F); in dataset GSE21034 (G); in dataset GSE35988 (H); in the cBioPortal dataset (Broad/Cornell,Nat Genet 2012) (I). J. Kaplan-Meier curve showing PRAD patient survival of the cBioPortal cohort (MSKCC, Caner Cell, 2010). Statistic methods: C and E-I Student's t-test; J Log-rank test.
Supplementary Figure 2, Carmil3 deficiency attenuates proliferation of tumor cells. Re-lated to Fig. 2. A and B. Carmil3 KO 4T1 tumor cell line was generated by CRISPR/Cas9 technology with a pair of sgRNA, which resulted in deleting a DNA fragment in the genomic locus of Carmil3. The targeted genomic region was amplified by PCR and sequenced (A) and the expression of Carmil3 mRNA was determined by qRT-PCR (B). C and D. Proliferation of 4T1 cells was de-termined by MTS assay (C) and BrdU incorporation assay (D). E. 4T1 WT and Carmil3 KO cells were stained with 7-aminoactinomycin D in BrdU incorporation assay, followed by FACS analysis of cell cycle. The quantified result was shown. F. At day 28 post 4T1 tumor inocula-tion, the mice were sacrificed and the primary tumor were harvested for flow cytometry analy-sis of NK1.1+ cell infiltration. The data was plotted as mean {plus minus} SEM. Statistic method: Student's t-test, * p < 0.05. The experiments were repeated three times independently.
PDF file - 150KB, MicroRNA target significant GO. The high-enrichment GOs targeted by the interested miRNAs: the vertical axis is the GO category and the horizontal axis is the -log2 treated of the P values of the enrichment of GO.
Supplemental Methods and References, Supplemental Tables S1-S10, Supplemental Figures S1-S11
 Chuanliang Xu (许传亮)合作论文数Changhai Hospital351
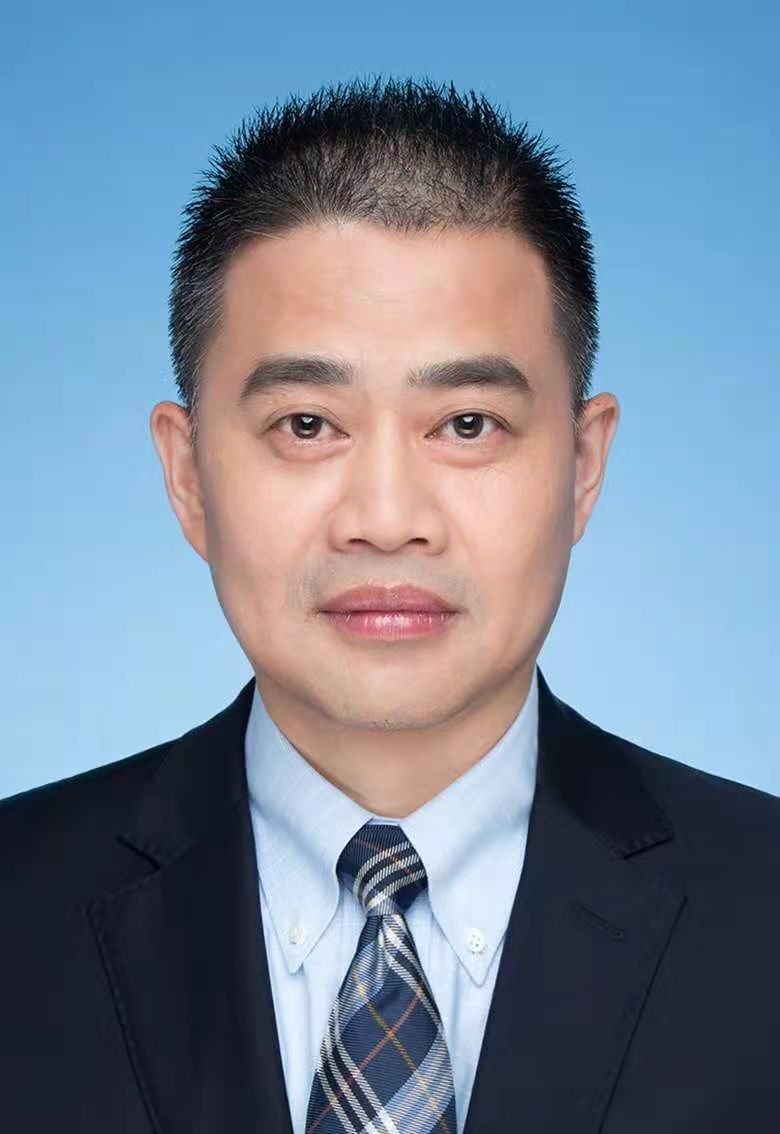 Linhui Wang (王林辉)合作论文数School of Health Science and Engineering, University of Shanghai for Science and Technology;Changhai Hospital of Shanghai281
 Xiaofeng Gao (高晓沨)合作论文数School of Computer Science, Shanghai Jiao Tong University;École d'Ingénieur Paris, Shanghai Jiao Tong University96
 Jianguo Hou (侯建国)合作论文数Department of Urology,Changhai Hospital,Second Military Medical University,Shanghai ,China95
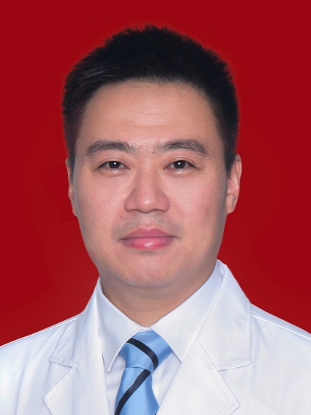 Shancheng Ren (任善成)合作论文数Department of Urology, Shanghai Changzheng Hospital91
 Bo Yang (杨波)合作论文数空军军医大学84
 Huiqing Wang合作论文数78
 Qing Yang (杨庆)合作论文数Shanghai Ninth People's Hospital, Shanghai Jiao Tong University School of Medicine71
 SongXi Qian (钱松溪)合作论文数67Liang Xiao合作论文数59Huamao Ye (叶华茂)合作论文数58
 Fubo Wang (王富博)合作论文数Changhai Hospital, Second Military Medical University51
 Dingwei Ye (叶定伟)合作论文数Institutes of Biomedical Sciences, Fudan University;Fudan University Shanghai Cancer Center50
 Tie Zhou (周铁)合作论文数School of Medicine, Tongji University;The Second Department of Urology, Shanghai Fourth People's Hospital Affiliated to Tongji University50
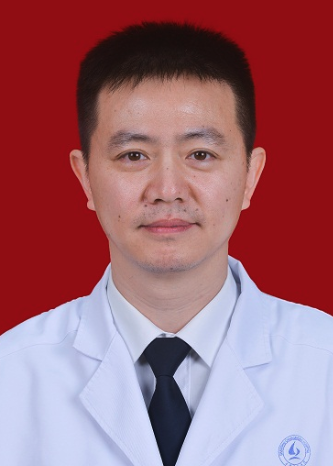 Bing Liu (刘冰)合作论文数Shanghai Changzheng Hospital48
 Zhiyong Liu (刘智勇)合作论文数Changhai Hospital of Shanghai45YongHan Peng (彭泳涵)合作论文数44
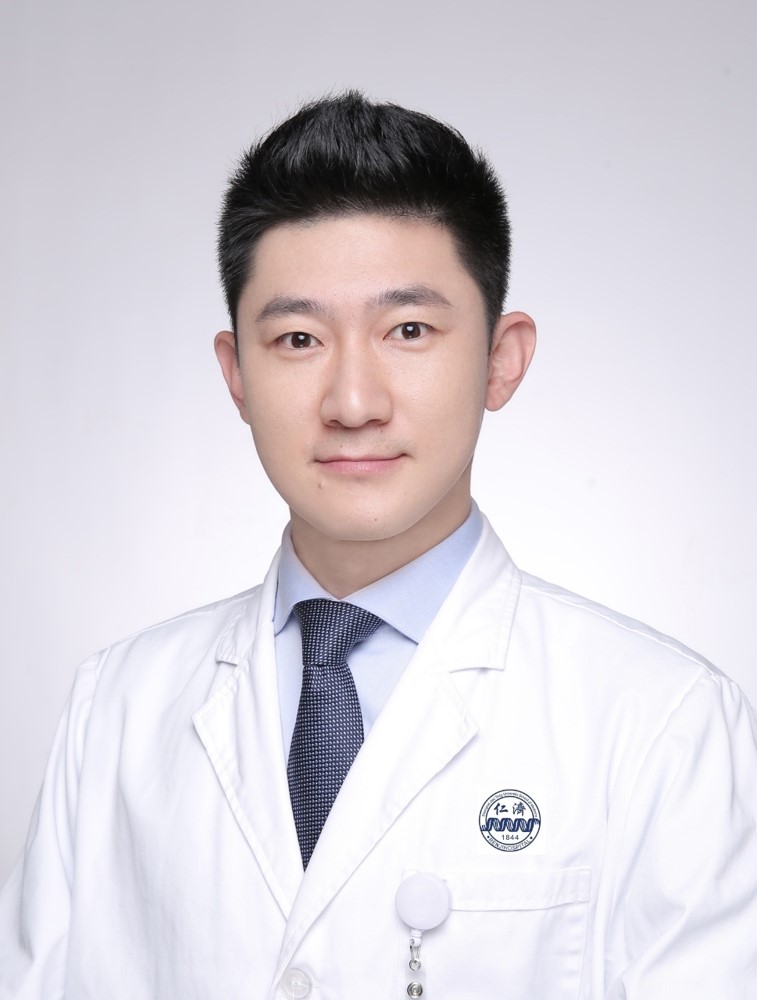 Rui Chen (陈锐)合作论文数Renji Hospital, Shanghai Jiao Tong University School of Medicine44
 Xu Gao (高旭)合作论文数Harbin Medical University43
 Zhenjie Wu合作论文数Department of Colorectal Surgery, Guangxi Medical University;Tumor Hospital of Guangxi Medical University36
 Shuxiong Zeng (曾蜀雄)合作论文数上海长海医院泌尿科35
 Xiao-Lei Shi (施晓雷)合作论文数Nanjing Drum Tower Hospital31GuoQiang Liao (廖国强)合作论文数29
 Qiang Ding (丁强)合作论文数Huashan Hospital, Fudan University29Yongjiang Ma (马永江)合作论文数28Yang Bo (杨波)合作论文数27Fei Guo (过菲)合作论文数27Xin Lu (鲁欣)合作论文数27
 Jiafu Zheng (郑家富)合作论文数第二军医大学第一附属医院27Xia Sheng (盛夏)合作论文数26
 Min Qu合作论文数26
 Zhu Yasheng合作论文数Shanghai Changhai Hospital, Second Military Medical University25Zhang Wei合作论文数24Yongwei Yu合作论文数23
 Jianfeng Xu合作论文数NorthShore University HealthSystem;University of Chicago Pritzker School of Medicine23Wei Chen (陈伟)合作论文数23Zhi Cao (曹智)合作论文数22Zhen Qiu (邱镇)合作论文数22
 Weidong Xu (徐卫东)合作论文数Changhai Hospital of Shanghai22Ruixiang Song (宋瑞祥)合作论文数22
 Zhengqin Gu (顾正勤)合作论文数Xinhua Hospital Affiliated to Shanghai Jiaotong University School of Medicine22
 Xingang Cui (崔心刚)合作论文数Shanghai Changzheng Hospital21
 Ziyu Fang合作论文数21
 Yiran Huang (黄翼然)合作论文数Renji Hospital, School of Medicine, Shanghai Jiao Tong University21Rongchao Wei (韦荣超)合作论文数21




