为实现渔业专题电子海图的标准化制定与应用,本文以IHO S-57电子海图国际标准为基础,通过分析海图数据模型和数据结构,并根据渔业专题信息的主要内容和特点,扩展了数据集信息记录中的数据集标识字段,定义了海洋渔业专题电子海图产品的编码规则.在物标和属性类目中增加了渔业专题物标和专题属性,并添加了部分专题属性项(值),从而设计了渔业专题电子海图的数据结构.研究成果将有利于整合、共享与应用海洋渔业信息,促进渔业专题电子海图产品的研发与生产,为渔业生物资源研究与利用、渔业生产与管理以及海洋渔业经济发展等提供规范化信息服务支撑.
快速和准确地处理多元异构数据文档,是实现电子航海通告信息由互联网获取到生产实际应用的核心环节.基于对航海通告源数据结构与特点的分析,设计了通告预处理数据库模型、系统功能模型及工作流程,利用OCR技术、数据库技术及VS2010编程环境,研发了电子航海通告预处理系统,解决了通告文档内容的拆分与整合、识别与提取、检核与修编等关键技术问题.实验结果表明:该系统能够高效地提取通告信息,减少制图人员手工作业的工作量,基本满足编制航海通告产品、海图改正与更新等业务需求,为一体化海图生产提供高质量的通告数据源.
现代城市的规划、决策和资源利用离不开地理空间数据库的支持,而工程测量图是地理空间数据建库的重要数据源.本文研究了由欧特克计算机辅助设计(CAD)工程图构建SuperMap空间数据库的基本方法,通过图纸预处理、数据读取与转换、数据检查与修复等过程,建立了一个案例地理空间数据库,并实现了某城区地理空间数据的可视化分析与应用.
渔业专题电子海图集成了海洋地理空间、渔场环境、渔业生产等综合信息,是现代海洋渔业信息化装备的重要组成部分.为实现渔业专题电子海图的标准化生产,基于中国目前的海图生产体系,以IHO S-57电子海图国际标准为基础,通过扩展海洋渔业专题物标和专题属性,应用以XML文档为数据载体的转换方法,实现了远洋渔业数据的编码、转换与整合,构建了渔业专题海图源数据库.研究结果将有利于促进海洋渔业专题海图产品的研发与生产,支持现代渔业的安全生产与管理、科学研究与决策以及渔业资源的可持续利用等.
目前,利用互联网发布和获取航海通告已经成为一种常态化模式,而海图生产部门和用户主要延用了手工选择、摘录、检查和入库等操作来处理和应用通告信息,这种方式制约了海图改正和更新工作的效率.以海图人工地物要素为主要研究对象,基于ArcMap软件、ArcGIS Add-In组件和ArcPython编程语言等开发环境,设计了互联网在线式人工地物信息处理解决方案,研究并解决了有关人工地物通告数据的爬取及清洗、提取与修编、检索和筛选,以及图层创建和输出等关键技术问题.实验结果表明:嵌入式软件成果能够极大提高海图人工地物信息的获取与处理效率,为海图改正和更新工作提供多种数据服务支持.
阿根廷滑柔鱼(Illex argentinus)为短生命周期种,其资源丰度易受海洋环境变化的影响,尤其是在产卵场的早期生活史阶段.根据2003-2016年我国鱿钓船队在西南大西洋的生产统计数据,以及产卵场海洋表面温度(SST)卫星遥感数据,用相关性分析方法筛选出阿根廷滑柔鱼产卵旺季期间(6月份)表征产卵场SST变化的特征海域;基于阿根廷滑柔鱼产卵场最适SST范围占总面积之比(Ps)与资源丰度单位捕捞努力渔获量(CPUE,t/船)呈正相关性的假设,回溯阿根廷滑柔鱼最适的产卵场及水温环境条件,并据此建立多种基于表征产卵场SST环境因子的资源丰度多元线性预测模型.相关性分析结果表明:6月份有两片连续海域(Area 1、Area 2)的SST与CPUE之间存在显著相关性,分别为42.5°~44°S、57.5°~59°W(Area 1)和39°~39.5°S、45°~46°W(Area 2);回溯的阿根廷滑柔鱼产卵场范围为37.5°~44°S、41.5°~51.5°W,产卵场最适SST范围为16~17.5℃.利用2个特征海域(Area 1、Area 2)SST以及回溯的产卵场Ps建立4种的多元线性资源丰度指数(ICPUE)预测模型,结果表明,包含表征寒暖流的特征海域和回溯产卵场Ps的方案4模型优于其他3种模型,其资源丰度指数预测模型为ICPUE=1.3904×Ps+0.2619×SSTArea 1+0.0962×SSTArea 2-3.2480.
为共享海洋地理空间信息,实现渔业信息的标准化,以中国远洋渔业数据库为数据源,基于对海洋渔业专用物标信息的分类及IHO S-57电子海图等国际标准,提出了符合国际标准的渔业专用扩展物标类目及其属性设计方案.构建了海洋渔业电子海图数据专用物标,分别为海洋经济物种、海况环境、渔船、渔具等4个类目,并对其属性一一进行了扩展.研究结果将有助于统一和规范渔业专用信息的存储、管理、表达与应用,推动海洋渔业电子海图产品的标准化,从而为渔业资源、渔场地形、渔场底质、渔场环境、渔情预报等工作提供基础性信息服务支持.
目前,从互联网获取航海通告数据是提高海图产品现势性、保障舰船航行安全的主要途径之一.基于对国内外网站特点、网页结构及网络爬虫技术、数据库技术的研究,提出了自动获取航海通告网页数据的总体方案;通过研发应用系统,实现了通告爬取、数据整理、数据库管理等主要功能.测试结果表明:较之传统工作方式,利用该系统获取的航海通告数据具有准确性、完整性、实时性和高效性,将为海图一体化生产体系提供更高质量的基础数据源支持.
根据1995—2014年中西太平洋鲣鱼围网捕捞生产统计数据,选取了产量最高的22个5°×5°的海区,结合尼诺指数划分不同的气候类型,以渔获量为指标,建立在不同气候条件下中西太平洋鲣鱼围网渔场的渔情预报模型.研究认为:在不同的气候条件下,鲣鱼产量有所波动,其中厄尔尼诺月份月总产量和月均产量最高,与拉尼娜月份产量接近,而正常年份产量最低;不同空间不同气候条件下的产量有较大差异,在130°E~145°E海域,北纬5°产量明显高于南纬5°产量,同时正常月份的产量最高;在145°E~165°E海域,拉尼娜月份产量最高;在165°E以东海域,拉尼娜月份产量最低;将渔获量与Nino 3.4区的SSTA建立关系,结果显示两者有着很强的相关关系,均符合正态模型(P<0.01).模型验证的结果显示,3种气候条件下的预报结果与实际统计值间均存在显著相关关系(P<0.01),模型有着较高的相关系数,拟合结果较好.针对中西太平洋不同空间位置的3种气候条件下鲣鱼渔获量波动规律进行研究,为预测渔场和相关预报工作提供了新的思路.
The Western and Central Pacific is the world's most important fishing ground for Katsuwonus pelamis and is also very sensitive to the changing ambient environment,so exploring the spatial and temporal variation,especially in the high catch area,is the basis and precondition for fishing forecasting. According to the catch data of Katsuwonus pelamis in the Western and Central Pacific during 1995—2014,using statistical analysis based on the above data with the monthly and annual interval,the fishing ground variations were detected through catch gravity analysis and cluster analysis. And a total of 22 fishing zones (5° latitude and 5° longitude)with the high catch were selected to analyze the spatial and temporal variation of catch and CPUE for Katsuwonus pelamis in the Western and Central Pacific. The results showed that the annual catch of Katsuwonus pelamis increased gradually with high fluctuation of CPUE,and high monthly catch mainly appeared in the first half year; catch gravity was inhomogeneous in longitudinal direction,four groups can be divided with cluster analysis; monthly gravity position changed clockwise,from west to east,from south to north,three groups can be divided with cluster analysis; main catch focused in the area of 5°S~5°N,120° ~175°E,CPUE in extreme years had significant differences with other years,and the CPUE of the first half year and second half year had significant differences; 135°~145°E was the boundary of longitude variation,and there was no significant difference in latitude variation. The above spatial and temporal variation may be caused by the change of warm pool in the west Pacific,and also have some relationship with the fishing access strategy in the island countries in the Pacific.
Skipjack tuna (Katsuwonus pelamis) is widely distributed in the tropical and subtropical water of the world's ocean, and has high abundance in the Western and Central Pacific Ocean.Evaluating the relationship between its abundance and environment factors using forecasting model is pivotal for sustainable exploration of this species.According to the catch data of skipjack tuna in the Western and Central Pacific during 1998-2013, we used catch per unit effort (CPUE) as an indicator of abundance and analyzed the grey correlation between each environmental factor and CPUE.The optimal model was constructed by choosing suitable environmental factor and comparing the prediction of multiple grey forecasting models with different environmental factors.The results showed that the catch of skipjack tuna gradually increased year after year, whereas CPUE fluctuate dramatically within years.The model M1 including four environmental factors, sea surface temperature, sea surface height, chlorophyll-a, and sea surface temperature anomaly in Nino3.4, was the best model among models with multiple environmental factors, the model's mean relative error was 6.4752 and correlation was 0.687 4between fitting abundance sequence and predict abundance.The model S2 eliminating SST in November and containing that of May and June, was the best model among the models with single environmental factor, the model's mean relative error was 7.419 2and correlation was 0.791 0 between fitting abundance sequence and predict abundance.The model based on single environmental factor showed a stable and high correlation between actual and predict value, comparing with models based on multiple environmental factors.Therefore, the former forecasting model should be used as suitable model for the prediction of skipjack tuna abundance in the Western and Central Pacific Ocean.
Landform of fishing ground is an important reference in analyzing fishery forecast and selecting fishery operation methods and fishing gears.In this paper,based on the techniques of digital elevation modeling(DEM),digital relief shading and ESRI ArcGIS software,the DEM interpolation algorithm and shadow light source parameters are selecteal by experimental methods.Marine fishery geomorphic map is created,which can vividly describe the fluctuation of seafloor topography and fish biology resources distribution,to achieve a fusion of multi-source,multi-dimensional and heterogeneous data.As an exploring program,the study results are expected to provide valuable reference for the development and application of related products in the future.
讨论了近年来在《GPS测量原理与应用》课程教学中进行理论与实践结合教学的重要性,并列举了几个理论与实践教学实例,总结了课程教学中存在的一些问题,并提出了今后的改进方法.
Central-western Pacific Ocean is an important fishing area for skipjack tuna(Katsuwonus pelamis)purse seine fisheries.Accurately forecasting the central fishing ground can help fishery fleets improve their fishing efficiency. According to the production statistical data of skipjack in the central-western Pacific Ocean during 1998 – 2013 and related oceanographic condition, 22 BP neural networks are constructed to compare the forecasting effects between Catch per unit of effort (CPUE) and fishing effort as output factors, respectively. The results showed that the value of minimum residuals in the forecasting models based on fishing effort were all lower than those based on CPUE, which represent that the fishing effort is better considered as the indicator of fishing ground. It is also found that the mean value of fitting residuals decreased as the number of input factors increased, which also show that the selected environmental variables in this study(month, sea surface temperature SST, sea surface height SSH, Nino3.4 index, Chl-a)are the important indicators affecting the distribution of skipjack. The BP neural network with a structure of 7-5-1 was the most suitable for forecasting fishing ground with a highest accuracy and lowest residuals. The significance of longitude, Chl-a, SST, latitude, Nino3.4 index, SSH and month vary from high to low.
《海洋大地与控制测量》课程是上海海洋大学海洋测绘专业在《大地测量学基础》课程基础上发展起来的重要本科专业课程之一.通过近几年来的《大地测量学基础》教学,以及本学年度《海洋大地与控制测量》教学,提出了基于编程、制作PPT和出试卷互考等教学举措,以期提高学生对海洋大地测量等相关知识的理解与掌握.
通过近几学期上海海洋大学全校公共选修课程《GNSS发展与应用》的教学实践,从授课内容、激发学生积极性以及授课方式等方面进行了初步总结,提出总结了课程教学中存在的一些问题,并提出了今后的改进方法.
The west-central Pacific Ocean is the world's most important fishing ground for skipjack tuna (katsuwo-nus pelamis ),this fishing area is always impact by ocean environment,especially sea surface temperature (SST) and Ni?o 3.4 index(SSTA ).However,the fishing ground of skipjack tuna is widely distributed in the waters of many island countries,how to scientific guide the entry-fishing is an important studying object.According to the production data of skipjack tuna in the west-central Pacific Ocean during 1995—2012,and the total of 22 fishing zones (5°×5°)with the high catch are selected to analyze the spatial variation of fishing effort for skipjack tuna in central-west Pacific Ocean.The percentage of fishing effort is also regarded as the index of entry-fishing,and the optimal entry-fishing model between the index of entry-fishing and SST or SSTA is established.The results showed that main fishing efforts were focused in the area of 5°S-5°N in the direction of latitude,accounting for 87.4% of the total fishing effort.The area of 130°-140°E was the major fishing zone area in the longitudinal direc-tion,accounting for 45.08% of the total fishing effort in the 22 fishing zones.The relationships between the index of entry-fishing and SSTA or SST all showed the normal distribution (P <0.01)for each fishing zone.The suitable value of SSTA model was on early 0.25℃,and the suitable value of SST model was nearly 29.5℃.For the top 10 ranking of entry-fishing index,we find that the actual index and predicted value is the same.It is concluded that this entry-fishing forecasting model can effectively predict fishing area distribution,which could give us a suitable advice for fisheries industries in the future.
针对"海图学"的课程特点,制订了"海图学课程设计"的教学内容及实作方案.通过学生应用课堂所学的理论知识、IHO相关国际标准、专业软件等,培养他们创造性思维和实践动手能力.从多年的实际教学效果看,达到了课程建设的预期目标.
地理空间信息科学和技术是海洋渔业信息化研究与应用的重要领域之一.移动地理信息系统技术的发展为海洋渔业信息化建设提供了基础支持,促进了海洋渔业综合信息的互联互通和信息服务模式的转变.基于智能移动设备和Mobile GIS技术,提出了应用ArcGIS API for Android开发组件和Java编程语言设计渔业电子海图手持终端的技术方案,并介绍了实现的Web浏览器、渔业模式和导航模式等主要功能.
T he constitution ,general scheme and functional model of a new fishery elec‐tronic chart system are presented based on the research of development status of fishery electronic chart system at home and abroad ,and the key technologies and methods for developing this system by using Visual C++ 2010 development environment and ECIVMS component are introduced on the basis of the electronic chart with IHO S‐57 chart international standard (i .e .the Transfer Standard for Digital Hydrographic Da‐ta) .The design and implementation of the system show that several main functions such as display of chart object layer ,query of fishery information ,management of fishing da‐tabase ,isobath setting for fishery safety operation ,loading of remote sensing image ,re‐al‐time calculation of tide and superposition and display of sea state information are real‐ized by the software ,and basic support would be provided both for the fishery informa‐tion networking and services and for the platform construction for the acquisition ,stor‐age ,processing ,expression ,transmission and release of integrated information .
 Rencan Peng合作论文数14
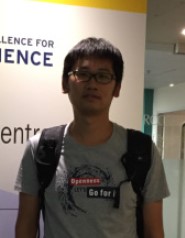 Liang Chang (常亮)合作论文数College of Marine Sciences, Shanghai Ocean University12
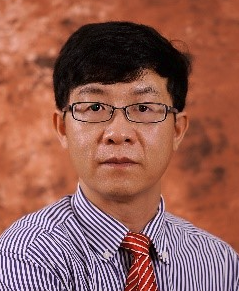 Xinjun Chen (陈新军)合作论文数College of Marine Living Resource Sciences and Management, Shanghai Ocean University;Key Laboratory of Sustainable Exploitation of Oceanic Fisheries Resources, Ministry of Education, College of Marine Sciences, Shanghai Ocean University6Yi Chen (陈轶)合作论文数6YangYang Chen (陈洋洋)合作论文数5GuoHui Liu (刘国辉)合作论文数5Guiping Feng (冯贵平)合作论文数College of Marine Sciences, Shanghai Ocean University5
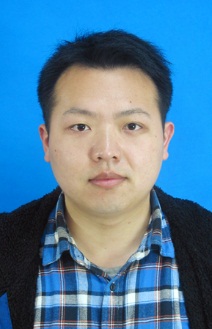 Zhou Fang (方舟)合作论文数College of Marine Sciences, Shanghai Ocean University5Ruifang ZHU (朱瑞芳)合作论文数4
 Weidong Zhu (朱卫东)合作论文数College of Marine Sciences, Shanghai Ocean University4CHEN Jianwen (陈建文)合作论文数3ZHU Shuying (朱书颖)合作论文数3WU Wanting (吴婉婷)合作论文数3Jiawei YANG (杨佳伟)合作论文数3HongSheng Cui (崔洪生)合作论文数3GaoSong Cui (崔高嵩)合作论文数3Wei Shen (沈蔚)合作论文数3Jin Zhang (张进)合作论文数3Yanfei FU (付燕飞)合作论文数2Si-yu XIA (夏思雨)合作论文数2ZHANG Ming (张明)合作论文数2ZiPeng Chen (陈子澎)合作论文数2Zhen Tian (田震)合作论文数2Wangjun Gao (高王军)合作论文数2r c peng合作论文数1Gaixiao Li合作论文数1Yangnan WANG (王杨楠)合作论文数1Xiao Weiping (肖卫平)合作论文数1Caixia Yu合作论文数1Pei-yuan LI (李佩原)合作论文数1xianjie chen (陈先杰)合作论文数1Yifan WANG (王易帆)合作论文数1LiangQi Xu (徐良琦)合作论文数1XiangQi Kong (孔祥旗)合作论文数1YanChun Liu (刘雁春)合作论文数1YiDong Zheng (郑义东)合作论文数1Mo Wang (王沫)合作论文数1MingHui Li (李明辉)合作论文数1QingWei Li (李庆伟)合作论文数1Feng Gao (高峰)合作论文数College of Marine Sciences, Shanghai Ocean University1
 Jianfeng Tong (童剑锋)合作论文数College of Marine Sciences, Shanghai Ocean University1
 Zhenge Qiu (邱振戈)合作论文数College of Marine Sciences, Shanghai Ocean University1Xinru Tu (涂辛茹)合作论文数College of Marine Sciences, Shanghai Ocean University1Jintao Wang (汪金涛)合作论文数College of Marine Sciences, Shanghai Ocean University1
 Jiayao Wang (王家耀)合作论文数Henan Industrial Technology Academy of Spatio-Temporal Big Data;Faculty of Geographical Science And Engineering, Henan University1Ran Wang (王冉)合作论文数1Fanchou Han (韩范畴)合作论文数1




