Due to the blade reflection effect when applying the PIV technology to the internal flow field measurement of rotating machinery, the blade area requires special treatment. In this paper, zero-value, particle image, random number, and mean-value masking methods are compared and analyzed based on particle images from the PIV challenge and rotating impeller. The peak significance and coordinates deviations are used as the masking effect evaluation criteria. The results indicate that an increase in the interrogation window masking area proportion causes a weakening of the PIV calculation particle cluster displacement peak value. The peak position is shifted, which leads to the wrong velocity vector. The masking area proportion should not be higher than 0.7, 0.5, 0.19, and 0.22 for mean-value, random number, zero-value, and particle image masking methods, respectively. The results show that flow field calculation results near the blade boundary are more accurate for mean-value masking.
: A modified STRUCT turbulence model (MST model) for efficient engineering computations of turbulent flows with rotation and curvature is proposed in this paper. The MST model switches between URANS and LES-like modes using a new damping function to adjust the turbulent viscosity. Compared with the original STRUCT method, the modifications are as follows: (1) the BSL k-ω model with the Spalart-Shur correction is chosen as the new baseline to improve the sensitivity to rotation and curvature; (2) a new adaptive time-scale ratio is proposed to avoid the arbitrariness of geometric averaging operation in the original method; (3) the normalized helicity is introduced into the new damping function to detect the energy backscatter phenomenon. Five classical high Reynolds number flow cases are tested. The results show that the turbulent viscosity of flow in the massively separated regions modeled by the MST model is reasonably reduced, and LES-like mode is activated, which captures more turbulent vortices and fluctuations on the URANS grids. With high efficiency and robustness, the MST model inherits the advantages of the original STRUCT method and improves the prediction accuracy of turbulent flows with rotation and curvature, which enables efficient engineering computations of the turbulence in hydraulic rotating machinery.
A modified STRUCT (MST) turbulence model for efficient engineering computations of turbulent flows in hydro-energy machinery is proposed in this paper. The MST model switches between URANS and LES-like modes using a new damping function to adjust the turbulent viscosity. Compared with the original STRUCT method, the modifications are as follows: (1) the BSL k-omega model with the Spalart-Shur correction is chosen as the new baseline to improve the sensitivity to rotation and curvature; (2) a new adaptive time-scale ratio is proposed to avoid the arbitrariness of geometric averaging operation in the original method; (3) the normalized helicity is introduced into the new damping function to detect the energy backscatter phenomenon. Five classical high Reynolds number flow cases are tested. The results show that the turbulent viscosity of the MST model is reasonably reduced in the massively separated regions and LES-like mode is activated, which captures more turbulent vortices and fluctuations on the URANS grids. With high efficiency and robustness, the MST model inherits the advantages of the original STRUCT method and improves the prediction accuracy of the turbulence with rotation and curvature, which enables efficient engineering computations of turbulent flows in hydro-energy machinery.
Precision variable-rate spraying technology is needed for controlled-environment plant production in greenhouses. An experimental spray system for greenhouse applications was developed for real-time control of individual nozzle outputs. The system mainly consisted of a high-speed laser scanning sensor, 12 individual variable-rate nozzles, an embedded computer, a spray control unit, and a 3.6 m long mobile spray boom. Each nozzle was coupled with a pulse-width modulated solenoid valve to discharge sprays at variable rates based on target presence and plant canopy structure. Laboratory tests were conducted to evaluate the accuracy of the spray control system in respect to spray delay time, nozzle activation, and spray volume using four target objects of different regular geometrical shapes and surface textures and two artificial plants of different canopy structures. Other experimental variables included three detection heights from 0.5 to 1.0 m and five sensor travel speeds from 1.6 to 4.8 km h(-1). A high-speed video camera was used to determine the delay time and nozzle activation in discharging sprays on target objects after the laser sensor had detected the objects. The detection height and travel speed were found to have slight influence on the timing of nozzle activation. The nozzles started spraying in a range between 33 and 83 mm before reaching the target objects and stopped spraying between 13 and 84 mm after passing the objects, ensuring that the objects were fully covered by the spray. Spray volume corresponded to the object sizes well, and the spray control system performed with higher accuracy at lower travel speeds. Differences between the calculated spray volume based on the sensor detection and the actual spray volume ranged from 1.9 to 2.7 mL per object among all tested objects. The variable-rate control system reduced spray volume by 29.3% to 51.4% for all the objects compared with conventional constant-rate spraying. At the same time, the nozzles could be activated precisely by the object presence. Consequently, this experimental laser-guided system was implemented on a boom system in a commercial greenhouse for future investigations of its accuracy in variable-rate spraying to save pesticides, water, and nutrients.
Precise measurement of plant dimensions can provide essential information for variable-rate spray application technologies to discharge the amounts of chemicals actually needed by the plants. The accuracy of a 270 degrees radial laser scanning sensor combined with a specially-designed plant surface mapping algorithm was evaluated in detection of complex-shaped object surfaces and sizes. Data acquisition and three-dimensional (3-D) image construction were supported with the specially-designed algorithm. The objects in the test were toy balls with a pink smooth surface, light brown rectangular cardboard boxes, black and red texture surfaced basketballs, white smooth cylinders, and two different sized artificial plants. Test variables included four different detection heights (0.25, 0.5, 0.75 and 1.0m) above each object, five sensor travel speeds (1.6, 2.4, 3.2, 4.0 and 4.8 km h(-1)), and 8-15 horizontal distances to the sensor ranging from 0 to 3.5 m. Horizontal distances of the objects to the laser sensor influenced the accuracy significantly, and the influence became weaker when the objects were closer to each other. The color and finish of object surfaces did not apparently affect the sensor detection accuracy. The average root mean square error (RMSE) and coefficient of variation (CV) in the laser sensor travel direction and object height direction varied slightly with detection heights, travel speeds, and object positions. The highest RMSE and CV were 83 mm and 50.9% in the horizontal direction, 41 mm and 15.2% in the travel direction, and 16 mm and 14.0% in the height direction, respectively. These tests demonstrated the potential adaptation of the laser scanning sensor and the specially-designed algorithm to measure complex-shaped targets for future development of automatic spray systems to achieve variable-rate functions in greenhouse applications.
Canopy edge profile detection is a critical component of plant recognition in variable-rate spray control systems. The accuracy of a high-speed 270° radial laser sensor was evaluated in detecting the surface edge profiles of six complex-shaped objects. These objects were toy balls with a pink smooth surface, light brown rectangular cardboard boxes, black and red texture surfaced basketballs, white smooth cylinders, and two different sized artificial plants. Evaluations included reconstructed three-dimensional (3-D) images for the object surfaces with the data acquired from the laser sensor at four different detection heights (0.25, 0.50, 0.75, and 1.00 m) above each object, five sensor travel speeds (1.6, 2.4, 3.2, 4.0, and 4.8 km h−1), and 8 to 15 horizontal distances to the sensor ranging from 0 to 3.5 m. Edge profiles of the six objects detected with the laser sensor were compared with images taken with a digital camera. The edge similarity score (ESS) was significantly affected by the horizontal distances of the objects, and the influence became weaker when the objects were placed closer to each other. The detection heights and travel speeds also influenced the ESS slightly. The overall average ESS ranged from 0.38 to 0.95 for all the objects under all the test conditions, thereby providing baseline information for the integration of the laser sensor into future development of greenhouse variable-rate spray systems to improve pesticide, irrigation, and nutrition application efficiencies through watering booms.
An experimental spray system for greenhouse applications was developed with an integration of a high-speed laser scanning sensor to control real-time spray outputs of 12 individual nozzles on a 3.60 m long horizontal spray boom. Each nozzle was coupled with a pulse width modulated solenoid valve to discharge variable rates based on the presence and plant canopy structures. Laboratory tests were conducted to validate the control system accuracies in spray response time, spray volume and activation by single and group of objects under the combinations of three laser detection heights (0.5, 0.75 and 1.0 m), and five constant travel speeds (1.6, 2.4, 3.2, 4.0 and 4.8 km h-1). A high-speed video camera recorded sequential images to determine nozzle activations in discharging sprays on target objects after the laser sensor detected the objects. The laser detection height and travel speed had slight influences on times when nozzles started and stopped spraying objects. The nozzles started spraying in a range from 33±36 mm to 83±62 mm before reaching the target objects, and stopped spraying in a range from 13±30 mm to 84±61 mm after passing the objects, ensuring the objects being fully covered by the sprays. The spray volume corresponded to the object sizes well. The difference between VD and VR ranged from 1.9 to 2.7 mL for all the objects. At the same time, the nozzles could be activated precisely by the object presence. The spray control system performed with higher accuracy at lower speeds. The abstract is often the only part of the paper to be read, so include your major findings in a useful and concise manner. Include a problem statement, objectives, brief methods, quantitative results, and the significance of your findings. The abstract should be no more than 250 words long.
The use of machine vision technology for nondestructive online measurements of cucumber parameters was investigated. This technology was first used to capture images of a cucumber canopy. Next, a segmentation algorithm (excess green minus excess red (ExG-ExR)) was used to extract the cucumber canopy area and image parameters (i.e., coverage ratio, canopy length and canopy width). These parameters were combined with those obtained by manual measurements (i.e., stem height, stem diameter, leaf number, and fruit number) to generate five inversion models for four cucumber growth parameters. The results showed that the ExG-ExR segmentation method yielded a 99.5% contact ratio and a 98.2% recognition rate in the extraction of the cucumber canopy region. The inversion models were validated with new images using the following three different cultivation modes: 4 × 2, 4 × 3 and 4 × 4. The inversion results showed that the coefficients of determination (R2) between the measured values and inversion values of stem height, stem diameter, leaf number, and fruit number exceeded 0.921, 0.899, 0.95 and 0.908, respectively. Thus, the inversion method can provide nondestructive online measurements of cucumber parameters.
To improve the efficiency and accuracy of water-nutrient mixing, a multi-channel fertigation machine was designed; the hardware includes a programmable logic controller (PLC), a touch system and multi-channel sensors. A sectional forecast control algorithm based on the nutrient dilution model was proposed to control the fertigation machine. When the 100-fold concentrated nutrient solution was diluted by a factor of 20–200, the results showed that the standard deviations of the electrical conductivity (Ec) and the pH for four repeat measurements were 0–0.4 mS cm−1 and 0.057–0.12, respectively; therefore, the performance of the nutrient solution was stable. When the target Ec values were 1.0, 1.5, 2.0, 2.5, 3.0 and 4.0 mS·cm−1, the variation coefficients relative to the target Ec values for three repeat measurements were 2%, 0.94%, 0.87%, 0.63%, 2.37% and 1.8%, respectively. The multi-channel water-nutrient mix resulting from the sectional forecast control algorithm was precise; the error of the Ec was less than 0.05 mS·cm−1, which satisfies the requirements of fertigation for soilless cultivation in greenhouses.
针对作物蒸腾速率与温室环境参数间非线性耦合时延性关系,以温室环境参数:空气温度、空气湿度、太阳辐射度、土壤温度、叶面温度、土壤含水量的时间序列为输入量,温室黄瓜蒸腾速率时间序列为输出量,采用小波分解重构方法,分别建立低频时间序列和高频时间序列的非线性自回归动态神经网络(NARX)子网络预测模型,以子网络的预测叠加值为蒸腾速率预测值.结果表明:1层小波分解重构的低频时间序列A1和高频时间序列D1的子网络预测值与蒸腾速率分解重构目标值间相关性决定系数R2分别为o.949和0.853,平均绝对误差(MAE)分别为5.36和2.00 g·h-1.2层小波分解重构的低频时间序列A2和高频时间序列D2的子网络预测值与蒸腾速率分解重构目标值间相关性决定系数R2分别为0.983和0.849,MAE分别为2.88和2.56 g·h-1.1层小波分解重构的时间序列的NARX子网络预测值合成值(A1+D1),2层小波分解重构的时间序列的NARX子网络预测值合成值(A2+D2+D1)和未小波分解重构的原时间序列的NARX预测值与蒸腾速率测量值间相关性决定系数R2分别为0.945、0.974和0.857,MAE分别为5.76、4.42和10.09 g·h-1.小波分解重构的高频和低频时间序列预测合成,能够提高时间序列的预测准确性.同时采用相同网络结构的BP神经网络和NAR动态神经网络预测蒸腾速率时间序列,其预测值与测量值间决定系数R2分别为0.596和0.839,MAE分别为19.55和9.45 g·h-1.NARX预测性能优于NAR和BP神经网络的预测性能,能够应用该方法预测温室黄瓜的蒸腾速率.该方法可推广至多变量非线性强耦合时延性系统中的变量预测.
In order to perform online and nondestructive measurements of the parameters of flora, the use of machine vision technology was investigated. This technology was used to capture the image of a flora canopy, and then three segmentation algorithms: Excess Green (ExG) minus Excess Red (ExR), ExG, and normalized difference indices (NDI) were used to extract the canopy area of the flora. The ExG and NDI used an Otsu threshold value to obtain a binary image, and the ExG-ExR used a fixed threshold value to obtain a binary image. Flora canopy characteristic parameters (covering ratio, canopy length, and canopy width) were extracted based on the projection profile of the canopy leaves extracted by the flora canopy segmentation methods. These were combined with the parameters of the flora obtained by artificial measurement: stem height, stem diameter, leaf number, fruit number, and LAI (fitting value), to form five types of inversion models for the five growth parameters of the flora. The inversion models were based on the covering ratio, canopy width, and canopy length, and a regression equation established by three parameters of the flora and an average inversion model were established. The results showed that the contact ratio and recognition rate of extraction of the flora canopy region, using the segmentation method ExG-ExR, were more than 99.5% and 98.2%, respectively. Furthermore, identification of the flora canopy was accurate, and there were very few mistakenly identified areas. No matter when the image was captured, the recognition performance of the flora canopy image was stable, and the performance was superior to the methods ExG+Otsu and NDI+Otsu. The contact ratio of the ExG+Otsu segmentation method ranged from 72.7% to 93.5% and recognition rate was 71.1%-90.2%, and showed a small amount of leakage and error used to partition the flora canopy figures. The contact ratio of the NDI+Otsu segmentation method ranged from 99.9% to 100%, however, the scope of the recognition rate was 13.1%-89.2%, and showed a high incidence of false recognition and unstable performance. Inversion models were validated using 120 new images. The inversion results showed that the regression coefficient between the inversion value and the measured value was greater than 0.958 when using the inversion model of the flora canopy covering ratio. The performance of the flora canopy covering ratio was superior to the inversion models of canopy width and canopy length. The inversion model using the regression equation and the average model were the only two parameters that were better than the inversion model of the covering ratio. Between the inversion values of stem height, stem diameter, leaf number, fruit number, LAI, and the measured values of each, the regression coefficient were 0.979, 0.976, 0.979, 0.965, and 0.973, respectively, and the SEwere 10.55 cm, 1.37, 0.213 mm, 0.672, and 0.055, respectively. The inversion method, based on machine vision technology, can achieve online and nondestructive measurements of the parameters of flora, which can provide significant advances in controlling the greenhouse environment and precise fertigation.
 Xiaochan Wang (汪小旵)合作论文数College of Engineering, Nanjing Agricultural University8
 Chen Man合作论文数4
 Guoxiang Sun (孙国祥)合作论文数College of Engineering, Nanjing Agricultural University4Peter P. Ling合作论文数4
 Heping Zhu合作论文数United States Department of Agriculture4Li Sun (孙力)合作论文数3Yu Zhang (张瑜)合作论文数3
 Fujun Wang (王福军)合作论文数College of Water Resources and Civil Engineering, China Agricultural University3
 Chaoyue Wang (王超越)合作论文数College of Water Resources & Civil Engineering, China Agricultural University2Chen JingBo合作论文数2
 Xue Li合作论文数2
 Yinyan Shi (施印炎)合作论文数College of Engineering, Nanjing Agricultural University2
 Yongbo Li (李永博)合作论文数College of Artificial Intelligence, Nanjing Agricultural University2
 Chenfeng Li合作论文数Zienkiewicz Institute for Modelling, Data and AI, Swansea University2
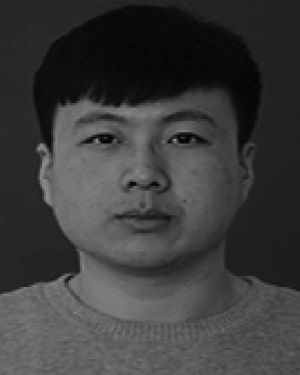 Xiao-Dong Liu合作论文数China Agr Univ, Coll Water Resources & Civil Engn, Beijing 100083, Peoples R China1LI Xue (李雪)合作论文数1Jiao Di (狄娇)合作论文数1
 Qiang Zhong (钟强)合作论文数College of Water Resources and Civil Engineering, China Agricultural University1
 Wei Yang (杨魏)合作论文数College of Water Resources & Civil Engineering, China Agricultural University1
 Yaojun Li (黎耀军)合作论文数College of Water Resources & Civil Engineering, China Agricultural University1Zhichao Zou合作论文数1
 Zhuqing Liu (刘竹青)合作论文数College of Agricultural Equipment and Energy Engineering, Northeast Agricultural University1




