Electrical resistivity tomography (ERT) has been shown to be effective for surveying and monitoring dams, due to the method's sensitivity to moisture content and relevant physical properties (e.g., porosity). Automated ERT systems, capable of time-lapse monitoring, can be used to detect variations in ground conditions. However, dam environments are often structurally heterogenous due to, for example, zoned embankments, supporting bedrock or concrete structures and adjoining headponds. If such factors are not accounted for, off-grid effects may obscure and distort features of interest (e.g., leakage zones) in resulting ERT images. Synthetic modelling simulating conditions at Mactaquac Dam, Canada, was carried out to evaluate whether the abutting concrete structure and properties of the adjacent headpond (water resistivity and level variations) need to be accounted for in an inversion of ERT data. This was achieved through a synthetic numerical model of the dam, including headpond, concrete abutment, core and dry and wet rockfill components. The results show that internal features and dynamic changes through time (e.g., headpond level and resistivity variation) can induce 3D effects in the inversions, which have the potential to be misinterpreted. The modelling revealed that leakage zones could be resolved, showing that features of interest in dam monitoring can still be identified despite potential 3D effects. Overall, these results show that 3D effects from internal structure and a water body are likely to distort modelled resistivity distributions in dam settings. This research sheds light on how ERT can be impacted by structural complexity in dams, using synthetic modelling to understand and quantify the nature of expected artefacts resulting from heterogeneities outside the footprint of the survey area.
Soil structure governs water storage, aeration, root growth, trafficability, nutrient transport, and carbon stabilization, but agricultural monitoring still relies largely on sparse, destructive, and labor-intensive measurements. Digital imaging, spectroscopy, geophysics, in situ sensors, proximal sensing, and remote sensing now provide multiscale observations, yet converting them into reliable structural information remains limited by sparse ground truth, scale mismatch, domain shift, and inconsistent validation. This structured narrative review synthesizes how artificial intelligence (AI) transforms these heterogeneous observations into useful soil structure information for agricultural monitoring and management. We organize the literature around a sensor-to-decision workflow: observation, representation, scaling, discovery, and decision-making. At the pore scale, deep learning improves image enhancement, segmentation, and reconstruction of pore and aggregate architecture from imaging technologies. At pedon and field scales, machine learning links spectra, geophysical signals, mobile proximal sensors, and in situ time series to structural proxies and subsurface states. At landscape scales, AI enables data fusion, downscaling, and transfer learning from UAV, satellite, LiDAR, and mobile sensing platforms. We further examine how physics-guided learning, uncertainty quantification, explainable AI, surrogate modeling, and soil digital twins can improve transferability and support management of transport processes, mechanical resilience, and biological carbon dynamics. By linking sensing modality, AI method, validation design, and management applications, this review provides practical guidance for selecting deployable soil structure monitoring workflows for compaction avoidance, irrigation management, trafficability assessment, carbon stabilization, and resilience monitoring.
High-frequency induced polarization (HFIP) measurements enable quantification of ground ice content in frozen media by capturing ice relaxation within the frequency range of 1 to 100 kHz. Existing parametrized inversion approaches may bias results by imposing an ice relaxation signature where none exists, assuming a Cole-Cole-type response that may not reflect the true dielectric behaviour of ice, and neglecting low-frequency polarization. These limitations can lead to high data misfits and ambiguities in interpretation. This study presents an alternative approach that applies independent frequency inversion to directly derive complex resistivity spectra from field measurements, avoiding reliance on pre-defined models. The resulting inverted spectra provide a representation that more closely captures the true subsurface response. A second, petrophysical, inversion is then performed by fitting a two-component mixture model to the inverted spectra, weighted by the volumetric fractions of its components. One of these components is ice, allowing for the estimation of the volumetric ice content.The approach was applied at Heliport Mire (Abisko, Sweden), a permafrost peatland site, using two complementary profiles: a 50-m 2-D profile that captured broad lateral variations of frozen to unfrozen conditions, and an 8-m high-resolution 2-D profile that resolved the vertical transition between the upper unfrozen and underlying frozen layers. Independent frequency inversion, across 1 Hz to 57 kHz, successfully produced smooth, coherent spectral responses of true resistivity and phase shift across both profiles. Petrophysical inversion results show diverse conditions along the profile, identifying three distinct zones: ice-rich frozen peat (40-77 per cent ice content), a thawed or degraded peat region ( <10 per cent ice content) and unfrozen forest ( <5 per cent ice content, effectively representing ice-free conditions). HFIP-derived ice content values were consistent with those derived from laboratory measurements on a permafrost core extracted along the profile. The high-resolution profile distinctly identified the boundary between unfrozen and frozen ground, as confirmed by direct probing measurements. Additionally, the petrophysical model resolves parameters such as shape factor and matrix permittivity, offering further insight into subsurface properties. This methodology advances ground ice characterization by providing robust quantitative estimates of ice content while retaining spectral information with broader interpretative potential.
Abstract In situ remediation of contaminated soil and groundwater demands real‐time monitoring to capture complex subsurface dynamics. Geophysical methods, particularly electrical resistivity tomography (ERT) and induced polarization (IP), offer non‐ or minimally invasive, high‐resolution imaging of subsurface changes during remediation. This is the first review to synthesize advances in geophysical monitoring of four key technologies: in situ chemical oxidation/reduction (ISCO/ISCR), in situ bioremediation (ISB), in situ thermal remediation (ISTR), and permeable reactive barriers (PRB). We systematically examine how variations in hydrogeology, temperature, hydrochemistry and contaminant indicators influence electrical responses, and discuss the principles, advantages, and limitations of ERT/IP for each technology. Based on a bibliometric analysis of over 200 studies, we identify current trends, critical challenges, and future research directions. Integrating geophysical methods with direct sampling is essential to transform electrical signatures into actionable insights for remediation management. Continued progress will be made via advances in petrophysical relationships, multi‐source data fusion coupled inversion frameworks, and the application of artificial intelligence and machine learning approaches to enable real‐time, adaptive remediation strategies.
There is increasing interest in delivering greater resilience to climate change through integrated catchment management that includes Nature-based Solutions (NbS) such as riparian buffer strips, tree-planting and wetlands. Governmental organisations also seek to use water quality modelling to understand the mass of different pollutants avoided per feature for appraisal of nutrient-neutrality purposes, but the assessment of efficacy is not yet fully developed, nor is it clear what it implies at the catchment-scale. We introduce three open, freely distributable models to help understanding efficacy and risk-reduction of buffer-strips at the plot (JUMP), waterbody (Fieldmouse), and national (HYPE) scales to help understand risk-reduction and help objectively quantify improvements in catchment resilience. These approaches have been developed across a range of projects but are also being investigated in more detail as part of the modelling element to the NERC Freshwater Quality programme QUANTUM project. Here we report how the particle tracking model predicts the need for very slow velocities, high loss rates or other processes to achieve buffer strip efficacies in common use-slowing the flow alone is unlikely to achieve these results. Upscaling these results to the catchment scale on the Yeo highlights another significant concept, that of the need to define a catchment scale efficacy for a particular Nature-based Solution, given the practicalities of implementation. We demonstrate how HYPE can be used to target and model mitigations and permits both upscaling nationally and through-time source apportionment to help identify when design efficacies may not be achieved in practice.
Groundwater nitrate pollution threatens drinking water safety. Legacy nitrogen (N) in the vadose zone creates a "long tail" of leaching that can persist for decades after policy actions. Here we model global nitrate dynamics in groundwater from 1961 to 2100. By 2020, shallow aquifers had accumulated 162 ± 6 Tg N as nitrate, exceeding the WHO drinking water limit across 10% of global land area. This contamination is sustained by a large nitrate reservoir of 4037 ± 214 Tg N in the vadose zone, which will continue to generate new contamination hotspots for decades. Even under an immediate transition to zero-N-surplus, 4% of affected regions are projected to remain above the WHO limit beyond 2100. To guide effective governance, we classify global croplands into four management archetypes and identify tailored strategies that balance water quality, food security, and soil sustainability. These findings redefine the temporal scope of governance, identify priority regions, and provide a science-based roadmap towards safe groundwater.
Electrical resistivity tomography (ERT) is a widely used and effective tool for hydrogeological investigations. Conventional ERT inversion approaches are based on gradient-based algorithms, which typically provide deterministic optimal solutions, which are subject to uncertainty. Such uncertainty could have significant impact on hydrogeological interpretation using ERT. Model appraisal is a critical step after inversion, however, conventional appraisal methods are qualitative and thus subjective. To address these limitations, this study introduces a probabilistic variational inference method, referred to as Stein variational gradient descent (SVGD), to quantify both resistivity distributions and associated uncertainties in ERT inversions. Synthetic examples are conducted to investigate the effects of configurations and noise, and to compare the performance of SVGD with conventional inversion and model appraisal techniques. A field case study and its model validation are also presented to demonstrate the practical advantages of uncertainty quantification in field. The results indicate that SVGD can effectively reduce artifacts introduced by regularization and provide more comprehensive quantitative insights into subsurface structures compared to conventional approaches. The study also reveals limitations in the interpretation of basic statistics of uncertainty estimates, highlighting the need to examine the entire posterior distributions of parameter values. Additionally, this study demonstrates that the final uncertainty arises from a trade-off among multiple factors, such as geometry of subsurface structures, measurement techniques and data noise levels. Finally, we also discuss some comparisons with other probabilistic frameworks in hydrogeophysics, highlighting its potential to improve uncertainty and probability quantification in ERT and possible future developments in hydrogeophysical coupled inversion.
In agricultural areas with poorly drained soils, subsurface tile drains are commonly installed to improve drainage but also serve as conduits that deliver excess nutrients to adjacent streams. Our goal was to understand the transport of phosphorus (P) along these flow paths by applying a novel mixture of tracers (including 866 g of conservative chloride (Cl), 3.4 g of potassium phosphate, and approximately 3.6x10¹¹ fluorescent micrometer-sized particles, or 49.5 g) to a farm field and sampling their breakthrough curves at the outlet to a stream, approximately 30 meters away. Simultaneously, we performed a 26-hour time-lapse electrical resistivity tomography (ERT) survey to monitor the saline tracer migration in three dimensions every 0.5 to 1 hour. The initial pulse of tracers had a mean arrival time of 21 minutes and transported 262 g of added Cl (28%), 0.65 g of dissolved P (17%), and 1.4x10¹⁰ particles (4%) to the tile drain outlet. A stochastic mobile-immobile model fit the anomalous (non-Fickian) solute breakthrough curves, where the mobile zone represents the macropore and tile drain network, and the immobile zone represents the soil matrix. Residence times in the immobile zone exhibited a heavy (power-law) tail. ERT images confirmed the retention of tracer mixture in soils after concentrations were no longer measurable at the tile drain outlet. Core samples suggest that 96% of particles and 21% of dissolved P were retained within 10.5 cm of the application location. Solutes and particles were remobilized over longer timescales during three successive storms. Exported masses of Cl and dissolved P at the tile drain outlet ranged from 1,490-12,300 g and 25.7-65.2 g, respectively, indicating flushing of older Cl and P stored in soils before the tracer experiment. Less than 0.01% of the added fluorescent particles were flushed during these storm events. This study indicates the wide range of P travel times through the subsurface in tile drained landscapes and the need to incorporate non-Fickian transport behavior in models.
Moisture induced landslides in clay slopes are generally driven by heterogeneity in both saturation levels and material properties and their arising complex and dynamic interactions in the subsurface. The use of time-lapse geophysical imaging can illuminate four-dimensional subsurface moisture dynamics and geotechnical property changes at the slope-scale, thereby complementing conventional geotechnical point sampling and sensing, and geodetic observations of the ground surface. Here we consider: (1) the development of novel time-lapse geoelectrical, seismic and fibre-optic geophysical imaging technologies for landslide monitoring; (2) in-situ and laboratory derived petrophysical relationships to enable geotechnical information to be estimated from geophysical models; (3) surface topography determination and ground deformation tracking using geodetic observations; (4) coupled geophysical-hydrological modelling of slopes; (5) perspectives and recommendations for the incorporation of integrated geophysical-geodetic-geotechnical technologies into landslide early warning systems – illustrated using results from a number of long-term field observatories.
The Frequency Domain Electromagnetic Induction method (FDEM) is an efficient tool for investigating the electrical conductivity (EC) distribution over relatively shallow depths. However, the handheld method of use recommended by manufacturers does not fully leverage the non-invasive detection capabilities offered by FDEM devices. In this study, an unmanned aerial vehicle airborne FDEM (UAV-FDEM) system is introduced, which enables an operator to conduct investigations at specific flight heights along planned routes. Since multi-coil FDEM instruments typically experience consistency issues among different coils, we propose a calibration method based on a multi-elevation UAV-FDEM approach. The approach circumvents the need for geophysical inversion during calibration, and has been successfully employed to calibrate two multi-coil instruments. We tested the multi-elevation UAV-FDEM survey approach at two sites: a riparian zone of Yangtze River and a hot spring area in Tibet. The results show that the UAV-FDEM survey findings are comparable with those obtained using electrical resistivity tomography (ERT). The surveys detected temporal changes in soil EC that correspond with observed groundwater levels changes, and successfully delineated the intrusion area and subsurface path of geothermal water. In comparison to conventional ground-based single-elevation measurements, the multi-elevation UAV-FDEM method clearly improves the deterministic coefficients (that is measures of resolution) for the inverted EC value of different soil layers, and reduces the uncertainty of the geophysical inversion results. UAV-based FDEM surveys are efficient for large or inaccessible areas, but their application can be limited by adverse weather and restricted flight endurance.
Agricultural land use and management changes significantly alter water and nitrate (NO3-) transport in the vadose zone (VZ) of the Earth's Critical Zone (CZ), thereby affecting groundwater recharge and quality. Here, we developed a multi-column modeling approach to estimate recharge and NO3- transport in the cultivated loess CZ of China's Guanzhong Plain (CGP), with a specific focus on the cropland-to-orchard transition. The model also quantified uncertainties in water and NO3- fluxes caused by variability in soil hydraulic parameters (SHPs). Evaluation against observations from 12 sites demonstrate good model performance. Relative to measured SHPs, uncertainties in groundwater recharge and NO3- leaching fluxes ranged from 3% to 86% when using SHPs derived from Rosetta and global data sets, with higher uncertainties in orchards than in croplands. Simulations based on measured SHPs identified the central and eastern CGP as hotpots of groundwater NO3- contamination. The shift from corn-wheat rotation to apple orchards increased NO3- leaching fluxes by 38 times while reducing groundwater recharge by 10%. Under both land-use scenarios, NO3- travel times through the VZ spanned decades to centuries, and the cropland-to-orchard transition extended it by 23 years for NO3- to reach the aquifer. Although this conversion delays NO3- transport to the aquifer, the elevated leaching flux increases the risk of groundwater NO3- pollution, especially in regions with shallow VZs and coarse soil texture. This study highlights the critical need for caution when implementing large-scale cropland-to-orchard conversions in the CGP and provides important insights for groundwater vulnerability assessments in regions with comparable hydrogeological and agricultural conditions.
Measurements of soil water content and salinity are important for a wide range of topics, in particular those concerned with soil and plant health, and specific aspects of agricultural management. However, most traditional methods are unsuitable for simultaneously mapping the field scale variability of soil electrical properties. In this study, we propose a method that uses an unmanned aerial vehicle (UAV) to support ground penetrating radar (GPR) antennae with different frequencies, allowing spatial scanning of surface reflection coefficients, which is then used to estimate the soil relative permittivity (epsilon r) and electrical conductivity (sigma). These parameters are then used to estimate soil water content and salinity using empirical transfer functions. Unlike other published approaches, the proposed method is relatively simple and does not rely on full-waveform inversion. Field tests in the riparian zone of the Yangtze River and salinized land close to the Yellow Sea are used to demonstrate the effectiveness of the method. The surveys illustrate that the UAV-GPR give results comparable to those measured in situ with a soil electrical property meter. These findings are supported by accuracy analysis using Monte Carlo simulation which reveal that the measurement error of epsilon r increases with sigma, and the relative errors in sigma measurements are generally less than those of epsilon r except in areas of high epsilon r and low sigma. The study provides an approach for mapping soil electrical properties using UAV technology, thus opening up the possibility of remote sensing of spatial variability of these important properties at high spatial resolution.
Robust and timely assessment of the condition of geotechnical infrastructure assets (e.g. cuttings, embankments, dams) is essential for cost effective maintenance and engineering interventions to prevent failure events. Infrastructure slopes (in transportation, utilities and water management) are experiencing increasingly high levels of failure and require considerable resources to maintain; in the order of hundreds of millions of pounds per year in the UK alone. The issue of accelerating asset deterioration is being exacerbated by the greater prevalence of extreme weather events. Conventional monitoring techniques are still dominated by surface observations, which provide infrequent information and deliver very few insights into subsurface deterioration processes which typically precede surface expressions of deterioration. Here we describe the development of novel geoelectrical imaging technology to monitor and assess the internal condition of infrastructure slopes in four-dimensions. In particular, we outline a workflow in which time-lapse geophysical models are used to inform estimates of soil moisture and suction distributions, and we consider the challenges associated with the deployment of geophysical monitoring systems on operational geotechnical assets. Examples are given from long-term field experiments on transportation and water management earthworks. We propose that novel geophysical monitoring complements more traditional forms of asset assessment to significantly enhance the resilience of safety critical infrastructure through improved subsurface information provision and decision support.
A petrophysical model that accurately relates bulk electrical conductivity (sigma) to pore fluid conductivity (sigma w) is critical to the interpretation of geophysical measurements. Classical models are either only applicable over a limited salinity regime or incorrectly explain the nonlinear-to-linear behavior of the sigma(sigma w) relationship. In this study, asymptotic limits at zero and infinite salinity are first established in which, sigma is expressed as a linear function of sigma w with four parameters: cementation exponent (m), the equivalent value of volumetric surface electrical conductivity (sigma s), the volume fraction of overlapped diffuse layer (phi od) and parameter chi representing the ratio of the volume fraction of the water phase to that of the solid phases in the surface conduction pathway. Subsequently, we bridge the gap between the two extremes by employing the Pad & eacute; approximant (PA). Given that parameter chi exhibits a marginal influence on the sigma(sigma w) curve, based on measurements for 15 samples, we identify its optimal value to be 0.4. After setting the optimal value of chi, we proceed to evaluate the performance of the PA model by comparing its estimates and estimates made by two existing models to measured values from 27 rock samples and eight sediment samples. The comparison confirms that the PA model estimates are more accurate than estimates made by existing models, particularly at low salinity and for samples with higher cation exchange capacity. The PA model is advantageous in scenarios involving the interpretation of electrical data in freshwater environments.
Critical Zone Observatories (CZOs) have been established initially in natural environments to monitor CZ processes. A new generation of CZOs has been extended to human-modified landscapes to address the impacts of climate change and human-caused actions such as erosion, droughts, floods, and water resource pollution. This review focuses on numerous plot, field, and regional scale studies conducted in the CZO facilities distributed across the China Loess Plateau (CLP). The CLP CZO features the world's largest and deepest loess deposits, highly disturbed by human activities, and consists of a longitudinal series of monitoring sites. This observation system consists of plot, slope, watershed, and regional observatories and is promoted by large-scale comprehensive experiments to achieve multiscale observations. Deep soil boreholes, hydro-geophysical tools, multiple tracers-based techniques, proximal and remote sensing techniques, and automatic monitoring equipment are implemented to monitor CZ processes. Observation and modeling of critical hydrological and biogeochemical processes (e.g., water, nutrients, carbon, and microbial activities) in land surface and deep loess deposits across CLP CZOs have unveiled crucial insights into human-environment interactions and sustainability challenges. Large-scale ecological efforts such as revegetation and engineering such as check dam construction have effectively mitigated flood and soil erosion while enhancing deep soil carbon sequestration. However, these interventions can yield both benefits and drawbacks, impacting deep soil water, groundwater recharge, and agricultural production. Converting arable cropland to orchards for increased income has raised nitrate accumulation in the deep vadose zone, posing a risk of groundwater pollution. These findings, combined with the CZ data, have identified knowledge exchange opportunities to unravel diverse factors within the relations of agriculture, ecosystem, and environment. These could directly improve local livelihoods and eco-environmental conditions by optimizing land use and management practices, increasing water use efficiency, and reducing fertilizer application. These efforts contribute towards Sustainable Development Goals (SDGs) and environmental policies. Overall, studies within the CLP have provided significant scientific advancements and guidance on managing CZ processes and services with regional SDGs, that may be transferable to other highly disturbed regions of the world.
Cold case searches for the missing can be challenging, especially when the convicted perpetrator may or may not be giving forensic investigators truthful information. This paper reports on a cold case search for a teenage girl who was reported missing during the mid-2000s in the north-west of the United Kingdom, with this being the second area searched following the disclosure of information by a suspect prison cellmate. The disused search area had many uses, including an animal sanctuary after the girl went missing. Initial police ground searches proved unsuccessful in locating the victim. Geoforensic search aims was to use geophysics to identify potential burial position(s) within the search site priority areas to be then forensically investigated. A multi-phased geoforensic search was conducted, initially forensic botany removed vegetation back to when the girl went missing, electromagnetic induction (EMI) surveys then identified potential burial areas, before ground penetrating radar (GPR) surveys were also collected in other areas to identify near-surface buried object positions. The EMI and GPR identified priority targets were then forensically excavated, with several isolated animal burials recovered and a drainage pipe identified to be cause of other geophysical targets, which gave confidence that any burials onsite could be identified geophysically. No case-relevant material was found. The case presented suggests these geoforensic approaches provide assurances to rule out forensic search locations, saving time and costs in such cold case investigations.
In agricultural areas with poorly drained soils, subsurface tile drains are commonly installed to improve drainage but also serve as conduits that deliver excess nutrients to adjacent streams. Our goal was to understand the transport of phosphorus (P) along these flow paths by applying a novel mixture of tracers (including 866 g of conservative chloride (Cl), 3.4 g of potassium phosphate, and approximately 3.6 x 10 11 fluorescent micrometersized particles, or 49.5 g) to a farm field and sampling their breakthrough curves at the outlet to a stream, approximately 30 m away. Simultaneously, we performed a 26-h time-lapse electrical resistivity tomography (ERT) survey to monitor the saline tracer migration in three dimensions every 0.5 to 1 h. The initial pulse of tracers had a mean arrival time of 21 min and transported 262 g of added Cl (28 %), 0.65 g of dissolved P (17 %), and 1.4 x 10 10 particles (4 %) to the tile drain outlet. A stochastic mobile -immobile model fit the anomalous (non-Fickian) solute breakthrough curves, where the mobile zone represents the macropore and tile drain network, and the immobile zone represents the soil matrix. Residence times in the immobile zone exhibited a heavy (power -law) tail. ERT images confirmed the retention of tracer mixture in soils after concentrations were no longer measurable at the tile drain outlet. Core samples suggest that 96 % of particles and 21 % of dissolved P were retained within 10.5 cm of the application location. Solutes and particles were remobilized over longer timescales during three successive storms. Exported masses of Cl and dissolved P at the tile drain outlet ranged from 1,490 - 12,300 g and 25.7 - 65.2 g, respectively, indicating flushing of older Cl and P stored in soils before the tracer experiment. Less than 0.01 % of the added fluorescent particles were flushed during these storm events. This study indicates the wide range of P travel times through the subsurface in tile drained landscapes and the need to incorporate non-Fickian transport behavior in models.
This study investigates the potential of field-based induced polarization (IP) methods to provide in-situ estimates of soil cation exchange capacity (CEC). CEC influences the fate of nutrients and pollutants in the subsurface. However, estimates of CEC require sampling and laboratory analysis, which can be costly, especially at large scales. Induced polarization (IP) methods offer an alternative approach for CEC estimation. The sensitivity of IP measurements to the surface properties of geological materials ought to make them more appropriate than DC resistivity and electromagnetic induction methods, that are sensitive to bulk electrical properties . Such abilities of IP are well demonstrated in the laboratory; however, applications are lacking at field scales. In this work, the ability of field-based IP to characterize the CEC of floodplain soils is assessed by implementing a methodology that allows for direct comparison between IP and soil parameters. In one field, soil polarization and CEC exhibited the expected positive correlation; but multi-frequency measurements showed no clear advantage over single-frequency measurements. In another field, coarser soils (with low CEC) exhibited a high polarization. These coarser soils were characterized by anomalous magnetic susceptibility values, and hence the polarization was attributed to the presence of magnetic minerals. Although better than order-of-magnitude estimates of CEC were possible in soils without substantial magnetic minerals, better characterization of porosity, saturation, cementation and saturation exponents, and pore fluid conductivity would improve predictions. However, the measurement of these parameters would require similar efforts as direct CEC measurements. This study contributes to bridging the gap between laboratory-derived relationships and their applicability in field applications. Overall, this work provides valuable insight for future studies seeking to understand polarization mechanisms in soils at the field scale.
Understanding the geological and hydrological conditions present within an unstable slope is crucial for assessing the likelihood of failure. Recently, geoelectrical characterization and monitoring of landslides has become increasingly prevalent in this context, due to the spatial sensitivity of electrical methods to critical hydro-mechanical parameters. We explore a situational relationship between resistivity and matric potential (or negative pore pressure), which is a key parameter in estimating the resistance to shear in geological materials, and gravimetric moisture content (GMC). We have chosen a well-characterized active landslide instrumented with geoelectrical monitoring technology, the Hollin Hill Landslide Observatory, situated in Lias rocks in the southern Howardian Hills, United Kingdom. We report on petrophysical relationships between porosity, GMC, electrical resistivity, and matric potential. We trial the application of these petrophysical relationships to inverted resistivity images. Ground model development is achieved through a mixture of clustering resistivity distributions and analysis of surface movements. Our findings show the shrink swell properties of clay result in a variable porosity, which is problematic for applying classic petrophysical relationships documented in the literature. Moreover, directly translating resistivity distributions into matric potential has additional challenges. Nonetheless, volumetric imaging of resistivity suggest that low shear strengths are concentrated downslope of a rotational backscarp. We infer that an accumulation of moisture drives the development of a slip surface at depth, which subsequently manifests in failure at the ground surface. We conclude that the time-lapse resistivity images alone could not be used to infer the pore pressure conditions present within the slope without development of the petrophysical relationships shown here. Therefore, we suggest that the results have practical implications for landslide monitoring with geophysical methods.
Electrical resistivity tomography (ERT), a geophysical imaging method, is commonly used on flood embankments (dykes or levees) to characterize their internal structure and look for defects. These surveys often use a single line of electrodes to enable 2-D imaging through the embankment crest, an approach that enables rapid and efficient surveying compared to 3-D surveys. However, offline variations in topography can introduce artefacts into these 2-D images, by affecting the measured resistivity data. Such topographic effects have only been explored on a site-specific basis. If the topographic effects can be assessed for a distribution of embankment geometries (e.g. slope angle and crest width) and resistivity variations, it would allow for targeted correction procedures and improved survey design. To investigate topographic effects on ERT measurements, we forward-modelled embankments with different trapezoidal cross-sections sat atop a flat foundation layer with contrasting resistivity values. Each was compared to a corresponding flat model with the same vertical resistivity distribution. The modelling workflow was designed to minimize the effect of forward modelling errors on the calculation of topographic effect. We ran 1872 unique embankment forward models, representing 144 geometries, each with 13 different resistivity contrasts. Modelling results show that offline topography affects the tested array types (Wenner-Schlumberger, Dipole-Dipole and Multiple-Gradient) in slightly different ways, but the magnitudes are similar, so all are equally suitable for embankment surveys. Three separate mechanisms are found to cause topographic effects. The dominant mechanism is caused by the offline topography confining the electrical current flow, increasing the measured transfer resistance from the embankment model. The two other mechanisms, previously unidentified, decrease the measured transfer resistances from the embankment model compared to a layered half-space but only affect embankments with specific geometries and resistivity distributions. Overall, we found that for typical embankment geometries and resistivity distributions, the resistivity distribution has a greater control on the magnitude of the topographic effect than the exact embankment geometry: the subsurface resistivity distribution cannot be neglected. 2-D inversions are suitable when both the embankment is more resistive than the foundations and when the embankment's cross-sectional area is greater than 4 m2 m-2 (area scaled to an embankment with a height of 1 m). Topographic corrections, 3-D data acquisition or 3-D forward models are required when these conditions are not met. These are demonstrated using field data from an embankment at Hexham, Northumberland, UK. Improving the accuracy of the resistivity values in ERT models will enable more accurate ground models, better integration of resistivity data with geotechnical data sets, and will improve the translation of resistivity values into geotechnical properties. Such developments will contribute to a better characterized and safer flood defence network.
 Lee Slater合作论文数School of Arts & Sciences-Newark, Rutgers University Newark67
 Louise Heathwaite合作论文数Lancaster Environment Centre, Lancaster University42
 Giorgio Cassiani合作论文数ENI S.p.A.—Agip Exploration and Production Division, Unita’ GEDA38
 Catherine Heppell合作论文数Queen Mary University of London34
 Trimmer Mark合作论文数Sch Biol & Chem Sci, Queen Mary Univ London33
 Jonathan Chambers合作论文数British Geological Survey;University of Bristol32
 Katrina Lansdown合作论文数27
 Helen K French合作论文数Bioforsk27
 Andreas Kemna合作论文数Agrosphere Institute;Forschungszentrum Jülich GmbH;Forschungszentrum Jülich GmbH, Agrosphere Institute27
 Paul B. Wilkinson合作论文数26
 Stefan Krause合作论文数School of Geography, Earth and Environmental Sciences, College of Life and Environmental Sciences, University of Birmingham23
 Christopher W Watts合作论文数Department of Soil Science, Cross-Institute Programme for Sustainable Soil Function21
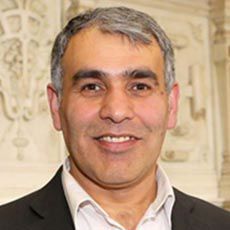 Sami Ullah合作论文数School of Geography, Earth and Environmental Sciences, College of Life and Environmental Sciences, University of Birmingham21
 William Richard Whalley合作论文数Department of Sustainable Agriculture Sciences, Rothamsted Research20
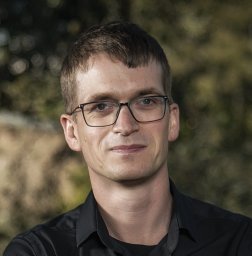 Sebastian Uhlemann合作论文数Earth and Environmental Sciences Area, Lawrence Berkeley National Laboratory18
 Kamini Singha合作论文数Pennsylvania State University, Pennsylvania State University18
 Harry Vereecken合作论文数Institut fur Bio- und Geowissenschaften, Forschungszentrum Julich18Majken Caroline Looms Zibar合作论文数16Guillaume Blanchy合作论文数Flanders Research Institute for Agriculture, Fisheries and Food (ILVO), Melle 9090, Belgium16Frederick D. Day-Lewis合作论文数U. S. Geological Survey15
 Xiaoxu Jia (贾小旭)合作论文数Institute of Geology Science and Natural Resources Research, Chinese Academy of Sciences;University of Chinese Academy of Sciences14
 Karsten H. Jensen合作论文数Department of Geosciences and Natural Resource Management, Faculty of Science, University of Copenhagen14
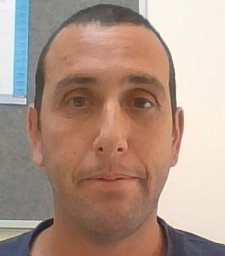 Tuvia Turkeltaub合作论文数Blaustein Inst Desert Res, Ben Gurion Univ Negev13Patrick Byrne合作论文数Centre for Hydrological and Ecosystem Science, Loughborough University13
 Hao Zhang合作论文数Lancaster Environment Centre, Lancaster University13
 Keith Beven合作论文数Lancaster Environment Centre, Lancaster University13
 Daren Gooddy合作论文数UK Centre for Ecology & Hydrology13
 Mathieu Javaux合作论文数Earth and Life Institute, Université catholique de Louvain13
 Kristina Keating合作论文数Dept Earth & Environm Sci, Rutgers State Univ13
 Mingan Shao (邵明安)合作论文数College of Natural Resources and Environment, Northwest A&F University;Institute of Geographic Sciences and Natural Resources Research, Chinese Academy of Sciences;University of Chinese Academy of Sciences12
 Lars Nielsen合作论文数Department of Geosciences and Natural Resource Management, Faculty of Science, University of Copenhagen12
 Philip I. Meldrum合作论文数British Geological Survey, Kingsley Dunham Centre, Keyworth, Nottingham, NG12 5GG, United Kingdom12
 Paul McLachlan合作论文数Aarhus University11
 Nick Kettridge合作论文数School of Geography, Earth and Environmental Sciences, College of Life and Environmental Sciences, University of Birmingham11
 Rita Deiana合作论文数Department of Cultural Heritage: Archaeology, History of Art, Cinema, and Music, University of Padua11
 Oliver Kuras合作论文数british geological survey11
 Qinbo Cheng (程勤波)合作论文数College of Hydrology and Water Resources, Hohai University10Peter Winship合作论文数10John Keery合作论文数10Patrick Keenan合作论文数9
 Dimitrios Ntarlagiannis合作论文数Department of Earth and Environmental Sciences, Rutgers University9William Daily合作论文数9
 L. J. West合作论文数9christina tecklenburg合作论文数8
 Yuanjun Zhu (朱元骏)合作论文数Chinese Academy of Sciences;University of Chinese Academy of Sciences;College of Soil and Water Conservation Science and Engineering, Northwest A&F University8James Boyd合作论文数8Matthias Munz合作论文数8
 James Sorensen合作论文数British Geol Survey8Ashton Rhys W合作论文数8




