Wetland tree stem methane (CH4) emissions represent substantial but poorly constrained components of ecosystem greenhouse gas budgets, yet the age and origin of carbon fuelling these emissions remains unknown. Here we show the first tree stem radiocarbon (14C) methane and carbon dioxide (CO2) emission measurements from subtropical Melaleuca quinquenervia. Stem-emitted CH4 exhibited modern radiocarbon signatures (~99 percent modern carbon, pMC), indistinguishable from shallow soil organic carbon and CH4 ebullition (~101 pMC), and significantly younger than deeper soil organic carbon (79–87 pMC, representing ~1,100 to 1,900 years before present). Stem-emitted CO2 also showed modern 14C content (98.8 pMC). Radiocarbon signatures were consistent across stem heights despite rapid vertical declines in CH4 flux and progressive stem δ13CH4 enrichment, consistent with soil-derived methane transported through stems. Anaerobic wood core incubations confirmed heartwood methanogenesis but explained <2.4% of net stem emissions, with heartwood 14C (112 pMC) distinctly different from stem-emitted CH4. Keeling plot analysis also suggested modern source signatures (~100–103 pMC) for both gases. This establishes that wetland tree-mediated CH4 emissions are tightly coupled to shallow plant-driven carbon cycling (rather than ancient carbon stores or in-stem production), suggesting emissions are sensitive to rapid changes in vegetation productivity and hydrology.
The global CH 4 budget of sources and sinks is highly uncertain, particularly the emissions from specific sources such as fossil fuels (FF) or agriculture. Here, we estimate plausible global CH 4 source and sink scenarios using historical observations and simulations of atmospheric CH 4 mole fraction and its stable isotopic ( δ 13 C‐CH 4 , δ D‐CH 4 ) and radiocarbon (Δ 14 C‐CH 4 ) composition, combining constraints from all these tracers for the first time. We employ a one‐box model along with a Monte Carlo particle filter technique, explicitly exploring the impact of each isotopic constraints and uncertainties in prior CH 4 source and sink parameters on posterior sectorial source fractions. We find our posterior anthropogenic FF emissions at the global scale are 30% lower than previous isotope‐based studies. Our analysis suggests previous δ 13 C‐CH 4 ‐based studies are potentially biased because the current database‐derived estimate of the global mean biogenic δ 13 C‐CH 4 source signature is too low and/or current sink‐weighted total carbon kinetic isotope effect is underestimated. We find modern atmospheric Δ 14 C‐CH 4 data constrains lower global FF emissions after 1980s, which is contrary to the most recent finding that utilized atmospheric Δ 14 C‐CH 4 data, but supported by an independent estimate of global nuclear 14 CH 4 emissions. Our multi‐isotopic constraints align with CH 4 ‐only inversion results, while reducing their uncertainties with greater robustness against different prior emission scenarios. We find strong constraints not only on FF emissions but also other key sources and sinks, showing that long‐term multi‐isotopic observations are critical for refining the global CH 4 budget and developing effective CH 4 emission mitigation strategies.
Sudden cardiac arrest (SCA) is the leading cause of sudden death in athletes during high-level, organised sport. Patient-related and event-related factors provide an opportunity for rapid intervention and the potential for high survival rates. The aim of this consensus was to develop a best-practice guideline for dedicated field-of-play medical teams responding to SCA during an organised sporting event. A task-and-finish group from Resuscitation Council UK identified a stakeholder group of relevant experts and cardiac arrest survivors in March and April 2022. Together, they developed a best-practice guideline using the best available evidence. A public consultation period further refined the guideline before it was finalised in December 2023. Any sudden collapse, without rapid recovery during sporting activity, should be considered an SCA until proven otherwise. Field-of-play medical teams should be empowered to access the collapsed athlete as soon as possible and perform initial essential interventions in situ. This includes a suggested minimum of three cycles of cardiopulmonary resuscitation and defibrillation in persistent shockable rhythms while other aspects of advanced life support are initiated. There should be careful organisation and practice of the medical response, including plans to transport athletes to dedicated facilities for definitive medical care. This best-practice guideline complements, rather than supersedes, existing resuscitation guidelines. It provides a clear approach to how to best treat an athlete with SCA and how to organise the medical response so treatments are delivered effectively and optimise outcomes.
This paper presents a comprehensive river discharge analysis to estimate past and future hydrological extremes across Morocco. Hydrological simulations with historical forcing and climate change scenario inputs have been performed to better understand the change in magnitude and frequency of extreme discharge events that cause flooding. Simulations are applied to all major rivers of Morocco, including a total of 16 basins that cover the majority of the country. An ensemble of temperature and precipitation input parameter sets was generated to analyze input uncertainty, an approach that can be extended to other regions of the world, including data-sparse regions. Parameter uncertainty was also included in the analyses. Historical simulations comprise the period 1979–2021, while future simulations (2015–2100) were performed under the Shared Socioeconomic Pathway (SSP) 2–4.5 and SSP5–8.5. Clear patterns of changing flood extremes are projected; these changes are significant when considered as a proportion of the land area of the country. Two types of basins have been identified, based on their different behavior in climate change scenarios. In the Northern/Mediterranean basins we observe a decrease in the frequency and intensity of events by 2050 under both SSPs, whereas for the remaining catchments higher and more frequent high-flow events in the form of flash floods are detected. Our analysis revealed that this is a consequence of the reduction in rainfall accumulation and intensity in both SSPs for the first type of basins, while the opposite applies to the other type. More generally, we propose a methodology that does not rely on observed time series of discharge, so especially for regions where those do not exist or are not available, and that can be applied to undertake future flood projections in the most data-scarce regions. This method allows future hydrological hazards to be estimated for essentially any region of the world.
We present seismic measurements of the firn column at Korff Ice Rise, West Antarctica, including measurements of compressional- and shear-wave velocity and attenuation. We describe a modified spectral-ratio method of measuring the seismic quality factor (Q) based on analysis of diving waves, which enables us to characterise the attenuative structure of firn in greater detail than has previously been possible. The compressional-wave quality factor, Qp, increases from 20 ± 10 in the uppermost firn to 423 ± 260 between 77 and 86 m depth, and the shear-wave quality factor, Qs, increases from 16 ± 9 in the uppermost firn to 100 ± 87 between 49 and 64 m depth. Our modified spectral-ratio method aids the understanding of the seismic structure of firn and benefits characterisation of deeper glaciological targets, being particularly impactful for correcting reflection amplitudes in wide-angle seismic data.
The crystal orientation fabric of glacier ice impacts its strength and flow. Crystal fabric is therefore an important consideration when modeling ice flow. Here, we show that shear‐wave splitting (SWS) measured with glacial microseismicity can be used to invert seismic anisotropy and ice fabric, if represented in a statistical sense. Rutford Ice Stream (RIS) is a fast‐flowing Antarctic ice stream, a setting crucial for informing large‐scale ice sheet models. We present >200,000 SWS measurements from glacial microseismicity, registered at a 38‐station seismic network located ∼40 km upstream of the grounding line. A representative subset of these data is inverted for ice fabric. Due to the character of SWS, which accumulates along the raypath, we include information on the depth structure from radar measurements. We find that the following three‐layer configuration fits the data best: a broad vertical cone fabric near the base of RIS (500 m thick), a thick vertical girdle fabric, orientated perpendicular to flow, in the middle (1,200 m thick), and a tilted cone fabric in the uppermost 400 m. Such a variation of fabric implies a depth‐dependent strength profile of the ice with the middle layer being ∼3.5 times harder to deform along flow than across flow. At the same time, the middle layer is a factor ∼16 softer to shear than to compression or extension along flow. If such a configuration is representative for fast‐flowing ice streams, it would call for a more complex integration of viscosity in ice sheet models.
Although over 600 Antarctic subglacial lakes have been identified using radar and satellite observations, the bathymetry and bed properties, which are key to understanding conditions within the lake, have been determined in very few localities. We present measurements of water column thickness and lakebed properties from Lago Subglacial CECs (SLC), located beneath 2653 m of ice at the Rutford-Institute-Minnesota divide in Antarctica. Seismic profiles indicate a maximum water column thickness of 301.3 ± 1.5 m, at the widest part of the lake, with an estimated lake volume of 2.5 ± 0.3 km 3 . Seismic imaging and measurements of the reflection strength at the ice base and lakebed indicate >15 m of high-porosity fine-grained sediment in the central section of the lakebed, consistent with a depositional sequence with an age of up to 0.5 Ma. These observations, along with previous radar measurements and modelling, indicate a low-energy sedimentary environment with a long water-residence time. As such, SLC is a suitable target for exploration via direct access to recover sediment records of ice sheet and climate history and investigate microbial life with long periods of isolation.
We present a transparent and validated climate-conditioned catastrophe flood model for the UK, that simulates pluvial, fluvial and coastal flood risks at 1 arcsec spatial resolution (∼ 20–25 m). Hazard layers for 10 different return periods are produced over the whole UK for historic, 2020, 2030, 2050 and 2070 conditions using the UK Climate Projections 2018 (UKCP18) climate simulations. From these, monetary losses are computed for five specific global warming levels above pre-industrial values (0.6, 1.1, 1.8, 2.5 and 3.3 ∘C). The analysis contains a greater level of detail and nuance compared to previous work, and represents our current best understanding of the UK's changing flood risk landscape. Validation against historical national return period flood maps yielded critical success index values of 0.65 and 0.76 for England and Wales, respectively, and maximum water levels for the Carlisle 2005 flood were replicated to a root mean square error (RMSE) of 0.41 m without calibration. This level of skill is similar to local modelling with site-specific data. Expected annual damage in 2020 was GBP 730 million, which compares favourably to the observed value of GBP 714 million reported by the Association of British Insurers. Previous UK flood loss estimates based on government data are ∼ 3× higher, and lie well outside our modelled loss distribution, which is plausibly centred on the observations. We estimate that UK 1 % annual probability flood losses were ∼ 6 % greater for the average climate conditions of 2020 (∼ 1.1 ∘C of warming) compared to those of 1990 (∼ 0.6 ∘C of warming), and this increase can be kept to around ∼ 8 % if all countries' COP26 2030 carbon emission reduction pledges and “net zero” commitments are implemented in full. Implementing only the COP26 pledges increases UK 1 % annual probability flood losses by 23 % above average 1990 values, and potentially 37 % in a “worst case” scenario where carbon reduction targets are missed and climate sensitivity is high.
We use polarimetric radar sounding to investigate ice crystal orientation fabric and its impact on ice viscosity within the near surface of Rutford Ice Stream, West Antarctica. The technique retrieves lateral and depth variations in the horizontal components of ice fabric but no direct information on the vertical fabric component. In the shallowest ice (depths 40–100 m), the fabric is consistent with flow‐induced development and correlates with the surface compression direction. Notably, toward the ice‐stream margin, the horizontal compression angle and azimuthal fabric orientation tend toward 45° relative to ice flow which is consistent with the early stages of flow‐induced fabric under simple shear. The fabric orientation in deeper ice (depths 100–300 m) is, in places, significantly misaligned with shallower ice and the surface compression direction due to sharp depth transitions in orientation. We then use a rheological model to bound effective anisotropic viscosities (directional hardness) of ice that are consistent with the radar measurements. Toward the shear margin, we show that the shallow‐ice fabric does not appreciably soften the ice to lateral shear although this may happen in deeper ice. In the center of the ice stream, we show that lateral and depth variations in the fabric alignment relative to ice flow result in corresponding changes in uniaxial ice viscosities relative to ice flow. Our results indicate that spatial variability in the fabric translates to variability in viscosity that widely used isotropic ice‐flow models are unable to consider.
An abstract is not available for this content. As you have access to this content, full HTML content is provided on this page. A PDF of this content is also available in through the ‘Save PDF’ action button.
UK flood hazard and risk datasets: further informationUK flood hazard and risk information at national and sub-national scales can be found in five broad classes of data product: 1. Floodplain zonation (i.e., hazard) maps for fluvial, coastal and sometimes pluvial flooding developed separately by government bodies in the devolved regions of the UK (Northern Ireland, Wales, Scotland and England) and predominantly used to inform land use planning decisions.2. Flood risk maps or spatially aggregated risk data (i.e., the product of flood probability, exposure and vulnerability) also produced by the devolved administrations and predominantly used to inform flood defence investment policy and long-term risk planning.3. Current and future flood risk estimates produced as part of the UK's Climate Change Risk Assessment process.4. Flood hazard and risk data produced by commercial modelling firms at national scale, predominantly for use in the insurance and financial sectors.5. Data on insured losses available from the Association of British Insurers.These are described briefly in the main text, however further details for certain methods are provided below for interested readers. S1.1 UK flood hazard maps in the devolved administrationsGovernment floodplain hazard maps show the land area likely to be inundated by specific low probability flood events and are compiled separately by the Department of Infrastructure Rivers in Northern Ireland (DfI Rivers), Natural Resources Wales (NRW), the Scottish Environmental Protection Agency (SEPA), and the Environment Agency (EA) in England.Each devolved region has its own mapping approach, and these differ in terms of the types of flood considered (pluvial, fluvial or coastal), the return periods that are modelled, whether or not flood defences are taken into account and how the maps are made available to the public.Specifications exist for how this modelling should be conducted (see for example https://naturalresources.wales/flooding/developing-hydraulic-models-for-flood-risk and https://www.gov.uk/government/publications/river-modelling-technical-standards-and-assessment),but exactly what areas have been modelled using which methods is not recorded.To the authors' knowledge, the only recent attempt to collate metadata on the modelling undertaken in the four devolved regions of the UK into a single document was by Sayers (2017, see Appendix A, Table A1-1). S1.2 UK flood risk maps in the devolved administrationsAs well as the hazard maps discussed above, each devolved administration also produces an estimate of flood risk, either in terms of the number of properties exposed to flooding of a given probability, or the Average Annual Loss (AAL)/Expected Annual Damage (EAD).AAL and EAD are used interchangeably and represent the loss that would occur on average each year given a sufficiently long sample (AAL) or the loss caused by all possible flood events weighted by their probability of occurrence (EAD).For consistency we use the term Expected Annual Damage in this paper.In England, flood risk maps are produced by the Environment Agency as part of their National Flood Risk Assessment (NaFRA) programme (Environment Agency, 2009).Data inputs to the system are updated several times a year as new information (e.g., new terrain data, new flood defences) become available, with major methodological updates every 5-10 years starting from 2004 and with the most recent being in 2018.NaFRA is an extension of the RASP methodology of Hall et al. ( 2003), which provided an early way of approximating national flood losses using a statistical-parametric approach.RASP combined the Environment Agency's 1 in 1000 year return period hazard maps for fluvial and coastal flooding, a DEM, a vector layer identifying river centrelines and a national flood defence data base to make its calculations.Estimates of water depths within river channels for 40 different probability events from 1 in 1 year return period to 1 in 1000 are used to drive a flood defence reliability analysis to determine the volume of water entering the floodplain.We assume, as with the hazard maps discussed above, that these channel water levels are derived (either directly or indirectly) from analysis of historic river flow data, however this is not clear in the RASP/NaFRA documentation (Environment Agency, 2009;Hall et al., 2003).In RASP and the original 2004 version of NaFRA, the water volume calculated by the reliability analysis is then spread over the floodplain DEM using simple non-hydraulic approximations to give the depth-probability exceedance curve in each 50m resolution model cell.Flood losses in NaFRA 2004 were then calculated using a national exposure database and the UK's standard set of depth damage curves (the so-called Multi-Coloured Manual approach, Penning-Rowsell et al., 2013).Spatial correlations in flood depths (c.f.Heffernan & Tawn, 2004;Keef et al., 2009Keef et al., , 2012;;Quinn et al., 2019) are not taken into account so only average annual losses can be computed and not the full loss-exceedance curve.The methods underpinning the NaFRA analysis have changed significantly over time, but these modifications are rarely disclosed publicly.Indeed, it has taken significant detective work by Penning-Rowsell (2014) and Penning-Rowsell (2021) to uncover even limited aspects of the approach and differences from RASP.A major change occurred in 2008 when the simple
Abstract Three holes were drilled to the bed of Rutford Ice Stream, through ice up to 2154 m thick, to investigate the basal processes and conditions associated with fast ice flow and the glacial history of the West Antarctic Ice Sheet. A narrative of the drilling, measuring and sampling activities, as well as some preliminary results and initial interpretations of subglacial conditions, is given. These were the deepest subglacial access holes ever drilled using the hot-water drilling method. Samples of bed and englacial sediments were recovered, and a number of instruments were installed in the ice column and the bed. The ice–bed interface was found to be unfrozen, with an existing, well-developed subglacial hydrological system at high pressure, within ~1% of the ice overburden. The bed itself comprises soft, water-saturated sediments, consistent with previous geophysical interpretations. Englacial sediment quantity varies significantly between two locations ~2 km apart, and possibly over even shorter (~20 m) distances. Difficulties and unusual observations encountered while connecting to the subglacial hydrological system in one hole possibly resulted from the presence of a large clast embedded in the bottom of the ice.
Icequakes, microseismic earthquakes at glaciers, offer insights into the dynamics of ice sheets. For the first time in the Antarctic, we explore the use of fiber optic cables as Distributed Acoustic Sensors (DAS) as a new approach for monitoring basal icequakes. We present the use of DAS for studying icequakes as a case study for the application of DAS to microseismic datasets in other geological settings. Fiber was deployed on the ice surface at Rutford Ice Stream in two different configurations. We compare the performance of DAS with a conventional geophone network for: microseismic detection and location; resolving source and noise spectra; source mechanism inversion; and measuring anisotropic shear‐wave splitting parameters. Both DAS array geometries detect fewer events than the geophone array. However, DAS is superior to geophones for recording the microseism signal, suggesting the applicability of DAS for ambient noise interferometry. We also present the first full‐waveform source mechanism inversions using DAS anywhere, successfully showing the horizontal stick‐slip nature of the icequakes. In addition, we develop an approach to use a 2D DAS array geometry as an effective multi‐component sensor capable of accurately characterizing shear‐wave splitting due to the anisotropic ice fabric. Although our observations originate from a glacial environment, the methodology and implications of this work are relevant for employing DAS in other microseismic environments.
Purpose Creatine transporter deficiency (CTD) is a rare X-linked disorder of creatine transport caused by pathogenic variants in SLC6A8 (Xq28). CTD features include developmental delay, seizures, and autism spectrum disorder. This study was designed to investigate CTD cardiac phenotype and sudden death risk. Methods We performed a cross-sectional analysis of CTD males between 2017 and 2020. Subjects underwent evaluation with electrocardiogram (ECG), echocardiography, and ambulatory ECG with comparable analysis in creatine transporter deficient mice ( Slc6a8 −/y ) using ECG, echocardiography, exercise testing, and indirect calorimetry. Results Eighteen subjects with CTD (18 males, age 7.4 [3.8] years) were evaluated: seven subjects (39%) had QTc ≥ 470 milliseconds: 510.3 ± 29.0 vs. 448.3 ± 15.9, P < 0.0001. The QTc ≥ 470 milliseconds cohort had increased left ventricular internal dimension (diastole) ([LVIDd] Z -score: 0.22 ± 0.74, n = 7 vs. −0.93 ± 1.0, n = 11, P = 0.0059), and diminished left ventricular posterior wall dimension (diastole) ([LVPWDd, in mm]: 5.0 ± 0.6, n = 7 vs. 5.7 ± 0.8, n = 11, P = 0.0183), when compared to subjects with normal or borderline QTc prolongation. Similar ECG and echocardiographic abnormalities were seen in Slc6a8 −/y mice. Additionally, Slc6a8 −/y mice had diminished survival (65%). Conclusion Prolonged QTc and abnormal echocardiographic parameters consistent with developing cardiomyopathy are seen in some male subjects with CTD. Slc6a8 −/y mice recapitulated these cardiac abnormalities. Male CTD subjects may be at increased risk for cardiac dysfunction and sudden death.
Improving our understanding of glacial sliding is crucial for constraining basal drag in ice dynamics models. We use icequakes, sudden releases of seismic energy as the ice slides over the bed, to provide geophysical observations that can be used to aid understanding of the physics of glacial sliding and constrain ice dynamics models. These icequakes are located at the bed of an alpine glacier in Switzerland and the Rutford Ice Stream, West Antarctica, two extremes of glacial settings and spatial scales. We investigate a number of possible icequake source mechanisms by performing full waveform inversions to constrain the fundamental physics and stress release during an icequake stick‐slip event. Results show that double‐couple mechanisms best describe the source for the events from both glacial settings and the icequakes originate at or very near the ice‐bed interface. We also present an exploratory method for attempting to measure the till shear modulus, if indirect reflected icequake radiation is observed. The results of this study increase our understanding of how icequakes are associated with basal drag while also providing the foundation for a method of remotely measuring bed shear strength.
The COVID-19 pandemic has necessitated many novel responses in healthcare including sport and exercise medicine. The cessation of elite sport almost globally has had significant economic implications and resulted in pressure to resume sport in very controlled conditions. This includes protecting pitch-side medical staff and players from infection. The ongoing prevalence of SARS-CoV-2 and the desire to resume professional sport required urgent best practice guidelines to be developed so that sport could be resumed as safely as possible. This set of best practice recommendations assembles early evidence for managing SARS-CoV-2 and integrates expert opinion to provide a uniform and pragmatic approach to enhance on-field and pitch-side safety for the clinician and player. The nature of SARS-CoV-2 transmission creates new hazards during resuscitation and emergency care and procedures. Recommendations for the use and type of personal protective equipment during on-field or pitch-side emergency medical care is provided based on the clinical scenario and projected risk of viral transmission.
 Quan Hua合作论文数Physics Division;Private Mail Bag;Physics Division|Private Mail Bag28
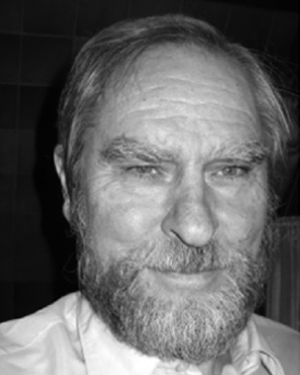 D. Fink合作论文数22
 Claudio Tuniz合作论文数Istituto di Fisica dell’, Università Trieste21
 Alex Mark Brisbourne合作论文数British Antarctic Survey17
 Geraldine Jacobsen合作论文数Australian Nuclear Science and Technology Organisation16
 David Etheridge合作论文数Division of Atmospheric Research;Industrial Research Organization;Division of Atmospheric Research, Industrial Research Organization15
 Alan H.B. Wu合作论文数School of Medicine, University of California, San Francisco;Zuckerberg San Francisco General Hospital14
 David Fink合作论文数Australian Nuclear Science and Technology Organization14
 David Vaughan合作论文数British Antarctic Survey13
 Edward C. King合作论文数Substance Abuse and Mental Health Services Administration;Lewin Group;Actuarial Research Corporation;Substance Abuse and Mental Health Services Administration, Actuarial Research Corporation13
 Tas Van Ommen合作论文数Institute for Marine and Antarctic Studies, University of Tasmania13
 Vasilii Petrenko合作论文数Ice Core and Atmospheric Chemistry Lab, Department of Earth and Environmental Sciences, School of Arts & Sciences, University of Rochester13
 Mark Curran合作论文数Antarctic Climate and Ecosystems Cooperative Research Centre;Australian Antarctic Division13
 Jeffrey Severinghaus合作论文数Geosciences Research Division, Scripps Institution of Oceanography, University of California, San Diego11
 Michael Hotchkis合作论文数Australian Nuclear Science and Technology Organisation11
 Hugh Corr合作论文数British Antarctic Survey11GE Jacobsen合作论文数10
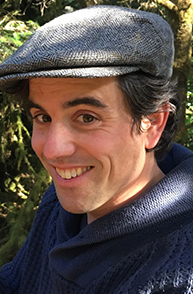 Christo Buizert合作论文数College of Earth, Ocean, and Atmospheric Sciences, Oregon State University10
 Joel Pedro合作论文数Australian Government Antarctic Division10Mac Hotchkis合作论文数9v a levchenko合作论文数9
 Cathy M. Trudinger合作论文数9
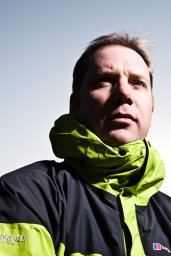 John Woodward合作论文数Biotechnology Unit, The University of Leeds9
 Paul Bates合作论文数Fathom Global;School of Geographical Sciences, University of Bristol9
 benjamin hmiel合作论文数Department of Chemistry and Biochemistry, University of Delaware, Newark, DL 19716, USA8
 Tavi Murray合作论文数School of Biosciences, Geography and Physics, Swansea University8
 Keith Makinson合作论文数Natural Environment Research Council8Michael Dyonisius合作论文数7Neil Ross合作论文数Newcastle University, Newcastle University7
 Ray Weiss合作论文数Scripps Institution of Oceanography, University of California San Diego7
 Christopher Sampson合作论文数Fathom7
 Keith W. Nicholls合作论文数Natural Environment Research Council7Christina M. Harth合作论文数7
 Ed Brook合作论文数College of Earth Ocean, and Atmospheric Sciences, Oregon State University6S. E. Pryse合作论文数6
 Andres Rivera合作论文数Centro de Estudios Cientificos6
 Jeffrey Neal合作论文数School of Geographical Sciences, University of Bristol;Cabot Institute, University of Bristol;Hydrology Group, University of Bristol6
 Richard Hindmarsh合作论文数British Antarctic Survey;Department of Geography, Durham University6Hamish D. Pritchard合作论文数British Antarctic Survey6David Child合作论文数6U. Heikkilae合作论文数5Ewan Lawson合作论文数5klaus simon合作论文数5Isaac J. Vimont合作论文数5
 Anais J. Orsi合作论文数Earth Ocean & Atmospher Sci Dept, Univ British Columbia5
 Robert Bingham合作论文数School of Geosciences, The University of Edinburgh5Daniel Baggenstos合作论文数Scripps Institution of Oceanography, University of California;Scripps Institution of Oceanography, University of California5
 Martin Siegert合作论文数University of Exeter;The Grantham Institute for Climate Change, Faculty of Natural Sciences, Imperial College London;School of Geosciences, University of Edinburgh5




