We will present the strategy and results of a combination of six scanning lidars to investigate the interplay between daytime surface fluxes, surface layer gradients, convective boundary layer dynamics and development, as well as the characteristics of the interfacial layer and the lower free troposphere. Our observations were made above the agricultural fields of University of Hohenheim [1], Stuttgart, Germany in spring and summer 2025 in the frame of the research unit Land Atmosphere Feedback Initiative (LAFI, https://lafi-dfg.de/) of the German Research Foundation (DFG). For this, the automated Raman lidar ARTHUS (Atmospheric Temperature and Humidity Sounder) built in our institute in recent years, was extended with a scanner for atmospheric measurements in the surface layer just above the canopy. ARTHUS [2] is an eye-safe rotational Raman lidar with five receiver channels detecting the elastic backscatter signal at 355 nm, two rotational Raman signals with opposite temperature dependence, as well as the two vibrational Raman signals of water vapor and carbon dioxide. These scanning measurements were performed during intensive observation periods for 50 minutes of each hour while during the remaining 10 minutes of each hour as well as during non-IOP days vertical pointing measurements were made. These surface layer observations of ARTHUS were combined with data measured with two Doppler lidars making simultaneously cross-cutting low-level scans for horizontal wind profiling near the surface. Two more Doppler lidars were measuring vertical wind fluctuations and horizontal wind speed and direction. One of these two Doppler lidars was operated in constant vertical pointing mode while the other was operated in a six-beam scanning mode with an elevation angle of 45°. Our water vapor differential absorption lidar (WVDIAL) made vertical-pointing observations of turbulent moisture fluctuations up to the free troposphere. The WVDIAL uses a Titanium-Saphire laser pumped with the second-harmonic radiation of a Nd:YAG laser as transmitter emitting online and offline laser pulses near 820 nm with 200 Hz into the atmosphere. The atmospheric backscatter signals are collected with a 80-cm telescope. While also the WVDIAL can scan in any direction, it was operated in constant vertical-pointing mode during LAFI. [1] Späth, F., et al.: The land–atmosphere feedback observatory: a new observational approach for characterizing land–atmosphere feedback. Geoscientific Instrumentation, Methods and Data Systems (2023). DOI: 10.5194/gi-12-25-2023[2] Lange, D. et al.: Compact Operational Tropospheric Water Vapor and Temperature Raman Lidar with Turbulence Resolution. Geophys. Res. Lett. (2019). DOI: 10.1029/2019GL085774
We will discuss highlights and present lessons learned in several years of measurements of automated temperature and humidity lidars. ARTHUS (Atmospheric Raman Temperaure and HUmidity Sounder) was developed at University of Hohenheim. This eye-safe lidar participated since spring 2018 worldwide successfully in several field campaigns – among others on a ship in the Caribbean. Furthermore, three additional automated Raman lidars based on ARTHUS but with even improved performances were built by the company Purple Pulse Lidar Systems (PPLS).
Abstract. The WaLiNeAs campaign took place along the north-western Mediterranean coast between October 2022 and January 2023. This period was marked by unusual weather conditions associated with dry autumn and winter. In such conditions and for the first time, eight ground-based stations equipped with water vapour Raman lidars were strategically deployed by four European countries. We studied the consistency of this network with the water vapour mixing ratio (WVMR) products derived from the Infrared Atmospheric Sounding Interferometer (IASI) and the European Centre for Medium-Range Weather Forecasts (ECMWF) Reanalysis (ERA5), which assimilate IASI radiances. The statistical metrics used in the comparison are the mean bias (MB, defined as lidar – IASI or ERA5), the root mean square error (RMSE) and the correlation coefficient (COR). A positive MB of approximately 0.9 g kg−1 (respectively 0.6 g kg−1) between 0.2 and 5 km above mean sea level (amsl) indicates a systematic underestimation of the WVMR by IASI (respectively ERA5). RMSE values range from 1 to 2 g kg−1 across all lidar stations for IASI and ERA5, while the measurement uncertainties of the lidars are typically below 0.4 g kg−1. COR presents little variation between stations, it ranges from 0.7 to 0.8 and remains almost constant between 0.2 and 5 km amsl. Both the IASI and the ERA5 products appear to accurately reproduce the temporal variability of the vertical structure of water vapour in the low troposphere. Nevertheless, they show MB and RMSE significantly above the uncertainties of lidar measurements.
We have extended our automatic and continuously measuring ground-based Raman lidar ARTHUS (Atmospheric Raman Temperature and Humidity Sounder) with a CO2 channel. A narrow-band interference filter extracts the 2ν2 CO2 Raman line with 68 % peak transmission and 0.15 nm FWHM. We use a frequency-tripled Nd:YAG laser (200 Hz, 40 mJ in 2023, 100 mJ in 2024) and a 40-cm receiving telescope. With the current setup, we profile CO2, H2O and temperature as well as particle extinction coefficient and particle backscatter coefficient. We have operated this eye-safe system successfully in 2023 for several weeks at our university and continue to do so with a further improved system performance this spring. The first test measurements in 2023 achieved already uncertainties of <1.3 ppm at 1 km altitude with averaging of 4.4 h and 500 m at night.
We have extended our automatic and continuously measuring ground-based Raman lidar ARTHUS (Atmospheric Raman Temperature and Humidity Sounder) with a CO 2 channel. A narrow-band interference filter extracts the 2ν 2 CO 2 Raman line with 68 % peak transmission and 0.15 nm FWHM. We use a frequency-tripled Nd:YAG laser (200 Hz, 40 mJ in 2023, 100 mJ in 2024) and a 40-cm receiving telescope. With the current setup, we profile CO 2 , H 2 O and temperature as well as particle extinction coefficient and particle backscatter coefficient. We have operated this eye-safe system successfully in 2023 for several weeks at our university and continue to do so with a further improved system performance this spring. The first test measurements in 2023 achieved already uncertainties of <1.3 ppm at 1 km altitude with averaging of 4.4 h and 500 m at night.
The Raman lidar technique to measure atmospheric temperature profiles is based on the dependence on temperature of the intensity of the atmospheric N2 and O2 rotational Raman lines [1]. The technique requires very good stability of the laser wavelength, or frequent recalibrations, to avoid errors in the retrieved temperature produced by wavelength drifts. Frequency doubled or tripled Nd:YAG lasers are usually employed to implement this technique. To achieve laser wavelength stability, injection-seeded lasers are used that transfer the wavelength stability of the seeder to the high-power laser [2]; this has also the consequence of narrowing the spectrum of the transmitted radiation. Temperature profiling using free-running lasers are also reported in the literature [3]. In this case wavelength stability must be obtained by keeping the laser operating conditions, and in particular the Nd:YAG rod temperature, very stable.We have assessed the effects on the atmospheric temperature retrieval of the spectral width and temperature-induced wavelength drift of the 3rd harmonic of a free-running Nd:YAG laser. We have found that the spectral width has a negligible effect, as compared with the negligible spectral width of an injection-seeded laser, in the receiving filters that are part of the lidar. However, slight temperature-induced drifts on the central wavelength of the laser emitted spectrum entail small changes in the filter responses that impair the calibration and cause an uncertainty in the retrieved atmosphere temperature. We have estimated that to keep the retrieved temperature uncertainty below 1 K, the rod temperature must also to be kept within a ±1 K range. This is also the temperature stability that would be needed in the seeder of an injection seeded laser, as changes of temperature in the seeder will also cause wavelength drifts, hence uncontrolled biases in the atmosphere temperature measurements that would add to their uncertainty. [1] J. Cooney, Measurement of Atmospheric Temperature Profiles by Raman Backscatter, J Appl Meteorol Climatol. 11 (1972) 108–112. https://doi.org/10.1175/1520-0450(1972)0112.0.CO;2[2] E. Hammann, A. Behrendt, F. Le Mounier, V. Wulfmeyer, Temperature profiling of the atmospheric boundary layer with rotational Raman lidar during the HD(CP)2 Observational Prototype Experiment, Atmos Chem Phys. 15 (2015) 2867–2881. https://doi.org/10.5194/acp-15-2867-2015.[3] P. Di Girolamo, R. Marchese, D.N. Whiteman, B.B. Demoz, Rotational Raman Lidar measurements of atmospheric temperature in the UV, Geophys Res Lett. 31 (2004) 1–5. https://doi.org/10.1029/2003GL018342.
The atmospheric boundary layer (ABL) is the lowest part of atmosphere. It is directly influenced by the Earth's surface. To understand the influence of surface fluxes on ABL turbulence processes during daytime in convective conditions, the use of lidars and Eddy covariance stations are essential. Such better understanding will then help to improve weather and climate models. The Land-Atmosphere Feedback Observatory (LAFO) at the University of Hohenheim, Stuttgart, Germany is a designated study site for agricultural experiments equipped with various sensors to analyze state variables from the soil to the lower free troposphere (Späth et al., 2023). To investigate boundary layer turbulence, two Doppler lidars, a Doppler Cloud Radar, the lidar Atmospheric Raman Temperature and Humidity Sounder (ARTHUS) (Lange et al., 2019), and two Eddy covariance stations are deployed at LAFO to capture high-resolution data. Two Doppler lidars are continuously operated, one in vertical pointing mode and the second in six-beam scanning mode (Bonin et al., 2017) to measure high spatial and temporal resolution vertical and horizontal wind data. The turbulent surface fluxes significantly impact the ABL exchange processes. Therefore, it is very interesting to integrate the continuous high temporal resolution measurements of Eddy covariance sensors with lidars measurement. The key turbulent variables are retrieved from high frequency vertical wind data. These turbulence statistics are transversal temporal autocovariance functions, its coefficients in the inertial subrange using appropriate fit lags, atmospheric vertical wind variance, integral time scale, turbulence kinetic energy dissipation (Wulfmeyer et al., 2023), cloud base height and ABL depth. We have used two methods to determine the ABL depth. The first retrieval method is based on fuzzy logic (Bonin et al., 2018) which uses atmospheric vertical velocity variance profiles. The second method employs Haar wavelet transform (Pal et al., 2010) on water vapor mixing ratio and potential temperature profiles.In this contribution, we are presenting our analyses on correlation statistics between surface fluxes and ABL depth and influence of these surface fluxes on turbulence variables covering different daytime weather conditions from June to August in 2021.Bonin et al, 2017, https://doi.org/10.5194/amt-10-3021-2017Bonin et al, 2018, https://doi.org/10.1175/JTECH-D-17-0159.1Lange et al, 2019, https://doi.org/10.5194/egusphere-egu22-3275Pal et al, 2010, https://doi.org/10.5194/angeo-28-825-2010Späth et al, 2023, https://doi.org/10.5194/gi-12-25-2023Wulfmeyer et al, 2023, https://doi.org/10.5194/amt-2023-183
The moisture advection term in the water–vapor budget equation is investigated with a combination of a vertically-staring water–vapor lidar and Doppler lidar systems. These instruments make it possible to get the mean profile of moisture tendency and the latent heat flux (LHF) divergence. We use data of the Land–Atmosphere Feedback Experiment (LAFE) at the Atmospheric Radiation Measurement (ARM) Program’s Southern Great Plains (SGP) site, Oklahoma, USA, collected on 30 August 2017 between 15 and 24 UTC, which corresponds to 09 to 18 LT. The lidars provide turbulence resolving profiles of moisture and vertical wind fluctuations. The LHF profile is derived from the covariance of these moisture and vertical wind fluctuations. The mean boundary layer height zi is determined from the peak of the moisture variance. The results demonstrate that the combination of two remote sensing instruments can be applied for determining the dominant water–vapor budget terms, namely moisture tendency, latent heat flux divergence and moisture advection.
In this contribution, we will give an update of recent lidar activities at University of Hohenheim. Two of the lidars have been developed at our institute: The scanning water vapor differential absorption lidar (WVDIAL) and the Raman lidar ARTHUS (Atmospheric Raman Temperature and HUmidity Sounder). In addition, two scanning Doppler lidars are used since a few years while a third one will be added soon. All these lidars are located at LAFO (Land Atmospheric Feedback Observatory; Branch et al., this conference). Here, also a scanning Doppler cloud radar, meteorological towers, Eddy-covariance stations, surface and sub-surface sensors are collecting routinely data. These data are combined with detailed vegetation analyses.The WVDIAL is embedded into large truck. Its transmitter consists of an injection-seeded titanium-sapphire laser that is pumped with a diode-pumped Nd:YAG laser. The maximum laser power is 10 W at 200 Hz. This laser power can be used for vertical measurements for which the laser beam is directly emitted vertically into the atmosphere. For scanning measurements, 2 W laser power are transmitted with a fiber into the atmosphere after being expanded with a small telescope. The atmospheric backscatter signals are collected with a 80-cm telescope offering high detection efficiency. The resolution of the stored raw data is up to several Hz and a few meters. The typical resolution of the data products is 1 s and 30 m.While the large WVDIAL needs supporting personal for its operation, our second lidar ARTHUS is an automated instrument with continuous operation (Lange et al., 2019; Wulfmeyer and Behrendt, 2022). This eyesafe Raman lidar uses a diode-pumped Nd:YAG laser as transmitter. Only the third-harmonic radiation at 355 nm is – after beam expansion – transmitted into the atmosphere. The laser power is about 15 W at 200 Hz repetition rate. The receiving telescope has a diameter of 40 cm. A polychromator extracts the elastic backscatter signal and three inelastic signals, namely the vibrational Raman signal of water vapor, and two pure rotational Raman signals. The raw data is stored with a resolution of 7.5 m and typically 10 s (while higher temporal resolution is possible). All four signals are simultaneously analyzed and stored in both photon-counting (PC) mode and voltage (so-called “analog” mode) in order to make optimum use of the large intensity range of the backscatter signals covering several orders of magnitude. Primary data products are temperature, water vapor mixing ratio, particle backscatter coefficient and particle extinction coefficient. The high resolution allows studies of boundary layer turbulence (Behrendt et al, 2015) and - in combination with the vertical pointing Doppler lidar - sensible and latent heat fluxes (Behrendt et al, 2020). Similar lidars like ARTHUS are meanwhile also available at the company Purple Pulse Lidar Systems (www.purplepulselidar.com). In 2023, a CO2 channel was implemented into ARTHUS allowing now in addition also measurements of the CO2 mixing ratio (Schumann et al., this conference). Behrendt et al. 2015, https://doi.org/10.5194/acp-15-5485-2015Behrendt et al. 2020, https://doi.org/10.5194/amt-13-3221-2020Lange et al. 2019, https://doi.org/10.1029/2019GL085774Wulfmeyer and Behrendt 2022, https://doi.org/10.1007/978-3-030-52171-4_25
This research focuses on investigating the influence of dynamics and thermodynamics on cloud formation. The properties of the particles in dependence on relative humidity in the atmospheric boundary layer during cloud formation are investigated. For this, we use the synergy of Raman and Doppler lidars as well as of cloud radar operated during the Land-Atmosphere Feedback Experiment (LAFE) (see https://www.arm.gov/research/campaigns/sgp2017lafe). The LAFE project was executed at the Southern Great Plains (SGP) site of the Atmospheric Radiation Measurement (ARM) program in August 2017 in the USA. The particle backscatter coefficients are measured with Raman lidar, vertical wind velocity with Doppler lidar, and Doppler cloud radar. This instrument combination is also particularly advantageous for investigating the vertical structure of clouds, providing details about cloud height and thickness. In consequence, the combined measurements allow detailed insights into the relative humidity dependencies on the growth of particles to investigate the influence of dynamics and thermodynamics on cloud formation.
Studies of land-atmosphere (L-A) feedbacks are essential for understanding the Earth system. These feedbacks are the result of an interaction of processes related to exchanges of momentum, energy, and mass in the soil-vegetation-surface layer (SL)-atmospheric boundary layer (ABL) continuum. Quantification of feedbacks are often made using L-A feedback metrics. Inaccurate representation/parameterization of feedbacks are a weakness of current weather models, and their improvement will thus contribute to better simulations over all spatiotemporal scales. Improving feedback representation requires simultaneous measurements in all L-A compartments using a synergy of in-situ and active remote sensing instruments. To that end, a new Land-Atmosphere Feedback Observatory (LAFO) was established at the University of Hohenheim, Stuttgart, Germany funded by the Carl Zeiss Foundation. It was developed as a prototype for a future network of GEWEX LAFOs (GLAFOs), proposed by the Global Energy and Water Exchanges (GEWEX) program and GEWEX Global Land/Atmosphere System Study (GLASS) panel (Wulfmeyer et al. 2020). The main goals are to:1) investigate the diurnal cycle and statistics of ABL temperature, humidity and wind profiles,2) characterize L-A feedback by suitable metrics.3) improve parameterizations of vegetation, surface and ABL fluxes,4) verify mesoscale and turbulence permitting models,LAFO brings together a sensor synergy with fine spatiotemporal resolution. An extended set of soil physical, plant dynamic as well as meteorological variables throughout the ABL are measured, focusing on evapotranspiration and other exchanges over agricultural landscapes. The LAFO observations with current instruments are continuously archived, according to FAIR data principles (Findable, Accessible, Interoperable, Reusable) and are complemented by additional field campaign measurements.The first key component of the current LAFO sensor synergy consists of four 3D scanning lidar systems: A scanning water vapor Differential Absorption Lidar (DIAL, Muppa et al. 2016, Späth et al. 2016) and the Atmospheric Rotational-Raman Temperature and Humidity Sounder (ARTHUS, Lange et al. 2019), both developed at the Institute of Physics and Meteorology. Both these systems are unique and provide water vapor and temperature profiles from the surface layer to the free troposphere with fine resolution down to turbulence scales (Behrendt et al. 2015, Wulfmeyer et al. 2015). These lidars are complemented by a scanning Doppler cloud radar and two Doppler lidars for measuring horizontal and vertical wind profiles and turbulent fluctuations. This combination allows determination of sensible and latent heat flux profiles. The second key component is a soil moisture and temperature sensor network distributed over agricultural land and two 10-m towers, measuring turbulent fluxes at two heights.LAFO will soon form part of a new Research Unit, funded by the German Research Foundation (DFG), called the Land-Atmosphere-Feedback-Initiative (LAFI) which begins in 2024, and incorporates novel crop, hydrology and atmospheric instruments, operated by several research partners within Germany. Here, we present measurement examples from the LAFO and show how these can be used to reach our research goals. ReferencesWulfmeyer et al. 2020, GEWEX Quarterly Vol. 30, No. 1.Behrendt et al. 2015, doi:10.5194/acp-15-5485-2015Wulfmeyer et al. 2015, doi:10.1002/2014RG000476Muppa et al. 2016, doi:10.1007/s10546-015-0078-9Späth et al. 2016, doi:10.5194/amt-9-1701-2016Lange et al. 2019, doi:10.1029/2019GL085774
The variability of CO2 in the atmosphere is still not well understood. Key to improve this understanding are continuous measurements of the CO2 concentration over long periods of time as well as in different altitudes. At the “Land-Atmosphere Feedback Observatory” (LAFO) [1] of the University of Hohenheim, Stuttgart, Germany, we are operating the ground based Raman lidar system ARTHUS. ARTHUS stands for "Atmospheric Raman Temperature and HUmidity Sounder" [2]. This automatic system provides high resolution measurements up to the turbulent scale of temperature, water vapor mixing ratio as well as extinction and backscatter data continuously. But measuring CO2concentrations with Raman lidar is quite challenging because of its comparatively low concentrationresulting in an overall weak backscatter signal and thus a low signal-to-noise ratio. To investigate the capabilities of our system for capturing CO2 profiles, we developed and incorporated a new channel. For the measurements we utilize the 2ν2 CO2 Raman line, which is well separated from relevant Raman lines of other constituents of the atmosphere (e.g. O2). At the conference we will present and discuss the first results of the first measurements at the LAFO site between August and October 2023. Comparison of the measured with expected profiles show good agreement. The latter where obtained by appropriately scaling profiles of the water vapor mixing ratio channel of the same system. In the near future, we will add a scanning unit to the system. This will enable us to calibrate and compare the CO2 lidar data with in-situ instruments located at the ground. Furthermore, the identification and quantification of carbon sources and sinks along the surface will then be possible. References:[1] Späth, F., S. Morandage, A. Behrendt, T. Streck, and V. Wulfmeyer, 2021: The Land-Atmosphere Feedback Observatory (LAFO). EGU21-7693 (2021). DOI:10.5194/egusphere-egu21-7693[2] Lange, D. et al.: Compact Operational Tropospheric Water Vapor and Temperature Raman Lidar with Turbulence Resolution. Geophys. Res. Lett. (2019). DOI:10.1029/2019GL085774
Carbon dioxide is the most important greenhouse gas caused by emissions from human activities. Nevertheless, little is known about its distribution in the atmposphere. Thus, continuous CO2 measurements not only on the ground but also in higher altitudes are key to improve our understanding of radiative forcing. Therefore, ground-based lidar systems with their ability of range-resolved CO2 measurements are particularly interesting. In the recent two years, we have developed and incorporated a new channel to our ground-based Raman lidar system ARTHUS ("Atmospheric Raman Temperature and HUmidity Sounder") [1] and successfully collected more then 70 days of CO2 profiles at the “Land-Atmosphere Feedback Observatory” (LAFO), in Stuttgart, Germany [2]. We utilize the 2ν2 CO2 Raman line, which is well separated from Raman lines of other atmosphere gases, especially O2. With the current setup, we profile CO2, temperature and humidity as well as particle extinction and particle backscatter coefficients in five receiver channels. The first CO2measurements in 2023 with a preliminary calibration where already presented at the EGU24 [3]. Since then, the laser power has been doubled while still being an eye-safe system. With some other improvements in addition, the integration times needed at night and for a resolution of 300 m are for example 1.5 hours for an uncertainty of 1.5 ppm and 2 hours for an uncertainty of 2 ppm at altitudes of 500 m and 1 km, respectively. We are currently (January 2025) adding a 2-mirror scanner to the system. With this, we will much better calibrate our CO2 mixing ratio with low-level scans near our ground-based in-situ sensors located at the LAFO site. The scanning measuements of the CO2 concentration will provide insights in its distribution around the surface sensors and enable us to identify and quantify local carbon sources and sinks. We will present the recent approaches and first scanning measurements at the EGU25. References: [1] Lange, D. et al.: Compact Operational Tropospheric Water Vapor and Temperature Raman Lidar with Turbulence Resolution. Geophys. Res. Lett. (2019). DOI: 10.1029/2019GL085774 [2] Späth, F., S. Morandage, A. Behrendt, T. Streck, and V. Wulfmeyer, 2021: The Land-Atmosphere Feedback Observatory (LAFO). EGU21-7693 (2021). DOI: 10.5194/egusphere-egu21-7693 [3] Schumacher, M., D. Lange, A. Behrendt, V. Wulfmeyer, 2024: Measurements of CO2Profiles in the Lower Troposphere with the new Raman Lidar Channel of ARTHUS. EGU24-9219 (2024). DOI: 10.5194/egusphere-egu24-9219
High-resolution measurements of water vapor concentrations and their transport throughout the turbulent planetary boundary layer (PBL) and beyond are key for an enhanced understanding of atmospheric processes. This study presents data from the mobile Atmospheric Monitoring System (ATMONSYS) Differential Absorption Lidar (DIAL), operated with a novel titanium sapphire (Ti:Sa) laser concept, for the first time. The ATMONSYS DIAL aims to resolve turbulence throughout the PBL with a sampling frequency of 10 s and vertical resolutions of less than 200 m. General measuring capabilities during high-noon, clear-sky, summer conditions with a maximum vertical measurement range of >3 km and statistical uncertainties of <5 % are demonstrated. The analysis of turbulence spectra shows good agreement with Kolmogorov's law, demonstrating the system's capability to resolve turbulence. However, deviations from Kolmogorov behavior are observed at certain frequency ranges. By combining the ATMONSYS DIAL with an adjacent high-quality Doppler wind lidar, some of these deviations are mitigated in the co-spectra due to independent noise from both instruments. However, intermediate deviations from Kolmogorov behavior persist, likely due to surrounding surface heterogeneities. The agreement of the co-spectra with Kolmogorov's law at the highest frequencies demonstrates that the ATMONSYS DIAL is capable of resolving turbulent latent energy fluxes down to the measurement's Nyquist frequency of 5x10(-2)Hz. A system cross-intercomparison of the ATMONSYS DIAL with two adjacent water vapor Raman lidars and radiosondes shows overall good agreement between the sensors, despite minor DIAL deficiencies under certain conditions with broken clouds passing over the lidar. The observed profile-to-profile DIAL fluctuations and sensor-to-sensor deviations, in combination with low statistical uncertainty, highlight the advantage of humidity lidars, such as the ATMONSYS DIAL, in capturing both short-term and small-scale dynamics of the lowermost atmosphere.
We present ongoing work within the Land-Atmosphere Feedback Initiative (LAFI) [1]. LAFI is funded by the Deutsche Forschungsgemeinschaft (DFG) and is located at the University of Hohenheim, Stuttgart. LAFI's objective is to quantify and understand land-atmosphere feedbacks by utilizing synergetic observations and simulations in an interdisciplinary way. One aspect is covered by this work, which aims to provide a better understanding of fluxes in the convective boundary layer (CBL), especially the latent and sensible heat flux. The focus lies on entrainment fluxes in the interfacial layer (IL), the uppermost layer of the CBL, which marks the transition to the free atmosphere (FA).A key aspect of this work is setting up a comprehensive dataset. This should capture all relevant variables such as temperature, humidity, and wind of the lower atmosphere at high spatial and temporal resolutions for as many cloud-free CBL situations as possible. Accordingly, simultaneous and high-resolution data from the synergetic use of different lidar systems will be used (see [2]) and processed (see [3]). Next, we will analyze this data for the driving variables and possible parameterizations of the latent and sensible heat flux.We have already started this work by building a dataset containing data from the Atmospheric Radiation Measurement Climate Research Facility (ARM) Southern Great Plains (SGP) site in Oklahoma, USA, and testing a similarity relationship for the latent heat flux in the IL in [4].Corresponding first results could not confirm the proposed similarity relationship for the latent heat flux in the IL from [2] and will be presented at the conference. Additionally, correlations of the flux with other measured variables, as well as an example case representative for the pool of selected cases will be shown.In the coming months, we will expand the dataset to other measurement campaigns, like the synergy of Raman and Doppler lidar systems within LAFI in 2025.References:[1] https://www.lafi-dfg.de/[2] Wulfmeyer, Volker et al. (2016): Determination of Convective Boundary Layer Entrainment Fluxes, Dissipation Rates, and the Molecular Destruction of Variances: Theoretical Description and a Strategy for Its Confirmation with a Novel Lidar System Synergy. In Journal of the Atmospheric Sciences 73 (2), pp. 667–692. DOI: 10.1175/JAS-D-14-0392.1[3] Behrendt, Andreas et al. (2020): Observation of sensible and latent heat flux profiles with lidar. In Atmos. Meas. Tech. 13 (6), pp. 3221–3233. DOI: 10.5194/amt-13-3221-2020[4] von Klitzing, Linus (2024): Latent Heat Entrainment Flux Similarity Relationships for the Convective Boundary Layer. Master's dissertation. University of Hohenheim, Stuttgart. Institute of Physics and Meteorology
We will give an update of our recent activities regarding automated high-resolution temperature and humidity lidar.The Raman lidar ARTHUS (Atmospheric Raman Temperature and HUmidity Sounder) of University of Hohenheim is an automated instrument with continuous operation (Lange et al., 2019; Wulfmeyer and Behrendt, 2022). Besides being operated during several field campaigns elsewhere, ARTHUS is usually located at the LAFO (Land Atmospheric Feedback Observatory) near the agricultural research fields of our university. Here, in addition, three scanning Doppler lidars, a Doppler cloud radar, two meteorological 10-m towers with eddy-covariance stations, as well as surface and sub-surface sensors are collecting routinely data. These data are combined with detailed vegetation analyses.ARTHUS is an eyesafe Raman lidar using a diode-pumped Nd:YAG laser as transmitter. Only the third-harmonic radiation at 355 nm is – after beam expansion – transmitted into the atmosphere. The laser power is about 20 W at 200 Hz repetition rate. The receiving telescope has a diameter of 40 cm. A polychromator extracts the elastic backscatter signal and four inelastic signals, namely the vibrational Raman signal of water vapor and CO2 molecules, and two pure rotational Raman signals. The raw data is stored with a resolution of 7.5 m and typically 1 to 10 s. All five signals are simultaneously analyzed and stored in both photon-counting (PC) mode and voltage (so-called “analog” mode) in order to make optimum use of the large intensity range of the backscatter signals covering several orders of magnitude. Primary data products are temperature, water vapor mixing ratio, carbon dioxide mixing ratio, particle backscatter coefficient, and particle extinction coefficient. The high resolution allows studies of boundary layer turbulence (Behrendt et al, 2015) and - in combination with the vertical pointing Doppler lidar - sensible and latent heat fluxes (Behrendt et al, 2020).Further refined lidars like ARTHUS are offered by the company Purple Pulse Lidar Systems (www.purplepulselidar.com). Meanwhile three more systems have been built and are operating.At the conference, we will present the recent advances in these powerful automated temperature and humidity lidars and show highlights of the measurements. References:Behrendt et al. 2015, https://doi.org/10.5194/acp-15-5485-2015Behrendt et al. 2020, https://doi.org/10.5194/amt-13-3221-2020Lange et al. 2019, https://doi.org/10.1029/2019GL085774Wulfmeyer and Behrendt 2022, https://doi.org/10.1007/978-3-030-52171-4_25
A simultaneous deployment of Doppler, temperature, and water-vapor lidars is able to provide profiles of molecular destruction rates and turbulent kinetic energy (TKE) dissipation in the convective boundary layer (CBL). Horizontal wind profiles and profiles of vertical wind, temperature, and moisture fluctuations are combined, and transversal temporal autocovariance functions (ACFs) are determined for deriving the dissipation and molecular destruction rates. These are fundamental loss terms in the TKE as well as the potential temperature and mixing ratio variance equations. These ACFs are fitted to their theoretical shapes and coefficients in the inertial subrange. Error bars are estimated by a propagation of noise errors. Sophisticated analyses of the ACFs are performed in order to choose the correct range of lags of the fits for fitting their theoretical shapes in the inertial subrange as well as for minimizing systematic errors due to temporal and spatial averaging and micro- and mesoscale circulations. We demonstrate that we achieve very consistent results of the derived profiles of turbulent variables regardless of whether 1 or 10 s time resolutions are used. We also show that the temporal and spatial length scales of the fluctuations in vertical wind, moisture, and potential temperature are similar with a spatial integral scale of ≈160 m at least in the mixed layer (ML). The profiles of the molecular destruction rates show a maximum in the interfacial layer (IL) and reach values of ϵm≃7×10⁻⁴ g2 kg−2 s−1 for mixing ratio and ϵθ≃1.6×10⁻³ K2 s−1 for potential temperature. In contrast, the maximum of the TKE dissipation is reached in the ML and amounts to ≃10-2 m2 s−3. We also demonstrate that the vertical wind ACF coefficient kw∝w′2‾ and the TKE dissipation ϵ∝w′2‾3/2. For the molecular destruction rates, we show that ϵm∝m′2‾w′2‾1/2 and ϵθ∝θ′2‾w′2‾1/2. These equations can be used for parameterizations of ϵ, ϵm, and ϵθ. All noise error bars are derived by error propagation and are small enough to compare the results with previous observations and large-eddy simulations. The results agree well with previous observations but show more detailed structures in the IL. Consequently, the synergy resulting from this new combination of active remote sensors enables the profiling of turbulent variables such as integral scales, variances, TKE dissipation, and the molecular destruction rates as well as deriving relationships between them. The results can be used for the parameterization of turbulent variables, TKE budget analyses, and the verification of large-eddy simulations.
Abstract. We used a combination of two Doppler lidars (DLs) and an eddy covariance station at the Land-Atmosphere Feedback Observatory (LAFO), Stuttgart, Germany, to investigate relationships between surface fluxes, convective boundary layer (CBL) height, and profiles of vertical wind variance, horizontal wind variance and turbulent kinetic energy (TKE). One DL was operated in vertical-pointing mode and the other in six-beam scanning mode. Daytime statistics were derived from 20 convective days from May to July 2021. In this data set, the mean CBL height 〈𝑧𝑖〉 showed a maximum of (1.53 ±0.07) km between 13:00 and 14:00 UTC, which is about 1.5 to 2.5 hours after local noon. We found counterclockwise hysteresis patterns between the CBL height and the surface fluxes. In the development phase, these relationships were approximately linear. In the early afternoon, the relationships reached a peak phase with both large fluxes and high values of 〈𝑧𝑖〉. At 12:00 UTC, just after local noon, the maximum values of vertical, horizontal, and total TKE were 0.55 m2s-2, 1.26 m2s-2 and 1.71 m2s-2 at heights of (0.30 ± 0.06)⟨𝑧𝑖⟩ , (0.56 ± 0.06)⟨𝑧𝑖⟩, and (0.40 ± 0.06)⟨𝑧𝑖⟩, respectively. In the decay phase in the late afternoon, the relationships show non-linear patterns with larger values of 〈𝑧𝑖〉 for the same surface fluxes than in the morning. Furthermore, we show relationships between the vertical and horizontal components and total TKE.
We assess the temperature stability requirements of unseeded Nd:YAG lasers in lidar systems for atmospheric temperature profiling through the rotational Raman technique. Taking as a reference a system using a seeded laser assumed to emit pulses of negligible spectral width and free of wavelength drifts, we estimate first the effect of the pulse spectral widening of the unseeded laser on the output of the interference filters, and then we derive the limits of the allowable wavelength drift for a given bias in the temperature measurement that would add to the noise-induced uncertainty. Finally, using spectroscopic data, we relate the allowable wavelength drift to allowable temperature variations in the YAG rod. We find that, in order to keep the bias affecting atmospheric temperature measurements smaller than 1 K, the Nd:YAG rod temperature should also be kept within a variation range of 1 K.
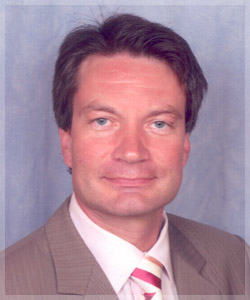 Volker Wulfmeyer合作论文数Institute of Physics and Meteorology, University of Hohenheim;Faculty of Natural Sciences, University of Hohenheim190
 Späth Florian合作论文数54
 Paolo Di Girolamo合作论文数Dipartimento di Ingegneria e Fisica dell'Ambiente (DIFA),, Universita degli Studi della Basilicata45
 Diego Lange合作论文数40
 Sandip Pal合作论文数Department of Environmental Sciences, University of Virginia29
 Ulrich Corsmeier合作论文数Institute for Meteorology and Climate Research, Karlsruhe Institute of Technology (KIT)26
 Shravan Kumar Muppa合作论文数Bayreuth Center of Ecology and Environmental Research, University of Bayreuth23Christoph Elschenbroich合作论文数19
 Cyrille Flamant合作论文数Institut National des Sciences de l'univers, French National Centre for Scientific Research19
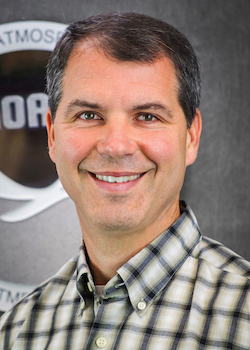 Dave Turner合作论文数Global Systems Laboratory, National Oceanic and Atmospheric Administration19
 Manfred Dorninger合作论文数18
 Christoph Kottmeier合作论文数Institut für Meteorologie und Klimaforschung, Universität Karlsruhe (TH)/Forschungszentrum18
 Evelyne Richard合作论文数16
 Norbert Kalthoff合作论文数Institute of Meteorology and Climate Research, Karlsruhe Institute of Technology16Hans-Stefan Bauer合作论文数15Jens Reichardt合作论文数15Thomas Schwitalla合作论文数15
 Andreas Wieser合作论文数14
 Christian Barthlott合作论文数Institut für Meteorologie und Klimaforschung, Universität Karlsruhe14Takuji Nakamura合作论文数13
 Alan Blyth合作论文数School of Earth and Environment, Faculty of Environment, University of Leeds;National Centre for Atmospheric Science, University of Leeds13M. Radlach合作论文数13Summa Donato合作论文数Dipartimento di Ingegneria e Fisica dell'Ambiente, Università degli Studi della Basilicata12Christoph J. Senff合作论文数U.S.A Boulder CO U.S.A, NOAA Environmental Technology Laboratory12Simon Metzendorf合作论文数11
 Susanne Crewell合作论文数Institut für Geophysik und Meteorologie, Mathematisch-Naturwissenschaftliche Fakultät, Universität zu Köln11Oliver Branch合作论文数Inst Phys & Meteorol, Univ Hohenheim10
 Klaus Harms合作论文数Fachbereich Chemie, Universität Marburg10
 Mathias W. Rotach合作论文数Department of Atmospheric and Cryospheric Sciences, University of Innsbruck;Institute for Meteorology and Geophysics, University of Innsbruck;Das Wasserforschungs-Institut des ETH-Bereichs;Institute of Atmospheric and Cryospheric Sciences, University of Innsbruck10
 Christoph Kiemle合作论文数10A. Riede合作论文数9Andrea Riede合作论文数9Heinz Bauer合作论文数9
 Martin Hagen合作论文数9Jan Handwerker合作论文数9
 Thilo Streck合作论文数Institute of Soil Science and Land Evaluation, University of Hohenheim (310d),9
 David Neil Whiteman (David N. Whiteman)合作论文数Howard University9W. Alan Brewer合作论文数9Gerd Wagner合作论文数8
 Richard Ferrare合作论文数NASA Langley Research Center8Katja Traumner合作论文数Forschungszentrum Karlsruhe8
 Tammy Weckwerth合作论文数Earth Observing Lab, National Center for Atmospheric Research8
 Marco Arpagaus合作论文数Fed Off Meteorol & Climatol, MeteoSwiss8
 Takuo Tsuda (津田卓雄)合作论文数Department of Computer and Network Engineering, Graduate School of Informatics and Engineering, The University of Electro-Communications;Nagoya University;National Institute of Polar Research;RIKEN;Center for Space Science and Radio Engineering, The University of Electro-Communications8Osama Alnayef合作论文数7
 Joachim Ingwersen合作论文数Institute of Soil Science and Land Evaluation, University of Hohenheim7
 Edward V. Browell合作论文数NASA Langley Research Center7
 Jörg Trentmann合作论文数Deutscher Wetterdienst7
 Stephen Mobbs合作论文数University of Leeds7




