This paper assesses the environmental sustainability of Japan by applying the environmental sustainability gap (ESGAP) framework, which builds on the concepts of strong sustainability, critical natural capital, environmental functions, and science-based reference values. The assessment is carried out using two indices of environmental sustainability (Strong Environmental Sustainability Index (SESI) and Strong Environmental Sustainability Progress Index (SESPI)) that provide a snapshot and a trend perspective on environmental sustainability performance and on progress toward it. The results reveal that Japan has not experienced significant changes in terms of aggregate environmental sustainability throughout the 2011–2017 period, but this is primarily a consequence of the mutually offsetting movements of different indicators. The country performs best for the human health and other welfare indicators, but worst for the sink function indicators such as the per-capita CO 2 emissions and the eutrophication of fresh water. The indices also expose the main policy areas that Japan needs to strengthen to improve its environmental performance. They include issues such as tropospheric ozone pollution, which has long been discussed in scientific literature but never been a primal policy focus of the government until very recently.
Composite indicators are widely used to represent sustainability or its underlying dimensions. Nonetheless, an alignment between the multiple choices made during their construction and the underlying conceptual framework is often lacking. This reduces the relevance of the composite indicator.This paper provides an overview of the theoretical implications of the choices made during the construction of strong sustainability indices, particularly focusing on reflecting environmental sustainability and the limited substitution capacity between different types of capitals. The theoretical perspective is complemented through an uncertainty analysis of the Strong Environmental Sustainability Index and the Sustainable Human Development Index in which the quantitative implications of choices made in the indicator selection, normalisation, weighting and aggregation processes are assessed.The results show that different choices significantly affect country scores. Given the conceptual implications of these choices in relation to strong sustainability, we conclude that the choices made during the construction of a composite indicator need to be aligned with the underlying conceptual framework. In a context in which a growing number of composite indicators is produced every year, it becomes of utmost importance to make sure that those that percolate to the decision-making process monitor what they are intended to monitor.
Non-technical summary The Sustainable Development Goals (SDG) are at the core of the development agenda. Despite their wide adoption, it is still unclear the extent to which they can provide insights on environmental sustainability. The paper presents an assessment of the potential of the indicators used in the SDGs to track environmental sustainability. The results show that only a few SDG indicators describe the state of the environment, and those that do so, do not, generally, have science-based targets that describe whether environmental sustainability conditions are met. The latter aspect should be reinforced in framework that will replace the SDGs after 2030.Technical summary The Sustainable Development Goals (SDG) are at the core of the development agenda. Despite their wide adoption, it is still unclear whether they can be used to monitor environmental sustainability, if this is to be understood from a strong sustainability perspective. The paper presents an assessment of the adequacy of the indicator sets used by United Nations, Eurostat, OECD, and the Sustainable Development Solutions Network for strong sustainability monitoring. The results show that most environmental indicators do not have science-based environmental standards that reflect whether natural capital meets environmental sustainability conditions, thereby preventing their use as strong sustainability indicators. While meeting the SDGs would likely contribute to improving environmental performance, on their own they are not adequate to monitor progress toward it. Complementary scientifically grounded metrics are needed to track the underlying state of natural capital that provides non-substitutable functions. The strong sustainability dimension within the SDGs will need to be strengthened in post-2030 sustainable development monitoring framework.Social media summary The Sustainable Development Goals are insufficient to monitor environmental sustainability.
Current environmental and sustainable development metrics fail to capture environmental sustainability from a strong sustainability perspective, which can lead to misleading messages around the urgency to reduce environmental degradation. The Environmental Sustainability Gap (ESGAP) framework addresses this measurement gap with metrics that reflect whether the functions of natural capital can be sustained in the long term. To date, the framework has been implemented through the Strong Environmental Sustainability Index (SESI), which provides a 'snapshot' perspective on whether countries meet science-based environmental standards for a wide range of environmental and resource topics at a given point in time. However, SESI does not show whether countries are moving towards or away from environmental sustainability. This is a perspective often overlooked in many environmental and sustainable development metrics. To address this research gap, this paper presents the Strong Environmental Sustainability Progress Index (SESPI). SESPI comprises 19 indicators. For each of these indicators, it measures whether under current trends, standards of environmental sustainability would be reached in 2030. The resulting information is normalised, weighted and aggregated into a single index that has been computed for 28 European countries. The results show mixed progress for Europe with notable differences between countries and indicators, but generally speaking, it can be concluded that Europe is not on a sustainable path. All in all, SESPI can answer the question of whether we are making progress towards environmental sustainability and make the main messages more digestible to decision-makers and the general public.
Several safe boundaries of critical Earth system processes have already been crossed due to human perturbations; not accounting for their interactions may further narrow the safe operating space for humanity. Using expert knowledge elicitation, we explored interactions among seven variables representing Earth system processes relevant to food production, identifying many interactions little explored in Earth system literature. We found that green water and land system change affect other Earth system processes strongly, while land, freshwater and ocean components of biosphere integrity are the most impacted by other Earth system processes, most notably blue water and biogeochemical flows. We also mapped a complex network of mechanisms mediating these interactions and created a future research prioritization scheme based on interaction strengths and existing knowledge gaps. Our study improves the understanding of Earth system interactions, with sustainability implications including improved Earth system modelling and more explicit biophysical limits for future food production.
EXIOBASE 3 provides a time series of environmentally extended multi-regional input‐output (EE MRIO) tables ranging from 1995 to a recent year for 44 countries (28 EU member plus 16 major economies) and five rest of the world regions. EXIOBASE 3 builds upon the previous versions of EXIOBASE by using rectangular supply‐use tables (SUT) in a 163 industry by 200 products classification as the main building blocks. The tables are provided in current, basic prices (Million EUR). For any questions regarding access, support or licence clarification please email: exiobase-support@googlegroups.com . The database is provided free of charge to users under a CC-BY-SA license. There is a discussion about different licence options, please reach out for information. For help in use of EXIOBASE data for spend-based emission factors, email exiobase-support@googlegroups.com EXIOBASE 3 is the culmination of work in the FP7 DESIRE project and builds upon earlier work on EXIOBASE 2 in the FP7 CREEA project and EXIOBASE 1 of the FP6 EXIOPOL project. These databases are available at the official EXIOBASE website. A special issue of Journal of Industrial Ecology (Volume 22, Issue 3) describes the build process and some use cases of EXIOBASE 3. This includes the article by Stadler et. al 2018 describing the compilation of EXIOBASE 3. Further informations (data quality, updates, ...) can be found in the blog post describing a previous release at the Environmental Footprints webpage. Various concordance tables for the database are available here. For more (background) information see the Readme file. For any questions regarding access, support or licence options please email: exiobase-support@googlegroups.com Previous EXIOBASE 3 Versions Some previous versions (3.7, 3.8) are also available on Zenodo. The even earlier public releases of the data (EXIOBASE v3.3 and v3.4) are available upon request. We recommend, however, to use the latest version due to significant updates of the economic data as well as major differences in water and land use accounts. End year The original EXIOBASE 3 data series ends 2011. In addition, we also have estimates based on a range of auxiliary data, but mainly trade and macro-economic data which go up to 2022 when including IMF expectations. A lot of care must be taken in use of this data. It is only partially suitable for analyzing trends over time! New data incorporating a full update for all SUTs to 2020 is soon available on request, reach out to exiobase-support@googlegroups.com The basic description of the process employed is in the relevant deliverable (link to pdf download).. As of v3.8 (doi: 10.5281/zenodo.4277368), the end years of real data points used are: 2015 energy, 2019 all GHG (non fuel, non-CO2 are nowcasted from 2018), 2013 material, 2011 for most others, land, water. More details are available in the readme file. The EXIOBASE country disaggregated dataset EXIOBASE3rx provides land updates to 2015. Some work is going on to update the extensions, but other collaborative efforts are more than welcome. Bulk Download To allow the download of specific years we uploaded the data as zip archives per year and mrio type (industry by industry: ixi, and product by product: pxp). If you need all data, we recommend the excellent zenodo_get python utility for the download. After installing the tool, you can download the latest version with: zenodo_get 10.5281/zenodo.3583070 Previous versions are available by replacing the latest DOI with previous record numbers. Alternatively, you can contact us at exiobase-support@googlegroups.com for alternative access options. IOT download and Pymrio integration If your are only interested in the IO tables, Pymrio (version >= 0.4.5) includes an automatic EXIOBASE 3 download function which works with the EXIOBASE upload on zenodo. The EXIOBASE 3 files can then be parsed and analysed directly. Nomenclature Archives: IOT_YYYY_ixi.zip - MRIO archive for Year YYYY in industry by industry format IOT_YYYY_ixi.zip - MRIO archive for Year YYYY in product by product format MRSUT_YYYY.zip - Multi-regional Supply-Use table for year YYYY SUT.zip - Domestic Supply Use for each country and year Content of IOT*.zip: (the archive can be read directly by pymrio without unpacking). The economic core is stored in the root of the archive, containing among others: Z.txt - flow/transactions matrix A.txt - matrix/inter-industry coefficients, (direct requirements matrix) Y.txt - final demand x.txt - gross/total output unit.txt - Units of the flow data We provide two set of extension data (stored in the sub-folders with the same name): satellite - uncharacterized stressors data - e.g. CO2 emissions, land use per category, etc. impacts - characterized stressors (=> impacts) - e.g. total GWP100, total land use, etc The total list of stressors and impacts are in the index of all files, most conveniently in the 'unit.txt'. Both extension subfolder contain: F.txt - Factors of productions/stressors/impacts F_Y.txt - Stressors/impacts of the final demand, S.txt - Direct stressor/impact coefficients S_Y.txt - Stressor/impact coefficients of the final demand M.txt - MRIO extension multipliers (total requirement factors of consumption) D_cba.txt - Consumption based accounts per sector D_pba.txt - Production based accounts per sector D_cba_reg.txt - Consumption based accounts per region D_pba_reg.txt - Production based accounts per region D_imp_reg.txt - Import accounts per region D_exp_reg.txt - Export accounts per region unit.txt - Absolute units of the stressor and impacts The unit of the coefficient data M and S are given be the unit of the satellite account per unit of the economic core (e.g. kg CO2eq/Million Euro) Announcements We use the EXIOBASE google group for announcing new versions of the database. For any questions regarding access, support or licence options please email: exiobase-support@googlegroups.com
Countries still lack adequate metrics to monitor environmental sustainability across a range of relevant environmental and resource issues. The Strong Environmental Sustainability Index (SESI), which is based on the Environmental Sustainability Gap (ESGAP) framework, is intended to fill this gap. SESI is the result of aggregating 21 indicators across different dimensions. Each of the underlying indicators is related to the functions of natural capital and normalised using science-based targets. SESI uses the geometric mean to aggregate in order to reflect the limited substitutability between the functions of natural capital. The results of the index, which is computed for 28 European countries, show that several functions of natural capital are impaired in Europe. Countries tend to perform worse in indicators related to pollution and ecosystem health, compared to indicators that describe the provision of natural resources, and human health and welfare. Because the results are sensitive to assumptions in the normalisation, weighting and aggregation processes, the relevant choices have been aligned with the theoretical underpinnings of the ESGAP framework. SESI responds to the demands of the 'Beyond GDP' community on the need for a single environmental sustainability metric that can complement GDP in its (mis-)use as a headline indicator for development.
Sustainability endorses high quality, long-lasting goods. Durable goods, however, often require substantial amounts of energy during their production and use-phase and indirectly through complementary products and services. We quantify the global household's final energy footprints (EFs) of durable goods and the complementary goods needed to operate, service and maintain durables. We calculate the EFs of 200 goods across 44 individual countries and 5 world regions for the period of 1995-2011. In 2011, we find 68% of the total global household's EF (218 EJ) is durable-related broken down as follows: 10% is due to the production of durables per se, 7% is embodied in goods complementary to durables (consumables and services) and 51% is operational energy. At the product level, the highest durable-related EFs are: transport goods (148-648 MJ/cap), housing goods (40-811 MJ/cap), electric appliances (34-181 MJ/cap), and "gas stoves and furnaces" (40-100 MJ/cap). Between 1995 and 2011, the global household EF increased by 28% (48 EJ), of which 72% was added by durable-related energy. Globally, a 10% income growth corresponded to an increase in EF by 9% in durables, 11% in complementary consumables and 13% in complementary services-with even higher elasticities in the emerging economies. The average EF of the emerging economies (35 GJ/cap) is 2.5 times lower than in advanced economies (86 GJ/cap). Efficiency gains were detected in 47 out of 49 regions, but only 16 achieved net energy reductions. The large share of durable-related EF across regions (40-88%) confirms the dominance of durables in driving EFs, but the diversity of patterns suggests that policy and social factors influence durable-dependency. Demand-side solutions targeting ownership and inter-linkages between durables and complements are key to reduce global energy demand.
Despite the overwhelming scientific evidence on the ongoing degradation of the environment, there is a clear gap between the urgency of the environmental crisis and the policy measures put in place to tackle it. Because of the role of metrics in environmental governance, the way environmental information is translated into metrics is of utmost relevance. In this context, we propose criteria to assesses the suitability of environmental metrics to monitor environmental sustainability at the national level. After assessing well-known environmental metrics such as the Sustainable Development Goals indicators and the Environmental Performance Index, we conclude that countries still lack robust and resonant metrics to monitor environmental sustainability. In order to bridge this metric gap, we present the Environmental Sustainability Gap (ESGAP) framework, which builds on the concepts of strong sustainability, critical natural capital, environmental functions and science-based targets. Different composite indicators are proposed as part of the ESGAP framework. Through these metrics, the framework has the potential to embed strong sustainability thinking and science-based targets in nations in which these concepts are not currently sufficiently reflected in policies.
The number of input-output assessments focused on energy has grown considerably in the last years. Many of these assessments combine data from multi-regional input-output (MRIO) databases with energy extensions that completely or partially depict the different stages through which energy products are supplied or used in the economy. The improper use of some energy extensions can lead to double accounting of some energy flows, but the frequency with which this happens and the potential impact on the results are unknown. Based on a literature review, we estimate that around a quarter of the MRIO-based energy assessments reviewed incurred into double accounting. Using the EXIOBASE MRIO database, we also analyse the effects of double accounting in the absolute values and rankings of different countries' and products' energy footprints. Building on the insights provided by our analysis, we offer a set of key recommendations to MRIO users to avoid the double accounting problem in the future. Likewise, we conclude that the harmonisation of the energy data across MRIO databases led by experts could simplify the choices of the data users until the provision of official energy extensions by statistical offices becomes a widespread practice.
China is increasingly known for its ambitions towards an 'ecological civilisation' and a circular economy. Our article assesses the implications of an accelerated shift towards steel recycling in China. Given the relevance of steel for development worldwide as well as its environmental intensity, any such shift is likely to have implications for competitiveness in China and beyond. Recent findings suggest that China could take advantage of an increasing availability of obsolete steel scrap in the coming decades, moving towards more circular, and potentially greener, steel production. We assess such industrial restructuring from an economic perspective and address the competitiveness of China relative to other developing and industrialised regions. The analysis uses a novel global economy-wide modelling framework (ENGAGE-materials) to assess the aggregate and sector-level impacts of different scrap use options in China in the 2019-2030 time frame. The results show moderate GDP gains for China of cumulated USD 589 billion in GDP gains by 2030 despite a replacement of primary steel capacity. A more comprehensive industrial policy mix aimed at improved recycling practices and more adaptive downstream sectors could increase gains to USD 819 billion. The international implications are mixed, with losses for iron ore producers (Australia, Brazil and India) and gains for most developing countries benefiting from lower steel prices. Another result is an increasing demand for coal in electricity production if such a shift wouldn't be aligned with an accelerated energy transition towards low carbon pathways. We discuss policy implications of such alignment, potential co-benefits, and a need for green international partnerships. (C) 2019 Elsevier Ltd. All rights reserved.
The global food system is a major energy user and a relevant contributor to climate change. To date, the literature on the energy profile of food systems addresses individual countries and/or food products, and therefore a comparable assessment across regions is still missing. This paper uses a global multi‐regional environmentally extended input–output database in combination with newly constructed net energy‐use accounts to provide a production and consumption‐based stock‐take of energy use in the food system across different world regions for the period 2000–2015. Overall, the ratio between energy use in the food system and the economy is slowly decreasing. Likewise, the absolute values point toward a relative decoupling between energy use and food production, as well as to relevant differences in energy types, users, and consumption patterns across world regions. The use of (inefficient) traditional biomass for cooking substantially reduces the expected gap between per capita figures in high‐ and low‐income countries. The variety of energy profiles and the higher exposure to energy security issues compared to the total economy in some regions suggests that interventions in the system should consider the geographical context. Reducing energy use and decarbonizing the supply chains of food products will require a combination of technological measures and behavioral changes in consumption patterns. Interventions should consider the effects beyond the direct effects on energy use, because changing production and consumption patterns in the food system can lead to positive spillovers in the social and environmental dimensions outlined in the Sustainable Development Goals.
Energy demand in global climate scenarios is typically derived for sectors - such as buildings, transportation, and industry - rather than from underlying services that could drive energy use in all sectors. This limits the potential to model household consumption and lifestyles as mitigation options through their impact on economy-wide energy demand. We present a framework to estimate the economy-wide energy requirements and carbon emissions associated with future household consumption, by linking Industrial Ecology tools and Integrated Assessment Models (IAM). We apply the framework to assess final energy and emission pathways for meeting three essential and energy-intensive dimensions of basic well-being in India: food, housing and mobility. We show, for example, that nutrition-enhancing dietary changes can reduce emissions by a similar amount as meeting future basic mobility in Indian cities with public transportation. The relative impact of energy demand reduction measures compared to decarbonization differs across these services, with housing having the lowest and food the highest. This framework provides complementary insights to those obtained from IAM by considering a broader set of consumption and well-being-related interventions, and illustrating trade-offs between demand and supply-side options in climate stabilization scenarios.
Several studies have proposed maximum allowable areas of cropland (12.6–15.18% of terrestrial area) as environmental sustainability requirements, yet none have so far considered the minimum biodiversity levels required to support ecosystem functioning at acceptable levels. Here, we use a decision tree-based optimization model to estimate the maximum area of cropland and pasture that would meet—or come closest to meeting—the acceptable levels of local biodiversity proposed in the literature (90% local species abundance and 80% local species richness compared with an undisturbed baseline). We model four scenarios under which we vary two key sources of uncertainty: the maximization function and the potential of secondary vegetation to maintain biodiversity. The model finds that a maximum of 4.62–11.17% of the global ice-free land can be allocated to cropland (and 7.86–15.67% to pasture) to meet these biodiversity constraints—a lower level than was suggested in previous studies. The results are very sensitive to the minimum acceptable biodiversity values and the biodiversity response factors used, but the size of the disparity between current cropland area and our results suggests that actions to limit or reduce the area dedicated to agriculture should feature more prominently in policy discussions. Agricultural expansion removes habitat vital for biodiversity. This modelling study finds that 4.6–11.2% of global ice-free land can be devoted to crops and 7.9–15.7% to pasture to support commonly suggested levels of local biodiversity—less than suggested in previous studies.
Stadler, Konstantin; Wood, Richard; Bulavskaya, Tatyana; Sodersten, Carl-Johan ; Simas, Moana; Schmidt, Sarah ; Usubiaga, Arkaitz; Acosta-Fernández, José; Kuenen, Jeroen; Bruckner, Martin ; Giljum, Stefan ; Lutter, Stephan ; Merciai, Stefano; Schmidt, Jannick Højrup; Theurl, Michaela C. ; Plutzar, Christoph ; Kastner, Thomas ; Eisenmenger, Nina ; Erb, Karl-Heinz ; Koning, Arjan de ; Tukker, Arnold
Environmentally extended multiregional input‐output (EE MRIO) tables have emerged as a key framework to provide a comprehensive description of the global economy and analyze its effects on the environment. Of the available EE MRIO databases, EXIOBASE stands out as a database compatible with the System of Environmental‐Economic Accounting (SEEA) with a high sectorial detail matched with multiple social and environmental satellite accounts. In this paper, we present the latest developments realized with EXIOBASE 3—a time series of EE MRIO tables ranging from 1995 to 2011 for 44 countries (28 EU member plus 16 major economies) and five rest of the world regions. EXIOBASE 3 builds upon the previous versions of EXIOBASE by using rectangular supply‐use tables (SUTs) in a 163 industry by 200 products classification as the main building blocks. In order to capture structural changes, economic developments, as reported by national statistical agencies, were imposed on the available, disaggregated SUTs from EXIOBASE 2. These initial estimates were further refined by incorporating detailed data on energy, agricultural production, resource extraction, and bilateral trade. EXIOBASE 3 inherits the high level of environmental stressor detail from its precursor, with further improvement in the level of detail for resource extraction. To account for the expansion of the European Union (EU), EXIOBASE 3 was developed with the full EU28 country set (including the new member state Croatia). EXIOBASE 3 provides a unique tool for analyzing the dynamics of environmental pressures of economic activities over time.
Konstantin Stadler ,1 Richard Wood ,1 Tatyana Bulavskaya,2 Carl-Johan Södersten,1 Moana Simas ,1 Sarah Schmidt,1 Arkaitz Usubiaga ,3 José Acosta-Fernández,3 Jeroen Kuenen,2 Martin Bruckner,4 Stefan Giljum,4 Stephan Lutter,4 Stefano Merciai,5 Jannick H. Schmidt,5 Michaela C. Theurl,6 Christoph Plutzar,6 Thomas Kastner ,6,7 Nina Eisenmenger,6 Karl-Heinz Erb,6 Arjan de Koning,8 and Arnold Tukker 8 1Industrial Ecology Programme, Norwegian University of Science and Technology (NTNU), Trondheim, Norway 2Netherlands Organisation for Applied Scientific Research (TNO), Delft, the Netherlands 3Wuppertal Institute for Climate, Environment and Energy, Wuppertal, Germany 4Vienna University of Economics and Business–Institute for Ecological Economics (WU), Vienna, Austria 52.-0 LCA consultants, Aalborg, Denmark 6Alpen Adria University–Institute of Social Ecology (UNI-KLU), Vienna, Austria 7Senckenberg Biodiversity and Climate Research Centre (SBiK-F), Frankfurt am Main, Germany 8Institute of Environmental Sciences (CML), Leiden University, Leiden, the Netherlands
SummaryFood is needed to maintain our physical integrity and therefore meets a most basic human need. The food sector got in the focus of environmental policy, because of its environmental implications and its inefficiency in terms of the amount of food lost along the value chain. The European Commission (EC) flagged the food waste issue a few years ago and adopted since then a series of policies that partially address the problem. Among these, the Resource Efficiency Roadmap set the aspirational goal of reducing the resource inputs in the food chain by 20% and halving the disposal of edible food waste by 2020. Focusing on consumer food waste, we tested what a reduction following the Roadmap's food waste target would imply for four environmental categories in EU28 (European Union 28 Member States): greenhouse gas emissions, land use, blue water consumption, and material use. Compared to the 2011 levels, reaching the target would lead to 2% to 7% reductions of the total footprint depending on the environmental category. This equals a 10% to 11% decrease in inputs in the food value chain (i.e., around half of the resource use reductions targeted). The vast majority of potential gains are related to households, rather than the food‐related services. Most likely, the 2020 target will not be met, since there is insufficient action both at Member State and European levels. The Sustainable Development Goals provide a new milestone for reducing edible food waste, but Europe needs to rise up to the challenge of decreasing its per capita food waste generation by 50% by 2030.
Replacing traditional technologies by renewables can lead to an increase of emissions during early diffusion stages if the emissions avoided during the use phase are exceeded by those associated with the deployment of new units. Based on historical developments and on counterfactual scenarios in which we assume that selected renewable technologies did not diffuse, we conclude that onshore and offshore wind energy have had a positive contribution to climate change mitigation since the beginning of their diffusion in EU27. In contrast, photovoltaic panels did not pay off from an environmental standpoint until very recently, since the benefits expected at the individual plant level were offset until 2013 by the CO2 emissions related to the construction and deployment of the next generation of panels. Considering the varied energy mixes and penetration rates of renewable energies in different areas, several countries can experience similar time gaps between the installation of the first renewable power plants and the moment in which the emissions from their infrastructure are offset.The analysis demonstrates that the time-profile of renewable energy emissions can be relevant for target setting and detailed policy design, particularly when renewable energy strategies are pursued in concert with carbon pricing through cap-and-trade systems.
Energy system optimization models (ESOMs) such as MARKAL/TIMES are used to support energy policy analysis worldwide. ESOMs cover the full life-cycle of fuels from extraction to end-use, including the associated direct emissions. Nevertheless, the life-cycle emissions of energy equipment and infrastructure are not modelled explicitly. This prevents analysis of questions relating to the relative importance of emissions associated with the build-up of infrastructure and other equipment required for decarbonization. We have soft-linked an environmentally-extended input-output (EEIO) model to a European TIMES Model (ETM-UCL) with the aim of addressing the following questions: - In what ways does the inclusion of indirect emissions change the optimal technology pathway for decarbonizing the European energy system? - How much does the present value of key low-carbon technologies change when indirect emissions are accounted for in a decarbonization scenario for Europe? We show that, although indirect emissions are a relatively small portion of overall power sector emissions (<10% in 2050), including them in the model leads to changes in the optimal power sector portfolio. Renewable energy technologies become relatively less attractive once indirect emissions are included within the optimization framework, and we quantify this effect, showing that it is not large. Changes to the relative attractiveness of specific renewable energy technologies are more pronounced than the reduction in attractiveness of renewable energy as a whole: in our main scenarios wind energy saw increased relative deployment in 2050 when indirect emissions are accounted for, since it displaced other technologies with higher life-cycle emissions (notably solar PV). Optimal cumulative installed capacity of PV in the EU 2050 is at least 7% lower when indirect emissions are included. We conclude that policy advice derived from ESOMs that focuses on the roles of specific technologies should ensure that it is robust to the possible effects of indirect emissions. (C) 2017 Elsevier Ltd. All rights reserved.
 José Acosta-Fernández合作论文数10Stefan Giljum合作论文数9
 F. Stephan Lutter合作论文数9Tatyana Bulavskaya合作论文数7
 Paul Ekins合作论文数Institute for Sustainable Resources, The Bartlett Faculty of the Built Environment, University College London7
 Jannick Schmidt合作论文数Department of Development and Planning, Aalborg University;2.-0 LCA Consultants7
 Konstantin Stadler合作论文数NTNU, Norwegian Univ Sci & Technol7
 Arnold Tukker合作论文数Institute of Environmental Sciences, Faculty of Science, Leiden University;Netherlands Organisation for Applied Scientific Research TNO7
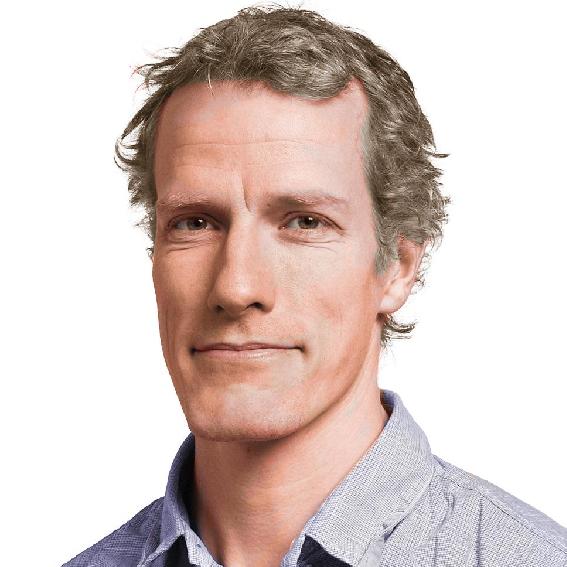 Richard Wood合作论文数Department of Energy and Process Engineering, Norwegian University of Science and Technology;School of Environmental and Life Sciences, University of Newcastle;Institute for Regional Futures, University of Newcastle;XIO Sustainability Analytics7Stefano Merciai合作论文数7
 Michaela C. Theurl合作论文数Institute of Social Ecology, University of Natural Resources and Life Sciences Vienna6Nina Eisenmenger合作论文数Institute of Social Ecology, Alpen Adria Universität6
 Moana S. Simas合作论文数SINTEF5
 Jeroen Kuenen合作论文数TNO5
 Philipp Schepelmann合作论文数Environment, Wuppertal Institute for Climate5
 Sarah Schmidt合作论文数SINTEF Energy Research4
 Carl-Johan Sodersten合作论文数SINTEF4
 Thomas Kastner合作论文数Senckenberg Biodiversity and Climate Research Centre (SBiK–F), Senckenberganlage 25, 60,325 Frankfurt-am-Main, Germany4Arjan De Koning合作论文数4
 Christoph Plutzar合作论文数Department of Conservation Biology, University of Vienna4
 Olga Ivanova合作论文数3
 Martin Bruckner合作论文数Sustainable Europe Research Institute (SERI), Garnisongasse 7/21, Vienna, Austria3
 Karlheinz Erb合作论文数Institute of Social Ecology, University of Natural Resources and Life Sciences3Bettina Bahn-Walkowiak合作论文数3Helmut Schütz合作论文数3Wittmer Dominic合作论文数2Jihoon Min合作论文数2
 Narasimha Rao合作论文数School of the Environment, Yale University2
 Alison Fairbrass合作论文数Institute for Sustainable Resources University College London/Centre for Biodiversity & Environment Research, University College London2
 William McDowall合作论文数Energy Institute, University College London/Institute of Sustainable Resources, University College London2
 Randi Dalgaard合作论文数2a de koning合作论文数1Sam Zipper合作论文数1
 Luis Lassaletta合作论文数1Arne Tobian合作论文数1
 Amandine V Pastor合作论文数Montpellier SupAgro, Univ Montpellier1Lauren Seaby Andersen合作论文数Leibniz Assoc, Potsdam Inst Climate Impact Res1
 georgina guillen合作论文数Corresponding author.1Vili Virkki合作论文数1
 Johannes Piipponen合作论文数Water & Dev Res Grp, Aalto Univ1
 Zhongxiao Sun (孙中孝)合作论文数College of Land Science and Technology, China Agricultural University1Anna Chrysafi合作论文数1
 Paul Behrens合作论文数Leiden Univ, Inst Environm Sci CML, Einsteinweg 2, NL-2333 CC Leiden, Netherlands1
 Victor Nechifor合作论文数UCL Inst Sustainable Resources, 14 Upper Woburn Pl, London WC1H 0NN, England1
 Benno I. Simmons合作论文数Ctr Ecol & Conservat, Univ Exeter1
 Mika Jalava合作论文数1
 Gibran Vita合作论文数Sustainable Resource Futures Grp SURF, Univ Kassel1
 Arie Staal合作论文数Aquatic Ecology and Water Quality Management Group, Wageningen University, Wageningen, The Netherlands1
 Arnout van Soesbergen合作论文数United Nations Environment Programme World Conservation Monitoring Centre (UNEP-WCMC), 219 Huntingdon Road, CB3 0DL, United Kingdom1




