Enhanced rock weathering (ERW) is a promising carbon dioxide removal (CDR) technology that involves spreading silicate rock powder in agricultural and silvicultural settings to trap CO2 by increasing soil alkalinity and promoting the formation of secondary carbonate minerals [1]. Many previous ERW trials have used newly mined rock for their amendments, resulting in embedded carbon emissions. To avoid these emissions, alkaline and environmentally safe mine residues could be used for ERW [2]. Here, we assess the carbon drawdown potential of two mine residues (kimberlite, serpentinite) and three newly mined agricultural amendments (basalt, metabasalt, wollastonite). We explore the use of geochemical analyses and remote sensing to monitor CO2 drawdown and the introduction of potentially hazardous transition metals into soil solids, plants, and water. Pea (Pisum sativum L.) plants were grown in acidic soil (pH = 4.9) amended with each rock type at four spreading rates (1, 5, 10, and 50 t/ha). This growth chamber trial ran for three months, with leachate samples collected throughout, and soil samples collected at completion. Over 3 months, the alkalinity of drainage waters from pots of all amendment types significantly (p < 0.05) increased compared to controls, while soil inorganic carbon increased significantly (p < 0.05) for four of five rock types (all but metabasalt). After 3 months, visible, near infrared (VNIR), and shortwave infrared (SWIR) scans of the soils showed increased abundances of carbonate minerals on the surfaces of soil colloids in the amended pots. Among the transition metals analyzed (e.g., Cd, Co, Cr, Ni) in drainage waters, plants, and soil solids, significant increases in concentration (p < 0.05) were only detected for nickel (10 mg/L) and only in leachates from soils amended with high amounts of serpentinite (50 t/ha), which remains below the Canadian regulatory standard (14 mg/L). Further, significant increases (p < 0.05) in nickel concentration were seen in the soil solids for both kimberlite- and serpentinite-amended pots, resulting in contamination (63 and 140 mg/kg respectively) significantly above (p < 0.05) the Canadian regulatory limit (37 mg/kg). Finally, a significant increase (p < 0.05) in nickel concentration was seen in the edible portion of the pea plants grown in soils amended with serpentinite, but the concentration remained significantly below (p < 0.05) the EU regulatory limit (10 mg/kg). The remaining drainage waters, plants and soil solids contained transition metal concentrations below regulatory limits. While this study demonstrates the potential for CDR through ERW using mine residues, it also highlights contamination risks that need to be weighed when determining deployment strategies, locations, and amendment rates if mine residues are to be used. [1] Paulo et al. (2021), Appl Geochem, 129, 104955.[2] Power et al. (2024), Environ Sci Technol, 58, 43-52.
Despite the increasing use of portable, low-cost spectrometers in estimating soil properties, there is lack of documentation regarding the factors contributing to the lower performance of these spectrometers when compared to conventional ones. This study investigates potential factors influencing performance of the Nanoquest, a low-cost spectrometer, in estimating soil organic carbon (SOC) and total nitrogen (TN). To conduct the study, five different models (cubist, partial least squares regression, support vector machines, random forest, and generalised boosted models) were tested for the estimation SOC and TN and a fivefold cross-validation analysis was conducted for model hyperparameter optimization. The Nanoquest achieved a Lin's concordance correlation coefficient (CCC) value of 0.84 and an R 2 value of 0.74 for SOC. For TN, CCC values of 0.86 and an R 2 value of 0.78 were obtained. To understand the impact of the spectral range and spectral resolution on SOC and TN estimation, the ASD spectra were digitally resampled to match the Nanoquest spectral range and resolution. This resampling resulted in a slight decrease in model performance for the spectral range and a more pronounced decrease for the spectral resolution.
Silica cycling in the world's oceans is not straightforward to evaluate on a geological time scale. With the rise of radiolarians and sponges from the early Cambrian onward, silica can have two depositional origins, continental weathering, and biogenic silica. It is critical to have a reliable method of differentiating amorphous silica and crystalline silica to truly understand biogeochemical and inorganic silica cycling. In this study, opal-A is mapped across the Western Canada Sedimentary Basin in the Late Devonian Duvernay Formation shales using longwave hyperspectral imaging alongside geochemical proxies that differentiate between crystalline and amorphous SiO2, during the expansion of the world's early forests. Signaled by several carbon isotope excursions in the Frasnian, the punctata Event corresponds to the expansion of forests when vascular land plants develop seeds and deeper root networks, likely resulting in increased pedogenesis. Nutrients from thicker soil horizons entering the marine realm are linked to higher levels of primary productivity in oceans and subsequent oxygen starvation in deeper waters at this time. The results of this study reveal, for the first time, the spatial distribution of amorphous SiO2 across a sedimentary basin during this major shift in the terrestrial realm when forests expand and develop deeper root networks.
Organic matter (OM) accumulation in organic matter-rich mudstones, or black shales, is generally recognized to be controlled by combinations of bioproductivity, preservation, and dilution. However, specific triggers of OM deposition in these formations are commonly difficult to identify with geochemical proxies, in part because of feedbacks that cause geochemical proxies for these controls to vary synchronously. This apparent synchronicity is partly a function of sample spacing, commonly at decimeter to meter intervals, which may represent longer periods of time than is required for the development of feedbacks. Higher resolution data sets may be required to fully interpret OM accumulation. This study applies a novel combination of technologies to develop a high-resolution geochemical data set, integrating energy-dispersive X-ray fluorescence (EDXRF) and infrared imagery analyses, to record proxies for redox conditions, bioproductivity, and clastic and carbonate dilution in millimeter-resolution profiles of 133 core slabs from the Middle and Upper Devonian Horn River shale in the Western Canada Sedimentary Basin, which provides decadal-scale temporal resolution. A comparison to a more coarsely sampled data set from the same core results in substantially different interpretations of variations in bioproductivity, redox, and dilution proxies. Stratigraphic distributions of organic matter accumulation patterns (bioproductivity-control, siliciclastic/carbonate-dilution, and redox conditions-control) show that organic enrichment events were highly varied during deposition of the shale and were closely related to second- and third-order sea-level changes. High-resolution profiles indicate that bioproductivity was the predominant trigger for organic matter accumulation in a second-order highstand, particularly during deposition of third-order transgressive systems tracts. Organic matter accumulation was largely controlled by dilution from either carbonate or clastic sediments in a second-order lowstand. Bioproductivity-redox feedbacks developed on timescales of decades to centuries.
With the emergence of longwave hyperspectral imaging systems, studies are revealing the potential of these data for discriminating tree species. However, few studies have applied statistical methods of band selection to select and characterize features at the species level that can then be used for improved classification. A dataset of leaf spectra was recently collected in-situ from twenty-six tree species in a Costa Rican tropical dry forest. The spectra of the species present overall low contrast and a range in spectral shapes, with some species displaying spectral similarity. This motivates our study to explore the performance of band selection tools to help identify key spectral features for the classification of these species. The bands selected using an ensemble of multiple methods improved the Logistic Regression classification performance by 3% in comparison to a result without band selection. The multiple methods encompassed the random forest, minimum redundancy maximum relevance and n-dimensional spectral solid angle methods. Bands selected by the ensemble methods agree well with the features previously identified based on expert knowledge and can be understood in the context of leaf constitutional compounds and related spectral features. The longwave hyperspectral bands or features identified in this study can potentially assist the future image mapping of tree species at large scales. The ensemble strategy is recommended for the band analysis of vegetation for its highest accuracy and stability.
Carbonate rocks undergo low-temperature, post-depositional changes, including mineral precipitation, dissolution, or recrystallisation (diagenesis). Unravelling the sequence of these events is time-consuming, expensive, and relies on destructive analytical techniques, yet such characterization is essential to understand their post-depositional history for mineral and energy exploitation and carbon storage. Conversely, hyperspectral imaging offers a rapid, non-destructive method to determine mineralogy, while also providing compositional and textural information. It is commonly employed to differentiate lithology, but it has never been used to discern complex diagenetic phases in a largely monomineralic succession. Using spatial-spectral endmember extraction, we explore the efficacy and limitations of hyperspectral imaging to elucidate multi-phase dolomitization and cementation in the Cathedral Formation (Western Canadian Sedimentary Basin). Spectral endmembers include limestone, two replacement dolomite phases, and three saddle dolomite phases. Endmember distributions were mapped using Spectral Angle Mapper, then sampled and analyzed to investigate the controls on their spectral signatures. The absorption-band position of each phase reveals changes in %Ca (molar Ca/(Ca + Mg)) and trace element substitution, whereas the spectral contrast correlates with texture. The ensuing mineral distribution maps provide meter-scale spatial information on the diagenetic history of the succession that can be used independently and to design a rigorous sampling protocol.
The Highland Valley Copper (HVC) district in British Columbia, Canada, is host to at least four major porphyry Cu systems: Bethlehem (~209 Ma), and Valley, Lornex, and Highmont (~208 to 207 Ma). High spatial resolution (0.2–1.0 mm/pixel) hyperspectral imagery in the shortwave infrared (SWIR) were acquired on 755 rock samples and 400 m of continuous drill core. Spectral metrics are used to measure the relative abundance of 12 minerals and an additional metric is derived to estimate white mica grain size. In the Valley and Lornex deposits, coarse-grained white mica is associated with mineralization and is detectable up to 4 km away from the deposits. Kaolinite is present within 2 km of the mineralized centers but does not necessarily occur within strongly mineralized intervals. Prehnite is ubiquitous from 4 to 8 km from the deposits. In the Bethlehem deposit, tourmaline and epidote are associated with mineralization. We propose a spectral alteration score based on these proximal hyperspectral SWIR mineralogical patterns to assist explorers in targeting porphyry Cu systems when using drill core, surface rock samples and potentially remote sensing imagery. In a production environment, this metric could serve to facilitate ore-sorting.
The optical properties of lichens have been traditionally explored in the context of geological mapping where the encrustation of lichens on rocks may influence the detection of minerals of interest.As of today, few studies have looked into the potential of using the optical properties of lichens to classify them; however, none has investigated the classification of tropical lichens using spectroscopy.Here we explore the use of the visible-near infrared reflectance (VNIR; 450-1000 nm) to discriminate Neotropical corticolous lichens; the most abundant lichens in tropical forests.Reflectance measurements on lichens and their bark substrate were performed on 282 lichens samples of 32 species attached to their host's bark.Using these measurements, we first explored the degree of spectral mixing of bark and lichens by linear unmixing each lichen spectrum with the corresponding average species spectrum and bark spectrum.Overall, the results reveal that the lichen signatures tend to mask the spectral contributions from bark; however, there are some specific groups of species with high bark mixing probably due to their nature and the similarities between the lichen and bark spectra.Next, we classified the lichen spectra based on growth forms and taxonomic ranks (i.e., family, genus, species) using five machine learning classifiers.This analysis was conducted on raw reflectance spectra and wavelet-transformed spectra to enhance the absorption features prior to classification.As expected, the classification of lichen spectra is less accurate at species-specific levels, rather than higher taxonomic ranks.The wavelet transformation was found to enhance the general performance of classification; however, the accuracy of the classification depends on the classifier.Of the classifiers used in this study, linear discrimination applied to reflectance spectra presents the highest performance at the species level.Our results reveal the potential of using the VNIR reflectance as a method to discriminate Neotropical lichens.The introduced methodology may be conducted in the field, thus allowing the monitoring of lichen communities in forests; thereby furthering the current understanding of the role of lichens in ecosystem functioning.
This is the second part of a study of predictive models of oil sand ore and froth characteristics using infrared hyperspectral data as a potential new means for process control. In Alberta, Canada, bitumen in shallow oil sands deposits is accessed by surface mining and then extracted from ore using flotation processes. The ore displays variability in the clay, bitumen, and fines content and this variability affects the separability and product quality in flotation units. Flotation experiments were performed on a set of ore samples of different types to generate froth and determine the ore processability (e.g., separation performance) and froth characteristics (bitumen and solids content, fines distribution). We show that point spectra and spectral imagery of good quality can be acquired rapidly (<1 s and <15 s, respectively) and these capture spectral features diagnostic of bitumen and solids. Ensuing models can predict the solids/bitumen (r2 = 0.88) and the %fines and ultrafines (particle passing at 3.9 and 0.5 µm) content of froth (r2 = 0.8 and 0.9, respectively). The latter model could be used to reject froth with a high solids content. Alternately, the strength of the illite-smectite absorption observed in froth could be used to retain all the samples above a pre-defined processability. Given that point spectrometers can currently be acquired for less than half the cost of an imaging system, we recommend the use of the former for future trials in operating environments.
The impact of band selection on endmember selection is seldom explored in the analysis of hyperspectral imagery. This study incorporates the N-dimensional Spectral Solid Angle (NSSA) band selection tool into the Spectral-Spatial Endmember Extraction (SSEE) tool to determine a band set that can be used to better define endmembers classes used in spectral mixture analysis. The incorporation aims to define a band set that improves the spectral contrast between endmembers at each step of the spatial-spectral endmember search and ultimately captures key features for discriminating spectrally similar materials. The proposed method (NSSA-SSEE) was evaluated for lithological mapping using a hyperspectral image encompassing a range of spectrally similar mafic and ultramafic rock units. The band selected by NSSA-SSEE showed a good agreement with known features of scene components identified by experts. Results showed an improvement in the selection of detailed endmembers, endmembers that are similar and that can be significant for mapping. The incorporation of NSSA into SSEE was feasible because both methods are well suited for this process. NSSA is one of the few methods of band selection that is suitable for the analysis of a small number of endmembers and SSEE provides such endmember sets via spatial subsetting. The automated NSSA-SSEE approach can reduce the need for field-based information to guide the feature selection process.
Hyperspectral imaging can be used to rapidly identify and map the spatial distributions of many minerals. Here, hyperspectral mapping in three wavelength regions (visible and near‐infrared, shortwave infrared, and thermal infrared) was applied to drill cores (ST001, ST002, and ST003) penetrating a continuous sequence of crater‐fill breccias from the Steen River impact structure in Alberta, Canada. The combined data sets reveal distinct mineralogical layering, with breccias derived predominantly from sedimentary rocks overlying those derived from granitic basement. This stratigraphy demonstrates that the breccias were not appreciably disturbed following deposition, which is inconsistent with formation models of similar breccias (suevites) by explosive impact melt–fluid interaction. At Steen River, volatiles from sedimentary target rocks were an inherent part of forming these enigmatic breccias. Approximately three quarters of terrestrial impact structures contain sedimentary target rocks; therefore, the role of volatiles in producing so‐called suevitic breccias may be more widespread than previously realized. The hyperspectral maps, specifically within the SWIR wavelength region, also delineate minerals associated with postimpact hydrothermal activity, including ammoniated clay and feldspar minerals not detectable using traditional techniques. These nitrogen‐bearing minerals may have originated from microbial processes, associated with oil‐ and gas‐producing units in the crater vicinity. Such minerals may have important implications for the production of habitable environments by impact‐induced hydrothermal activity on Earth and Mars.
This study is the first of two companion papers using hyperspectral data to generate predictive models of oil sand ore and froth characteristics as a potential new means for process control. In Alberta, Canada, shallow oil sands deposits are accessed by surface mining and crushed ore is transported to a processing plant for extraction of bitumen using flotation processes. The ore displays considerable variability in clay, bitumen, and fines which affects their behavior in flotation units. Using oil sand ore spanning a range of bitumen and fines characteristics, flotation experiments were performed to generate froth in a batch extractor to determine ore processability (e.g., separation performance) and froth characteristics (color, bitumen, solids). From hyperspectral observations of ore, models can predict the %bitumen content and %fines (particle passing at 44 and 3.9 µm) of ore but the models with highest r2 (>0.96) predict the solids/bitumen of froth and the processability of ore. Spectral observations collected on ore upstream of the separation vessels could therefore offer a first order assessment of froth quality for an ore blend before the ore enters the plant. These models could also potentially be used to monitor and control the performance of the blending process as another means to control the performance of the flotation process.
Selecting a subset of bands from hyperspectral data can improve the discrimination of ground targets because the most distinguishing spectral features are utilized. Targets with similar spectra are particularly challenging for band selection. A band selection method using the N-dimensional Solid Spectral Angle (NSSA) was recently proposed by Tian et al. (2016) to select the most dissimilar spectral regions amongst targets, but no case studies have been conducted using data from natural targets and there are currently no guidelines for the parameter selection in the NSSA band selection method. This study uses two spectral datasets of geologic relevance (clay minerals and ultramafic rocks), each with spectrally similar materials, to establish guidelines for the selection of two parameters (k and threshold) that will enable the use of the method for practical applications. K defines the band interval (relates to feature width) from which NSSA is calculated, and the threshold defines the number of bands selected from a profile of NSSA as a function of wavelength. The first guideline consists in constraining the maximum k value based on the spectral dimensionality of the widest significant spectral feature for the materials under study. The second guideline is to use a profile of the NSSA value as a function of wavelength for each permissible k value to capture the primary wavelength regions of high NSSA values. Finally, the threshold parameter for each k is estimated from a graph of the NSSA value as a function of the number of bands. The guidelines on the parameter definition allow non-expert users to select a subset of bands while capturing both narrow and broad discriminating features.Results show that bands selected from the two datasets are in good agreement with known spectral features. Of significance is that the bands encompass a range of distinguishing and often subtle spectral characteristics that include absorption feature position, and shape (asymmetry) and depth, the same that are recognized by experts, and thus can be used to assist experts in identifying key features. Moreover, the bands selected with NSSA show improved class separation as illustrated for datasets of spectrally similar materials. When tested for the discrimination of clay minerals, a competitive method named Variable Number Variable Band Selection (VNVBS) did not provide adequate information for the selection of bands. There are several valuable band selection methods reported in the literature, but few can be applied to datasets encompassing a relatively small number of spectra and to select bands that enable the discrimination of spectrally similar materials. As demonstrated in this study, the NSSA method should be of great value to studies that require feature identification from spectral libraries either resulting from the collection of field spectra or the extraction of endmembers from imagery.
Lygus Hahn (Hemiptera: Miridae) feeding in faba beans (Vicia faba Linnaeus (Fabaceae)) often results in a reduction in seed quality and economic losses. Traditionally, seed damage is assessed subjectively through visual examination by a trained individual, but the use of non-destructive imaging to evaluate seed quality is gaining momentum. The focus of this study was to determine the ability to quantify Lygus species damage in faba bean using shortwave-infrared imaging and two analysis techniques: (1) spectral angle mapper and (2) simple reflectance indices. Seed samples were visually assessed for damage before imaging in 242 wavebands between 980 and 2500 nm. Four spectral intervals, involving 102 wavebands, were identified as optimal for the detection of seed damage using spectral angle mapper. A strong relationship was obtained between the area of seed damage derived using spectral angle mapper and visually (R2 = 0.95). Seed damage derived by thresholding of two normalised faba bean damage indices involving reflectance at 1086 and 1313 nm and 2218 and 2342 nm also showed a strong relationship with the visual assessment (R2 = 0.92). The two image analysis techniques provided similar results. The study suggests that imaging in the shortwave-infrared wavelengths and the derivation of simple indices can effectively quantify faba bean damage by Lygus feeding.
In-line flocculation of oil sands tailings is a technique widely used in the oil sands industry to dewater fluid fine tailings. In this method, flocculants are added to the tailings to aggregate the fine particles and increase the settling rate and dewatering performance. Among the factors controlling the flocculation performance, the flocculant dose, rate and time of mixing play a crucial role. Consequently, the development of techniques that can monitor flocculation and provide feedback information to adjust flocculant dose and mixing conditions is of significant interest to the oil sands industry. This paper examines how hyperspectral imagery can be used to monitor tailings flocculation through post-depositional spectral measurements and image analysis. The results show that hyperspectral imagery can detect under-dosed and over-sheared samples, but experiments over a wider range of flocculation conditions are required to validate the results and calibrate the method. This study represents the initial step in the development of a spectral method for monitoring and assessment of the flocculation process.
Canadian Malartic is a large-tonnage, low-grade Archean gold deposit (16.3 Moz, 1.08 g/t Au) located in the Abitibi region of Quebec, Canada. A large part of the mineralization is hosted in the Pontiac Group metasedimentary rocks, which consist of mudstones to greywackes at upper greenschist to amphibolite facies. In exploration and production environments, these lithologies are challenging to characterize by conventional core logging methods, while in a research setting thin section-sized samples (2 cm x 4 cm) do not capture the full extent of mineralogical variability, which can extend from centimeters to meters away from mineralized zones. Here, high-resolution hyperspectral imagery (0.2-1.0 mm/pixel) in both shortwave infrared (SWIR, 1000-2500 nm) and longwave infrared (LWIR, 8000-12000 nm) is acquired for over two thousand meters of drill core, and is used to visualize changes in mineralogy and mineral chemistry related to metamorphism and hydrothermal alteration. Unaltered metasedimentary rocks contain metamorphic white mica with Al-VI contents varying between 1.90 and 1.75 apfu (2195 to 2203 nm), depending on metamorphic grade. Hydrothermal alteration is characterized by white mica which becomes progressively more phengitic with increasing alteration intensity, with Al(VI )contents ranging from 1.70 to 1.50 apfu (2204 to 2212 nm). Phengitic white mica extends from meters to tens of meters away from major mineralized zones, and can be used as a vector towards mineralization in an exploration setting. White mica composition is correlated to Au content, and can be used to discriminate between unmineralized (< 0.3 g/t Au, 2195-2204 nm), weakly mineralized (> 0.3 g/t Au, 2205-2208 nm), and highly mineralized (> 1.0 g/t Au, > 2208 nm) samples, which is a simple metric that can directly be applied to sort ore in a production environment. The Mg# (molar Mg/[Mg + Fe]) of biotite, on the other hand, is unaffected by metamorphic grade, and consistently is Mg# 55-60 (2251-2250 nm) in unaltered samples. In mineralized samples, biotite is Mg-rich (Mg# > 65, < 2249 nm), but rapidly grades into background compositions outside of the ore zones. LWIR hyperspectral data is used in drill core to estimate silicification abundance from the strength of the 9200 nm quartz reflectance peak. Peak strength was generally in good agreement with the silicification abundance estimated by core logging, and is therefore a metric that can directly be used for characterization of this parameter in exploration and production environments. Over 1500 SWIR point measurements were also acquired in a 50 km by 15 km area around the deposit, and were used to delineate metamorphic isograds on regional scales, and a large 12 km by 3 km hydrothermal alteration halo around the Canadian Malartic deposit. Similar measurements, if performed along the over 200 km long Cadillac-Larder Lake Deformation zone, could be used to rapidly delineate other potentially mineralized areas.
Conversion of arable cropland to forage crops has been proposed as a potential method to increase soil organic carbon (SOC) stocks to sequester carbon and improve soil quality. In this study, intact soil cores were collected from long-term boreal forest soil research plots established in 1980 consisting of: a mixed arable crop and forage agroecological rotation (AE), continuous forage (CF), and continuous grain (CG) rotations. These cores were analyzed using a SisuROCK automated hyperspectral imaging system in a laboratory setting collecting shortwave infrared reflectance data. Samples were then analyzed for SOC and total nitrogen (TN) contents by dry combustion to prepare a training data set. Predictive models were successfully built for SOC and TN using a combination of wavelet analysis and Bayesian Regularized Neural Nets. The CF rotation was found to have the highest SOC and TN contents compared to AE rotation for only the top 3 and 4 cm, respectively. These two rotations had comparable contents for both parameters for the rest of the topsoil, which was greater than the SOC and TN contents in the CG rotation to depths of approximately 12 cm. Increases in both SOC and TN were associated with increased spatial aggregation at fine spatial scales. These results indicate that adding forages to rotations in boreal forest soils increases SOC and TN, however these changes were concentrated in the surface depths.
The contiguous narrow bands in hyperspectral data can hamper the accurate discrimination of targets especially for spectrally similar materials. The N-dimensional Solid Spectral Angle (NSSA) is a novel method that selects important bands for the maximum spectral separation of materials. This paper proposed a strategy of hierarchical band selection based on the NSSA method to address inter-and intra-class variability among materials. Bands are separately selected from different hierarchies of categorized materials using NSSA and the individual band sets are then combined. To evaluate this Hierarchical Band Selection with NSSA (HBS-NSSA), two hyperspectral datasets were analyzed that include airborne image endmembers for geological mapping and leaf spectra for tree species discrimination. Selected bands agree well with known features identified from expert knowledge. The results suggest that the HBS-NSSA method is both practical and effective and could be easily adopted in any other fields of application with spectrally similar materials.
 G. Arturo Sanchez-Azofeifa合作论文数Dept Earth & Atmospher Sci, Univ Alberta61
 Jilu Feng合作论文数School of Pharmacy, Second Military Medical University46
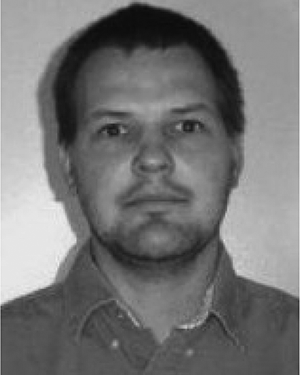 Derek M. Rogge合作论文数32
 M. G. Lipsett合作论文数12
 Kati Laakso合作论文数12
 Margaret Kalacska合作论文数Department of Geography, Faculty of Arts, McGill University9
 Julio Cesar Calvo-Alvarado合作论文数Escuela de Ingenieria Forestal;Instituto Tecnologico de Costa Rica;Escuela de Ingenieria Forestal, Instituto Tecnologico de Costa Rica9jc calvoalvarado合作论文数8
 Philip Lypaczewski合作论文数Dept Earth & Atmospher Sci, Univ Alberta7David Turner合作论文数7
 Juan Pablo Arroyo-Mora合作论文数7A. Gallie合作论文数6
 Jan Matthias Peter合作论文数Central Canada Division, Geological Survey of Canada6
 Michelle C. Tappert合作论文数Department of Earth and Atmospheric Sciences, University of Alberta6
 Ralf Tappert合作论文数Department of Earth and Atmospheric Sciences, University of Alberta6Michelle Speta合作论文数6
 Jinkai Zhang合作论文数6
 Mauricio Quesada合作论文数Universidad de Costa Rica;Centro de Investigaciones en Ecosistemas;noma de Mexico, Universidad Nacional Auto;Universidad de Costa Rica, Universidad Nacional Autonoma de Mexico6
 Robert L. Linnen合作论文数5
 Iman Entezari合作论文数5
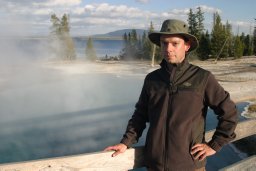 Stéphane Perrouty合作论文数Mineral Explorat Res Ctr, Laurentian Univ5Lee Groat合作论文数Department of Earth, Ocean and Atmospheric Sciences, Faculty of Science, The University of British Columbia5
 Raymond E. Arvidson合作论文数Department of Earth, Environmental, and Planetary Sciences, College of Arts & Sciences, Washington University in St. Louis;NASA5
 Martin J. Sharp (Martin Sharp)合作论文数Department of Earth and Atmospheric Sciences, Faculty of Science, University of Alberta5
 Murray K. Gingras合作论文数Earth and Atmospheric Sciences, University of Alberta5
 Nicolas Gaillard合作论文数4
 Yaqian Long (龙亚谦)合作论文数Visual Intelligence Research Center, College of Computer Science and Software Engineering, Shenzhen University4
 martin bachmann合作论文数German Aerosp Ctr DLR, German Remote Sensing Data Ctr DFD4
 Michael Deyholos合作论文数Department of Biology, Irving K. Barber Faculty of Science, The University of British Columbia4
 Tao Cheng (程涛)合作论文数College of Agriculture,National Engineering and Technology Center for Information Agriculture,Nanjing Agricultural University4Louise Corriveau合作论文数Department of Geological Sciences;University of Toronto4E.Ann Gallie合作论文数4paul budkewitsch合作论文数3J. Zhang合作论文数3
 Charles L. Bérubé合作论文数Dept Civil Geol & Min Engn, Polytech Montreal3
 J. Antonio Guzman Q.合作论文数Earth & Atmospher Sci Dept, Univ Alberta3
 Thierry Toutin合作论文数Canada Centre for Remote Sensing3
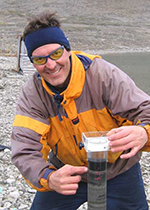 Alexander Wolfe合作论文数Department of Biological Sciences, University of Alberta3
 Daniel Janzen合作论文数Department of Biology, College of Arts & Sciences, University of Pennsylvania3
 S. Joseph Wright合作论文数Smithsonian Tropical Research Institute3Libo Wang合作论文数3
 V. Singhroy合作论文数Canada Centre for Remote Sensing3
 Anthony A. Faust合作论文数3
 Hilary Corlett合作论文数Department of Earth and Planetary Sciences, MacEwan University3
 Lyal B. Harris合作论文数Geology Department, University of Western Australia3Helen Francis合作论文数3
 Rolf D. Vinebrooke合作论文数Freshwater Biodiversity Laboratory;Department of Biological Sci - ences;University of Alberta;Freshwater Biodiversity Laboratory, University of Alberta3
 H.P. White合作论文数3
 Ed Cloutis合作论文数Department of Geography, The University of Winnipeg3




