The Gulf Stream convergence zone is a dipole of long-term averaged, near-surface wind divergence, positive over the cold and negative over the warm flanks of the Gulf Stream. We show that this climatological feature results from the boundary layer response to the varying large-scale winds of the storm track and the Gulf Stream sea surface temperatures. Using daily satellite observations of surface winds and sea surface temperature, we estimate the atmospheric boundary layer response of surface wind divergence as a convolution of ocean-mesoscale sea surface temperatures and a fitted impulse response function aligned with the direction and depending on the speed of the large-scale winds. Averaging daily reconstructions of the surface wind divergence in the northwest Atlantic recovers the notable features of the Gulf Stream convergence zone. In addition to the overall mean dipole, these include, west of 50 degrees W, its collocation with zonal bands of the sea surface temperature Laplacian, and the enhancement of the upwind and reduction of the downwind pole of the surface wind divergence dipole for averages conditioned on the meridional direction of large-scale winds. East of 50 degrees W, the largest averaged surface wind divergences are collocated with the maximum eastward gradient of the meridional sea surface temperature front. The distribution of daily large-scale winds in the storm track results in anisotropic, averaged impulse response functions. Convolutions with the varying geometry and orientation of the Gulf Stream sea surface temperature field explain the diversity of surface wind divergence features.
Several methods exist for estimating cross-scale kinetic energy (KE) transfers; however, most are ill-adapted for sparse ocean observations, hindering the study of oceanic KE transfers. A newly developed third-order structure function, D3(r), framework allows estimation of KE injections xi(j)(k) and spectral flux F(k) across scales using sparse data. This approach requires inverse methods to convert between separation r and wavenumber k space. A previous study employed the structure function framework to estimate F(k) and xi(j)(k) using nonnegative least squares (NNLS), assuming that the spectral flux is an increasing function of wavenumber, an assumption not always satisfied. Here, an improved methodology is presented to estimate F(k) and xi(j )using regularized least squares (RLS), where the inclusion of prior uncertainty in D3(r) and xi(j) reduces overfitting. Moreover, the improved methodology allows for estimating both positive and negative injections without making assumptions about the shape of the spectral flux. As a proof of concept, the improved methodology was implemented in an eddy-rich quasigeostrophic simulation output. RLS quantitatively diagnoses the structure of F(k), including both positive and negative xi(j)(k), an aspect unattainable with NNLS. The improved methodology was then applied to data from two drifter experiments in the Gulf of Mexico. The analysis reveals the presence of bidirectional energy transfers, with a KE inverse transfer at mesoscales in both seasons and a forward transfer at submesoscales that is stronger in winter than in summer. Unlike NNLS, RLS fits D3(r) better as the method detects wavenumbers where xi(j) <0 while preserving smoothness. This improved methodology allows for a more refined analysis of KE transfers from sparse observations.
The San Diego/Tijuana (US/Mexico) coastal region has immense water quality issues due to untreated wastewater sources. Regular ddPCR Enterococcus sampling provides same-day water quality information for beachgoers but does not provide forecasts for decision making. We describe the Pathogen Forecast Model (PFM) V1.0, providing daily 5 day forecasts of swimmer illness risk along 30 km of shoreline on a web dashboard. PFM is based upon a hydrodynamic model using forecasted waves, winds, offshore currents, and Tijuana River flow as inputs. PFM accurately forecasts tides and waves and forecasts depth-averaged shelf currents moderately well. Modeled untreated wastewater concentration tracer C evolves with a constant decay rate representing Norovirus. Over 13 km of shoreline, forecasted C and observed EnterococcusE are moderately log-correlated (≈0.5) for day-1 and -5 forecasts. The C and E power-law relationship has an exponent of ≈0.5, possibly suggesting the tracer decays 2× slower than Enterococcus DNA, among other potential explanations. Using the cutoff C = 10-5, PFM classified advisory exceedances with nearly 80% raw accuracy, high sensitivity, and lower specificity. This is the first forecast model that resolves estuarine, surfzone, and shelf regions. PFM is a useful public health tool and is constantly being improved.
Prior to the onset of the South Asian monsoon, the Arabian Sea experiences a warming phase during which the Arabian Sea mini warm pool (ASMWP) becomes one of the world's warmest oceanic regions, characterized by sea surface temperatures (SSTs) exceeding 30C. To understand the role of this warming in monsoon evolution, we performed an SST sensitivity experiment using the Weather Research and Forecasting (WRF) atmospheric model. Our case study focuses on the 2023 monsoon, which was characterized by high initial SST that declined faster than in normal years. We found that if the SST declines more slowly than normal, the off-shore precipitation increases by more than 100% around the ASMWP, but decreases in the northern Arabian Sea and the western coast of India. To understand the precipitation differences, we separated the components of the integrated vapor transport (IVT) and found that the changes in both water vapor and wind affect precipitation. The analysis revealed that the changes in water vapor are due to (a) stronger evaporation and precipitation in the ASMWP, and (b) moisture advection outside the ASMWP. It is also shown that the pressure adjustment mechanism can explain the changes in wind speed. With warmer SST conditions, the atmosphere pressure drops and causes wind convergence, thereby creating a weak cyclonic wind anomaly that redistributes the water vapor. Finally, we examined the vertically integrated buoyancy in the context of an idealized plume model. In the ASMWP, temperature changes contribute to increases in buoyancy below 850 hPa, but humidity changes contribute to far more increases in buoyancy between 800 and 600 hPa, which enhance the convection and lead to more precipitation.
Current–wind interaction modulates air–sea momentum and turbulent heat fluxes, which are critical in the energy cycle of tropical cyclones (TCs). However, the effects of the surface currents on air–sea exchange under TCs have remained unclear. Here, using an atmosphere–ocean coupled model, we investigate the role of current–wind interaction in determining TC intensity. Surface currents generally align with surface winds. Accounting for the current–wind interaction, the alignment reduces both the air–sea turbulent heat flux and momentum flux (average 1.0
Abstract Infragravity (IG) waves (periods nominally 25–250 s) are generated in shallow water by nonlinear difference‐frequency interactions between shorter period (nominally 4–25 s) incident sea‐swell waves. Previous studies show strong IG reflection from the beach face and detectable IG energy in alongshore‐propagating edge waves. Here, a linear wave model is developed to invert observed pressure (P) and velocity (cross‐shore and alongshore, U, V) cross‐spectra (including sensors separated in both the alongshore and cross‐shore directions) into cross‐shore standing and alongshore progressive linear shallow‐water modes. This inversion uses the Bayesian maximum a posteriori method (MAP). Infragravity edge waves on a moderately sloped ocean beach are characterized using 60 days of observations with low‐to‐moderate energy incident waves. Colocated P and UV sensors were deployed from the shoreline to 30 m depth, with an eight‐element PUV array in 7 m depth spanning 1.5 km alongshore. MAP estimates qualitatively agree with previous results obtained using the maximum likelihood estimator and smaller arrays. Edge waves average (28%, 14%, 43%) of the IG (P, U, V) variances in 7 m depth. Edge waves are most energetic at high tide when the shoreline slope is largest, possibly because the steep beach supports the multiple constructively interfering shoreline reflections required to form edge waves. The numerical wave model SWASH 1D assumes normally incident waves and neglects edge waves, but reproduces approximately the energy and cross‐shore structure of P and U.
An ocean acoustic tomography inversion with uncertainty quantification has been performed in the Santa Barbara Channel using relative arrival times obtained from the radiated noise of a ship of opportunity received by two 32-element vertical line arrays, at ranges from approximately 1.8 km at the closest point of approach to approximately 2.5 km at the maximum receiving range. The sound-speed estimate agrees [with a root mean square (rms) difference of 0.71 m/s] with an estimate performed about 40 min later [Gemba et al. (2022). J. Acoust. Soc. Am. 151(2) 861-880] using a controlled source and absolute travel times. The estimate using relative arrival times is less constrained (1.42 m/s rms uncertainty) than with absolute travel times (0.89 m/s rms uncertainty). The relative proximity of the ship noise source to the surface and the geometry at these short ranges result in a depth-varying interference between surface-reflected and direct arrivals. The interference effect on the estimated time delays is larger when computed with respect to a single element but minimal when estimated between adjacent elements. The relevant equations for relative travel time ocean acoustic tomography are presented.
The 2016–2017 Canada Basin Acoustic Propagation Experiment (CANAPE) was conducted to assess the effects of the changing Beaufort Gyre on low-frequency underwater acoustic propagation and ambient sound. A 150-km radius ocean acoustic tomography array was deployed with six transceivers and a distributed vertical line array (DVLA) measuring the impulse responses every 4 h with broadband signals centered from 172.5 to 275 Hz. The nominal transceiver source depth was 175-m, placing them near the Beaufort duct axis, and the 60 hydrophone DVLA spanned 50 to 600 m. The Beaufort Duct (BD; approximately 90 to 240-m depth) and the surface Duct (SD; approximately 0 to 90-m depth) form a coupled double-duct system. Previous work has described the statistics of the BD arrivals [J.Acoust. Soc. Am. 158, 38–50] so this analysis focuses on the SD. Because of lossy ice cover, the SD arrivals are only observed during open water and when the ice thickness does not exceed roughly 0.5 m. SD energy is detectable as an arrival coming in after the BD arrival but only on the shallowest hydrophones. The SD arrival is seen to be highly variable in both space and time. Mechanisms responsible for this variability will be evaluated.
During the 2023 and 2024 New England Sea Mounts Acoustics (NESMA) experiments, the Naval Postgraduate School deployed a network of near-bottom Moored Autonomous Noise Recorders (MANRs) near the Atlantis II Seamounts. MANRs recorded ambient sound continuously for 2 months in 2023 and 6 months in 2024. Sub-millisecond timing accuracy was maintained with on-board chip-scale atomic clocks. This paper investigates the retrieval of acoustic empirical Green’s functions (EGFs) from cross-correlations of ambient sound simultaneously recorded by MANR#2 and MANR#3 located on steep seamount flanks and MANR#4 located on an abyssal plain. MANRs were located 4 m above the seafloor at depths of 2994, 4067, and 4443 m, respectively. Stacking cross-correlation functions from approximately 100 h of noise recordings is found to produce EGFs with stable causal and acausal direct arrivals in the 15–50 Hz frequency band. We then track the temporal evolution of the reciprocal and non-reciprocal components of the passively measured acoustic travel time, which contain information about the evolution of sound speed and flow velocity along the propagation path. Acoustic observations of the environmental variability in deep water in the vicinity of Atlantis II Seamounts are compared to tide-resolving MITgcm hydrodynamic simulations. [Work supported by ONR.]
The Red Sea is increasingly impacted by underwater radiated noise (URN) from intense commercial shipping activity. This study evaluates the accuracy of a physics-based noise modeling framework in this environment by comparing modeled sound pressure levels (SPLs) with in situ acoustic measurements. Broadband (40-150 Hz) shipping and wind-driven noise was modeled using Automatic Identification System (AIS) data, the Hildebrand wind noise model, and parabolic equation-based acoustic propagation (RAM), with source levels parameterized for each vessel. Six autonomous acoustic recorders were deployed at two locations (King Abdullah Economic City and Al Fahal), covering both shallow and deep sites during two 12-day periods in summer and winter. Model predictions were compared against measured SPLs in both time and frequency domains. The results demonstrate strong seasonal and spatial variability in underwater noise levels, with modeled median SPLs closely matching observations at most sites. The analysis reveals that ship traffic is the dominant source of underwater noise, while other sources such as winds that were explicitly accounted in the simulations, showed a minimal contributions. Additionally, the findings suggest a seasonal influence on propagation conditions. Despite the inability to model certain biological or other non-shipping noise sources, the validation confirms that the model robustly captures dominant trends in low-frequency noise. The findings support the use of this modeling approach as a reliable basis for regional noise mapping and future marine spatial planning and mitigation efforts in the Red Sea.
For more than two decades, a network of acoustic sensors has been monitoring ambient sound across the Gulf of Mexico (GOM), a region with extensive seismic survey activity. These surveys, trackable through the Automatic Information System (AIS), produce low-frequency acoustic signals that offer a unique opportunity to study sound propagation over large distances. The signals are consistently detectable across the sensor network, covering ranges of up to ∼1000 km. Analysis reveals that transmission loss is strongly influenced by bathymetric features between survey locations and receivers. Specifically, downslope conversion and subsequent deepwater propagation reduce propagation loss, while upslope and along-slope propagation lead to greater propagation loss. This study highlights the potential for seismic surveys to be a valuable resource for advancing our understanding of acoustic propagation in marine environments.
Observations from a broadband acoustic experiment in deep water probe the temporal behavior of mid-frequency propagation through sound-speed fine structure advected by internal waves. The measured phases of two arrivals with similar propagation paths at 1.8 km range are sampled every 63.5 ms for 30 min. Simultaneous measurements of ocean fine structure near the propagation are used to model the changing arrival phase. The phase difference between arrivals is analyzed to understand changes in the underwater acoustic channel at the meter scale. A comparison between modeled and observed phase difference highlights an internal wave driven signal in the acoustic observations.
The Arctic Beaufort Sea has a unique double-duct sound-channel capped by seasonal ice cover. A roughly 90-m surface duct (SD) is formed by a river-driven halocline. Below the SD is the approximately 90-m to 250-m depth Beaufort Duct (BD) created by cold Pacific Winter Water sandwiched between warmer Pacific Summer Water and Atlantic Water. A yearlong record (2016-2017) of acoustic propagation measurements in this double-duct system was carried out using a 150-km radius, acoustic tomography array with broadband, 4-hourly transmissions at 175-m depth centered at 250 Hz. Double-duct signal analysis was carried out using a dense-vertical-receiving array spanning the BD. Observations reveal (1) consistent reverse geometric dispersion in the double-duct system with low modes faster than higher modes, (2) distinct first arrival and final cutoff times, and (3) normal dispersion for non-BD/SD modes causing the front to fold back upon itself after the final cutoff. A vertical-wave number spectrogram technique is used to decompose the pulses into an arrival time series for each wave number. Key observables are the first and final arrival travel times, dominant-vertical wave numbers, and signal intensities. Fluctuations are interpreted in terms of the varying stratification, ice cover, and implications for surface heat flux estimation.
Relative wind (RW; wind relative to surface currents) has been shown to playa crucial role in air-sea interactions, influencing both atmospheric and oceanic dynamics. While the RW effects through momentum flux are well-documented, those through turbulent heat fluxes remain unknown. In this study, we investigate two distinct surface current feedbacks - those associated with the momentum flux and turbulent heat fluxes - by modifying respective bulk formulations in the regional ocean-atmosphere coupled system, and analyze both immediate and seasonal changes in the boundary layers. Our results show that strong ocean currents in the Kuroshio Current and Extension significantly impact surface coupling, with responses generally contingent on the wind-current angle: an increase (decrease) in air-sea momentum and turbulent heat fluxes occurs when the low-level wind and surface currents are aligned (opposed). The instantaneous responses to surface currents include changes in low-level wind, surface current speed, and humidity, which are consistent with anticipated changes fora given wind-current angle based on the bulk formulations. While the wind-current angle is still an important factor, it does not adequately capture the seasonal responses. On the seasonal timescale, both surface current feedbacks can alter the path of the Kuroshio Extension and mesoscale activities, resulting in different background states that affect air-sea momentum and turbulent heat exchanges. Our results suggest that the energetic current system, such as the Kuroshio Current and Extension, can be significantly influenced by surface current coupling through both momentum and turbulent heat fluxes.
Travel-time measurements from an ocean acoustic tomography array deployed in the central Beaufort Gyre during 2016–2017 for the Canada Basin Acoustic Propagation Experiment (CANAPE) have been previously used to test the accuracy of the internationally accepted sound-speed equation (TEOS-10) [Vazquez et al. (2023), J. Acoust. Soc. Am. 154, 2676–2688] concluding that TEOS-10 gives sound speeds at high pressure (>1000 m) and low temperature (<0°C) that are too high by 0.14–0.16 m s−1. Here, a revised seawater sound-speed equation is developed that is consistent with the CANAPE travel times. First, a revised seawater sound speed equation is formulated using maximum a posteriori estimates based on laboratory data, defining the priors of the system in a reproducible manner. This equation is subsequently updated by fitting to the CANAPE travel times through iterative least-squares. CTD casts conducted in the Arctic are employed to assess the discrepancies between the revised sound-speed equation and other sound-speed equations. While including the deep acoustic transmissions corrects the portion below 1000 m depth, it also slightly corrects an additional anomaly between 100 and 300-m that corresponds to temperatures as low as −1.8°C.
The Arctic Ocean is evolving in response to climate change. In addition to the dramatic reduction in sea ice, the interior of the ocean is changing as the amount of warmer water that advects into the Arctic from the North Pacific and North Atlantic Oceans has increased. This paper applies linear inverse methods to the modal group delays of broadband 35-Hz transmissions across the Canada Basin during the Coordinated Arctic Acoustic Thermometry Experiment (CAATEX) in an effort to measure and understand the changes in the interior of the western Arctic. Modal dispersion along a ∼850-km transmission path leads to modal arrivals that can be separated in both time and space using data from 1200-m long vertical receiving arrays. The range-independent sound speed profile is estimated as a function of time over the year 2019–2020 from the measured modal group slowness. The inversion uses the Ice-Tethered Profiler (ITP) dataset to constrain the sound speed.
The Surface Water Ocean Topography (SWOT) satellite mission provides high-resolution two-dimensional sea surface height (SSH) data with swath coverage. However, spatially correlated errors affect these SSH measurements, particularly in the cross-track direction. The scales of errors can be similar to the scales of ocean features. Conventionally, instrumental errors and ocean signals have been solved for independently in two stages. Here, we have developed a one-stage procedure that solves for the correlated error at the same time that data are assimilated into a dynamical ocean model. This uses the ocean dynamics to distinguish ocean signals from observation errors. We test its performance relative to the two-stage method using simplified dynamics and a data set consisting of westward propagating Rossby waves, along with correlated instrumental errors of varying magnitudes. In a series of ensemble analyses, we found that the one-stage approach consistently outperforms the two-stage approach when estimating SSH signal and correlated errors. The one-stage approach can recover over 95% of the SSH signal, while skill for the two-stage approach drops significantly as error increases. Our findings suggest that solving for the correlated errors within the assimilation framework can provide an effective analysis approach, reducing the risks of confounding signal and instrument noise.
A hybrid ensemble data assimilation (DA) system is implemented for a coupled physical-biogeochemical ecosystem model of the Red Sea using MITgcm and NBLING at 4 km resolution, marking the first application of its kind in the region. The methodology combines a temporally varying ensemble from the Ensemble Adjustment Kalman Filter with a quasi-static monthly ensemble, implemented through the DA Research Testbed. Physical (satellite sea surface temperature, altimetry, in situ temperature and salinity) and biogeochemical (satellite chlorophyll) observations are assimilated, accounting for uncertainties in atmospheric forcing. Two configurations are evaluated: weakly coupled DA (weakly coupled data assimilation [WCDA]), which updates physical and biogeochemical states independently, and strongly coupled DA (strongly coupled data assimilation [SCDA]), which updates both using all observations. Sensitivity experiments assess the influence of assimilated observations on biogeochemical states, validated against independent temperature, salinity, sea surface height, chlorophyll, and oxygen data. Results demonstrate the benefits of joint assimilation in the Red Sea but also highlight challenges with SCDA. While SCDA improves the biogeochemical state relative to the free run, WCDA yields more robust physical estimates and better chlorophyll forecasts, particularly in subsurface layers. Physical assimilation through WCDA enhances biogeochemical fields throughout the water column, often exceeding 0.2 mg m-3 and the ensemble spread. Surface chlorophyll assimilation further improves WCDA surface predictions, though subsurface impacts are mixed. These findings emphasize both the value of WCDA and the need for further development to fully realize SCDA's potential for coupled physical-biogeochemical DA.
This study evaluates the feasibility of applying the Estimating the Circulation and Climate of the Ocean General Circulation Model (MITgcm), at 1-km grid resolution]. This is in preparation for future studies to understand and assimilate the novel swath measurements of sea surface height from the Surface Water and Ocean Topography (SWOT) satellite mission. The model domain is centered at the SWOT calibration/validation (CalVal) site, located 300 km offshore of Monterey Bay, California. We assimilate vertical profiles of temperature and salinity from a linear array of three SWOT prelaunch CalVal moorings, between September and December 2019. Two model solutions are analyzed: 1) a nonassimilating forward simulation termed "first-guess" and 2) an optimized solution that assimilates the in situ observations. Both runs are nested within the global 1/128 Hybrid Coordinate Ocean Model that uses Navy Coupled Ocean Data Assimilation (HYCOM/NCODA) analysis. We evaluate the performance by comparing the two model solutions against assimilated and withheld in situ observations. We show that by assimilating hydrographic data, the model performance over the first-guess solution is improved with an error-to-observation reduction of 30%-45% for temperature, 14%-41% for salinity, and 44%-56% for steric height. Over the study period, the average steric height error at the three assimilated moorings was 1.27 cm for the optimized solution versus 2.6 cm for the first-guess solution. A comparison to withheld glider observations shows that the optimized solution outperforms the first-guess solution with an error-to-observation reduction of approximately 38% in steric height (1.5 versus 2.4 cm). This study indicates, for the first time, that the MITgcm-ECCO framework can be successfully applied to the reconstruction of submesoscale ocean variability, via the nesting of a high-resolution regional domain into a global outer domain.
Over nine years of hourly surface current data from high-frequency radar (HFR) off the US West Coast are analyzed using a Bayesian least-squares fit for tidal components. The spatial resolution and geographic extent of HFR data allow us to assess the spatial structure of the non-phase-locked component of the tide. In the frequency domain, the record length and sampling rate allow resolution of discrete tidal lines corresponding to well-known constituents and the near-tidal broadband elevated continuum resulting from amplitude and phase modulation of the tides, known as cusps. The FES2014 tide model is used to remove the barotropic component of tidal surface currents in order to evaluate its contribution to the phase-locked variance and spatial structure. The mean time scale of modulation is 243 days for the M$_2$ constituent and 181 days for S$_2$, with overlap in their range of values. These constituents’ modulated amplitudes are significantly correlated in several regions, suggesting shared forcing mechanisms. Within the frequency band M$_2$ $\pm$ 5 cycles per year, an average of 48\% of energy is not at the phase-locked frequency. When we remove the barotropic model, this increases to 64\%. In both cases there is substantial regional variability. This indicates that a large fraction of tidal energy is not easily predicted (e.g. for satellite altimeter applications). The spatial autocorrelation of the non-phase-locked variance fraction drops to zero by 150 km, comparable to the width of the swath of the recently launched Surface Water and Ocean Topography (SWOT) altimeter.
 Peter F. Worcester合作论文数Scripps Institution of Oceanography, UC San Diego100
 Matthew R. Mazloff合作论文数Scripps Institution of Oceanography, University of California76
 Matthew Dzieciuch合作论文数Scripps Institution of Oceanography, University of California, San Diego65
 Ganesh Gopalakrishnan合作论文数42
 Brian Dushaw合作论文数Applied Physics Laboratory, University of Washington39
 Sarah T. Gille合作论文数Scripps Institution of Oceanography, University of California San Diego39
 Ibrahim Hoteit合作论文数Physical Science and Engineering Division, King Abdullah University of Science and Technology;National Climate Change Center of Excellence, King Abdullah University of Science and Technology39
 Robert C. Spindel合作论文数University of Washington36
 Art Miller合作论文数Scripps Institution of Oceanography, University of California, San Diego34
 Bill Hodgkiss合作论文数Scripps Institution of Oceanography, University of California, San Diego33
 Aneesh Subramanian合作论文数32
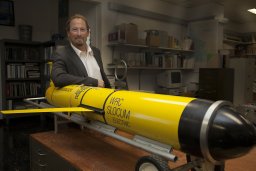 John A. Colosi合作论文数Dept Oceanog, Naval Postgrad Sch31B. M. Howe合作论文数26
 Walter H. Munk合作论文数Scripps Institution of Oceanography,University of California,San Diego26
 Eric Terrill合作论文数Marine Physical Laboratory;Scripps Institution of Oceanography;University of California , San Diego;Scripps Institution of Oceanography, University of California , San Diego21
 Bruce M. Howe合作论文数Department of Ocean and Resources Engineering, School of Ocean and Earth Science and Technology, University of Hawai‘i at Mānoa21
 Sarkar Jit合作论文数Scripps Institution of Oceanography, University of California19John a Mercer合作论文数19Rui Sun合作论文数18
 William A. Kuperman合作论文数Marine Physical Laboratory, Scripps Institution of Oceanography, University of California, San Diego18
 Daniel Rudnick合作论文数Scripps Institution of Oceanography, University of California, San Diego18
 Detlef Stammer合作论文数Institut fur Meereskunde, Universitat Hamburg18Emmanuel K. Skarsoulis合作论文数17W. A. Kuperman合作论文数Scripps Institution of Oceanography, University of California, San Diego17
 Emanuele Di Lorenzo合作论文数Department of Earth, Environmental and Planetary Sciences, Brown University;School of Earth and Atmospheric Sciences, College of Sciences, Georgia Institute of Technology16
 Sung Yong Kim合作论文数Department of Mechanical Engineering, College of Engineering, Korea Advanced Institute of Science and Technology15
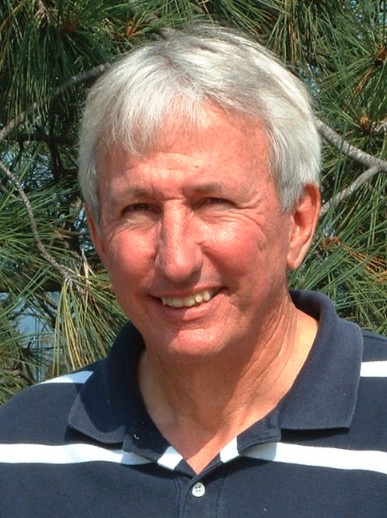 Dean Roemmich合作论文数Integrative Oceanography Division, Scripps Institution of Oceanography, University of California, San Diego;Climate, Atmospheric Science, and Physical Oceanography Division, Scripps Institution of Oceanography, University of California, San Diego14
 James A. Mercer合作论文数14Ariane Verdy合作论文数14
 Patrick Heimbach合作论文数Department of Geological Sciences, Jackson School of Geosciences, University of Texas at Austin13K. Metzger合作论文数12
 John Hildebrand合作论文数Scripps Institution of Oceanography, University of California San Diego12
 Kay L Gemba合作论文数Department of Physics and Astronomy;California State Univ;Department of Physics and Astronomy, California State Univ ersity11
 Armin Köhl合作论文数Institute of Oceanography, Universität Hamburg;Institut für Meereskunde, University of Hamburg10
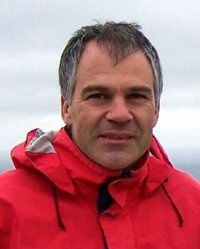 Dimitris Menemenlis合作论文数Jet Propulsion Laboratory, California Institute of Technology10
 Philippe Roux合作论文数Institut des Sciences de la Terre, University Grenoble Alpes10
 Hernan G. Arango合作论文数Institute of Marine and Coastal Sciences, Rutgers University10
 Tim Duda合作论文数Applied Ocean Physics and Engineering Department, Woods Hole Oceanographic Institution10
 Julie Mcclean合作论文数Scripps Institution of Oceanography, University of California, San Diego9
 Heriberto Jesus Vazquez Peralta合作论文数Scripps Inst Oceanog, Univ Calif San Diego9
 Fred Martin Ralph合作论文数Center for Western Weather and Water Extremes, Scripps Institution of Oceanography, University of California9Ana B. Villas Bôas合作论文数8Andrew M. Moore合作论文数Department of Ocean Sciences, University of California Santa Cruz, 1156 High Street, Santa Cruz CA 95062, USA8
 Hajoon Song合作论文数7
 Carl Wunsch合作论文数Department of Earth and Planetary Sciences, Harvard University;Department of Earth, Atmospheric and Planetary Sciences, Massachusetts Institute of Technology7
 Karim Sabra合作论文数George W. Woodruff School of Mechanical Engineering, Georgia Institute of Technology7
 Arthur Baggeroer合作论文数Department of Mechanical Engineering and Electrical Engineering, Massachusetts Institute of Technology;Department of Computer Science, Massachusetts Institute of Technology7T. F. Duda合作论文数6
 Nidia Martinez Avellaneda合作论文数6




