A modest operational program of systematic aircraft measurements can resolve key satellite-aerosol-data-record limitations. Satellite observations provide frequent, global aerosol-amount maps, but offer only loose aerosol property constraints needed for climate and air quality applications. We define and illustrate the feasibility of flying an aircraft payload to measure key aerosol optical, microphysical, and chemical properties in situ. The flight program could characterize major aerosol air-mass types statistically, at a level-of-detail unobtainable from space. It would: (1) enhance satellite aerosol retrieval products with better climatology assumptions, and (2) improve translation between satellite-retrieved optical properties and species-specific aerosol mass and size simulated in climate models to assess aerosol forcing, its anthropogenic components, and other environmental impacts. As such, Systematic Aircraft Measurements to Characterize Aerosol Air Masses (SAM-CAAM) could add value to data records representing several decades of aerosol observations from space, improve aerosol constraints on climate modeling, help interrelate remote-sensing, in situ, and modeling aerosol-type definitions, and contribute to future satellite aerosol missions. Fifteen Required Variables are identified, and four Payload Options of increasing ambition are defined, to constrain these quantities. "Option C" could meet all the SAM-CAAM objectives with about 20 instruments, most of which have flown before, but never routinely several times per week, and never as a group. Aircraft integration, and approaches to data handling, payload support, and logistical considerations for a long-term, operational mission are discussed. SAM-CAAM is feasible because, for most aerosol sources and specified seasons, particle properties tend to be repeatable, even if aerosol loading varies.
We examine the relationship between the number concentration of boundary-layer cloud condensation nuclei (CCN) and light extinction to investigate underlying aerosol processes and satellite-based CCN estimates. For a variety of airborne and ground-based observations not dominated by dust, regression identifies the CCN (cm−3) at 0.4 ± 0.1% supersaturation with 100.3α +1.3σ0.75 where σ (Mm−1) is the 500 nm extinction coefficient by dried particles and α is the Angstrom exponent. The deviation of 1 km horizontal average data from this approximation is typically within a factor of 2.0. ∂logCCN / ∂logσ is less than unity because, among other explanations, growth processes generally make aerosols scatter more light without increasing their number. This, barring special meteorology–aerosol connections, associates a doubling of aerosol optical depth with less than a doubling of CCN, contrary to previous studies based on heavily averaged measurements or a satellite algorithm.
Abstract. During the Arctic Research of the Composition of the Troposphere from Aircraft and Satellites (ARCTAS) campaign, two NASA research aircraft, a DC-8 and a P-3B, were outfitted with extensive trace gas (the DC-8) and aerosol (both aircraft) instrumentation. Each aircraft spent about a half hour sampling air around the oil sands mining and upgrading facilities near Ft. McMurray, Alberta, Canada. The DC-8 circled the area, while the P-3B flew directly over the upgrading plants, sampling close to the exhaust stacks, then headed downwind to monitor the aerosol as it aged. At short range, the plume from the oil sands is a complex mosaic of freshly nucleated ultrafine particles from a SO2- and NO2-rich plume, soot and possibly fly ash from industrial processes, and dust from dirt roads and mining operations. Shortly downwind, organic aerosol appears in quantities that rival SO4, either as volatile organic vapors condense or as they react with the H2SO4. The DC-8 pattern allowed us to integrate total flux from the oil sands facilities within about a factor of 2 uncertainty that spanned values consistent with 2008 estimates from reported SO2 and NO2 emissions, though there is no reason to expect one flyby to represent average conditions. In contrast, CO fluxes exceeded reported regional emissions, due either to variability in production or sources missing from the emissions inventory. The conversion rate of SO2 to aerosol SO4 of ~6% per hour is consistent with earlier reports, though OH concentrations are insufficient to accomplish this. Other oxidation pathways must be active. Altogether, organic aerosol and black carbon emissions from the oil sands operations are small compared with annual forest fire emissions in Canada. The oil sands do contribute significant sulfate and exceed fire production of SO2 by an order of magnitude.
Accurate measurements of natural aerosol emissions over the ocean are needed to estimate the anthropogenic impact on the environment. In this study, we measured sea spray aerosol (SSA) concentrations with diameters larger than 0.040 μm produced by open-ocean breaking waves over the SEP (southeastern Pacific). Robust statistics were established through repeated airborne flights over 1000 km along 20° S from the coastline of Chile to 85° W during VOCALS-REx (VAMOS Ocean-Cloud-Atmosphere-Land-Study Regional Experiment). Non-volatile SSA number concentrations were inferred using a thermally resolved technique constrained for clean conditions with an Ångström exponent below 0.5, black carbon mass concentration at values lower than 15 ng m−3 and organic aerosol concentration less than 0.02 μg m−3. We found that number concentrations of SSAs active as cloud condensation nuclei (CCN) for a supersaturation of 0.25% varied between 17 and 36 cm−3, but these did not increase with the increasing mean wind speed typically observed further offshore along 20° S. Concurrent increases in mean offshore precipitation rate in excess of about 1 mm d−1 indicate that scavenging of SSAs by precipitation exceeds increases in production at wind speeds above about 8 m s−1. This demonstrates the critical role of precipitation as a major sink of SSA over the remote ocean. Finally, we found that under clean conditions and for estimated stratus supersaturations between 0.20 and 0.43%, SSA represented about 20% of the total potential CCN along 20° S.
Submicron aerosol physical and chemical properties in remote marine air were measured from aircraft over the Southeast Pacific during VOCALS-REx in 2008 and the North Pacific during IMPEX in 2006, and aboard a ship in the Equatorial Pacific in 2009. A High Resolution – Particle Time of Flight Aerosol Mass Spectrometer (HR-ToF-AMS) measured non-refractory submicron aerosol composition during all campaigns. Sulfate (SO4) and organics (Org), during VOCALS and the cruise show lower absolute values than those reported for previous "clean air" studies. In the marine boundary layer, average concentrations for SO4 were 0.52 μg m−3 for the VOCALS region and 0.85 μg m−3 for the equatorial region while average Org concentrations were 0.10 and 0.07 μg m−3, respectively. Campaign average Org/SO4 ratios were 0.19 (VOCALS) and 0.08 (equatorial Pacific). Black carbon (BC) measurements from a single particle soot photometer (SP2) and carbon monoxide (CO) concentrations over the Southeast Pacific provided sensitive indicators of pollution. CO and BC were used to identify the least polluted air, which had average concentrations of SO4 and Org of 0.14 and 0.01 μg m−3, respectively, with an average Org/SO4 of 0.08. Data from IMPEX was constrained to similar clean air criterion, and resulted in an average Org/SO4 ratio of 0.19. Under the cleanest MBL conditions during VOCALS, identified by CO below 61 ppbv, a robust linear relationship between Org and BC concentrations revealed that even at very low pollution levels, combustion sources dominated organic aerosol, suggesting little to no marine source of submicrometer Org to the atmosphere over the eastern South Pacific. This means marine organics cannot be identified by merely setting a standard for background conditions below which anthropogenic influence can be disregarded. Other methods must be used to exclude non-marine sources.
Topography-induced steady-state accelerated wind flow in the Alenuihaha Channel between the islands of Hawaii and Maui provides about 100 km of fetch with winds that can nearly double over trade wind speed. Here ship- and aircraft-based observations of meteorological parameters and aerosols in Hawaii's orographic natural "wind tunnel'' are used for the study of sea salt aerosol (SSA) production, evolution, and related optical effects under clean oceanic conditions. There are certain advantages of channel measurements, such as a broad and uniform upstream area usually filled with background aerosol, stationary flow, and known fetch, but also some difficulties, like vigorous entrainment and persistent presence of organized structures (rolls). It is found that marine boundary layer (MBL) rolls are a common occurrence near the Hawaiian Islands even when cloud streets are not visible in satellite imagery. The presence of rolls tends to enhance the variability of ambient aerosol concentration and probably affects production of primary sea salt aerosol and entrainment from above. The possibility of channel measurements of the size-dependent flux of SSA is explored using a concentration buildup method as surface wind speeds range from 7 to 11 m s(-1). Production of SSA particles with dry diameter as small as 0.18 mu m was observed. General agreement with reported SSA fluxes was found.
Dimethylsulfide (DMS) emitted from the ocean is a biogenic precursor gas for sulfur dioxide (SO2) and non-sea-salt sulfate aerosols (SO42−). During the VAMOS-Ocean-Cloud-Atmosphere-Land Study Regional Experiment (VOCALS-REx) in 2008, multiple instrumented platforms were deployed in the Southeastern Pacific (SEP) off the coast of Chile and Peru to study the linkage between aerosols and stratocumulus clouds. We present here observations from the NOAA Ship Ronald H. Brown and the NSF/NCAR C-130 aircraft along ~20° S from the coast (70° W) to a remote marine atmosphere (85° W). While SO42− and SO2 concentrations were distinctly elevated above background levels in the coastal marine boundary layer (MBL) due to anthropogenic influence (~800 and 80 pptv, respectively), their concentrations rapidly decreased west of 78° W (~100 and 25 pptv). In the remote region, entrainment from the free troposphere (FT) increased MBL SO2 burden at a rate of 0.05 ± 0.02 μmoles m−2 day−1 and diluted MBL SO42 burden at a rate of 0.5 ± 0.3 μmoles m−2 day−1, while the sea-to-air DMS flux (3.8 ± 0.4 μmoles m−2 day−1) remained the predominant source of sulfur mass to the MBL. In-cloud oxidation was found to be the most important mechanism for SO2 removal and in situ SO42− production. Surface SO42− concentration in the remote MBL displayed pronounced diel variability, increasing rapidly in the first few hours after sunset and decaying for the rest of the day. We theorize that the increase in SO42− was due to nighttime recoupling of the MBL that mixed down cloud-processed air, while decoupling and sporadic precipitation scavenging were responsible for the daytime decline in SO42−.
In the spring of 2008 NASA and NOAA funded the ARCTAS and ARCPAC field campaigns as contributions to POLARCAT, a core IPY activity. During the campaigns the NASA DC-8, P-3B and NOAA WP-3D aircraft conducted over 160 h of in-situ sampling between 0.1 and 12 km throughout the Western Arctic north of 55° N (i.e. Alaska to Greenland). All aircraft were equipped with multiple wavelength measurements of aerosol optics, trace gas and aerosol chemistry measurements, as well as direct measurements of the aerosol size distributions and black carbon mass. Late April of 2008 proved to be exceptional in terms of Asian biomass burning emissions transported to the Western Arctic. Though these smoke plumes account for only 11–14 % of the samples within the Western Arctic domain, they account for 42–47 % of the total burden of black carbon. Dust was also commonly observed but only contributes to 4–12 % and 3–8 % of total light absorption at 470 and 530 nm wavelengths above 6 km. Below 6 km, light absorption by carbonaceous aerosol derived from urban/industrial and biomass burning emissions account for 97–99 % of total light absorption by aerosol. Stratifying the data to reduce the influence of dust allows us to determine mass absorption efficiencies for black carbon of 11.2±0.8, 9.5±0.6 and 7.4±0.7 m2 g−1 at 470, 530 and 660 nm wavelengths. These estimates are consistent with 35–80 % enhancements in 530 nm absorption due to clear or slightly absorbing coatings of pure black carbon particulate. Assuming a 1/λ wavelength dependence for BC absorption, and assuming that refractory aerosol (420 °C, τ = 0.1 s) in low-dust samples is dominated by brown carbon, we derive mass absorption efficiencies for brown carbon of 0.83±0.15 and 0.27±0.08 m2 g−1 at 470 and 530 nm wavelengths. Estimates for the mass absorption efficiencies of Asian dust are 0.034 m2 g−1 and 0.017 m2 g−1. However the absorption efficiency estimates for dust are highly uncertain due to the limitations imposed by PSAP instrument noise. In-situ ARCTAS/ARCPAC measurements during the IPY provide valuable constraints for absorbing aerosol over the Western Arctic, species which are currently poorly simulated over a region that is critically under-sampled.
We describe aerosol optical depth (AOD) measured during the Arctic Research of the Composition of the Troposphere from Aircraft and Satellites (ARCTAS) experiment, focusing on vertical profiles, inter-comparison with correlative observations and fine-mode fraction. Arctic haze observed in <2 km and 2–4 km over Alaska in April 2008 originated mainly from anthropogenic emission and biomass burning, respectively, according to aerosol mass spectrometry and black carbon incandescence measurements. The Ångström exponent for these air masses is 1.4 ± 0.3 and 1.7 ± 0.1, respectively, when derived at 499 nm from a second-order polynomial fit to the AOD spectra measured with the 14-channel Ames Airborne Tracking Sunphotometer (AATS-14) over 354–2139 nm. We examine 55 vertical profiles selected from all phases of the experiment. For two thirds of them, the AOD spectra are within 3% + 0.02 of the vertical integral of local visible-light scattering and absorption. The horizontal structure of smoke plumes from local biomass burning observed in central Canada in June and July 2008 explains most outliers. The differences in mid-visible Ångström exponent are <0.10 for 63% of the profiles with 499-nm AOD > 0.1. The retrieved fine-mode fraction of AOD is mostly between 0.7 and 1.0, and its root mean square difference (in both directions) from column-integral submicron fraction (measured with nephelometers, absorption photometers and an impactor) is 0.12. These AOD measurements from the NASA P-3 aircraft, after compensation for below-aircraft light attenuation by vertical extrapolation, mostly fall within ±0.02 of AERONET ground-based measurements between 340–1640 nm for five overpass events.
The VAMOS Ocean-Cloud-Atmosphere-Land Regional Experiment (VOCALS-REx) was conducted from 15 October to 15 November 2008 in the South East Pacific (SEP) region to investigate interactions between land, sea and atmosphere in this unique tropical eastern ocean environment and to improve the skill of global and regional models in representing the region. This study synthesises selected aircraft, ship and surface site observations from VOCALS-REx to statistically summarise and characterise the atmospheric composition and variability of the Marine Boundary Layer (MBL) and Free Troposphere (FT) along the 20° S parallel between 70° W and 85° W. Significant zonal gradients in mean MBL sub-micron aerosol particle size and composition, carbon monoxide, sulphur dioxide and ozone were seen over the campaign, with a generally more variable and polluted coastal environment and a less variable, more pristine remote maritime regime. Gradients in aerosol and trace gas concentrations were observed to be associated with strong gradients in cloud droplet number. The FT was often more polluted in terms of trace gases than the MBL in the mean; however increased variability in the FT composition suggests an episodic nature to elevated concentrations. This is consistent with a complex vertical interleaving of airmasses with diverse sources and hence pollutant concentrations as seen by generalised back trajectory analysis, which suggests contributions from both local and long-range sources. Furthermore, back trajectory analysis demonstrates that the observed zonal gradients both in the boundary layer and the free troposphere are characteristic of marked changes in airmass history with distance offshore – coastal boundary layer airmasses having been in recent contact with the local land surface and remote maritime airmasses having resided over ocean for in excess of ten days. Boundary layer composition to the east of 75° W was observed to be dominated by coastal emissions from sources to the west of the Andes, with evidence for diurnal pumping of the Andean boundary layer above the height of the marine capping inversion. Analysis of intra-campaign variability in atmospheric composition was not found to be significantly correlated with observed low-frequency variability in the large scale flow pattern; campaign-average interquartile ranges of CO, SO2 and O3 concentrations at all longitudes were observed to dominate over much smaller differences in median concentrations calculated between periods of different flow regimes. The campaign climatology presented here aims to provide a valuable dataset to inform model simulation and future process studies, particularly in the context of aerosol-cloud interaction and further evaluation of dynamical processes in the SEP region for conditions analogous to those during VOCALS-REx. To this end, our results are discussed in terms of coastal, transitional and remote spatial regimes in the MBL and FT and a gridded dataset are provided as a resource.
Absorbing aerosols play an important, but uncertain, role in the global climate. Much of this uncertainty is due to a lack of adequate aerosol measurements. While great strides have been made in observational capability in the previous years and decades, it has become increasingly apparent that this development must continue. Scanning polarimeters have been designed to help resolve this issue by making accurate, multi-spectral, multi-angle polarized observations. This work involves the use of the Research Scanning Polarimeter (RSP). The RSP was designed as the airborne prototype for the Aerosol Polarimetery Sensor (APS), which was due to be launched as part of the (ultimately failed) NASA Glory mission. Field observations with the RSP, however, have established that simultaneous retrievals of aerosol absorption and vertical distribution over bright land surfaces are quite uncertain. We test a merger of RSP and High Spectral Resolution Lidar (HSRL) data with observations of boreal forest fire smoke, collected during the Arctic Research of the Composition of the Troposphere from Aircraft and Satellites (ARCTAS). During ARCTAS, the RSP and HSRL instruments were mounted on the same aircraft, and validation data were provided by instruments on an aircraft flying a coordinated flight pattern. We found that the lidar data did indeed improve aerosol retrievals using an optimal estimation method, although not primarily because of the contraints imposed on the aerosol vertical distribution. The more useful piece of information from the HSRL was the total column aerosol optical depth, which was used to select the initial value (optimization starting point) of the aerosol number concentration. When ground based sun photometer network climatologies of number concentration were used as an initial value, we found that roughly half of the retrievals had unrealistic sizes and imaginary indices, even though the retrieved spectral optical depths agreed within uncertainties to independent observations. The convergence to an unrealistic local minimum by the optimal estimator is related to the relatively low sensitivity to particles smaller than 0.1 (μm) at large optical thicknesses. Thus, optimization algorithms used for operational aerosol retrievals of the fine mode size distribution, when the total optical depth is large, will require initial values generated from table look-ups that exclude unrealistic size/complex index mixtures. External constraints from lidar on initial values used in the optimal estimation methods will also be valuable in reducing the likelihood of obtaining spurious retrievals.
We use an ensemble of satellite (MODIS), aircraft, and ground‐based aerosol observations during the ICARTT field campaign over eastern North America in summer 2004 to (1) examine the consistency between different aerosol measurements, (2) evaluate a new retrieval of aerosol optical depths (AODs) and inferred surface aerosol concentrations (PM 2.5 ) from the MODIS satellite instrument, and (3) apply this collective information to improve our understanding of aerosol sources. The GEOS‐Chem global chemical transport model (CTM) provides a transfer platform between the different data sets, allowing us to evaluate the consistency between different aerosol parameters observed at different times and locations. We use an improved MODIS AOD retrieval based on locally derived visible surface reflectances and aerosol properties calculated from GEOS‐Chem. Use of GEOS‐Chem aerosol optical properties in the MODIS retrieval not only results in an improved AOD product but also allows quantitative evaluation of model aerosol mass from the comparison of simulated and observed AODs. The aircraft measurements show narrower aerosol size distributions than those usually assumed in models, and this has important implications for AOD retrievals. Our MODIS AOD retrieval compares well to the ground‐based AERONET data ( R = 0.84, slope = 1.02), significantly improving on the MODIS c005 operational product. Inference of surface PM 2.5 from our MODIS AOD retrieval shows good correlation to the EPA‐AQS data ( R = 0.78) but a high regression slope (slope = 1.48). The high slope is seen in all AOD‐inferred PM 2.5 concentrations (AERONET: slope = 2.04; MODIS c005: slope = 1.51) and could reflect a clear‐sky bias in the AOD observations. The ensemble of MODIS, aircraft, and surface data are consistent in pointing to a model overestimate of sulfate in the mid‐Atlantic and an underestimate of organic and dust aerosol in the southeastern United States. The sulfate overestimate could reflect an excessive contribution from aqueous‐phase production in clouds, while the organic carbon underestimate could possibly be resolved by a new secondary pathway involving dicarbonyls.
Abstract. We use observations from the April 2008 NASA ARCTAS aircraft campaign to the North American Arctic, interpreted with a global 3-D chemical transport model (GEOS-Chem), to better understand the sources and cycling of hydrogen oxide radicals (HOx≡H+OH+peroxy radicals) and their reservoirs (HOy≡HOx+peroxides) in the springtime Arctic atmosphere. We find that a standard gas-phase chemical mechanism overestimates the observed HO2 and H2O2 concentrations. Computation of HOx and HOy gas-phase chemical budgets on the basis of the aircraft observations also indicates a large missing sink for both. We hypothesize that this could reflect HO2 uptake by aerosols, favored by low temperatures and relatively high aerosol loadings, through a mechanism that does not produce H2O2. We implemented such an uptake of HO2 by aerosol in the model using a standard reactive uptake coefficient parameterization with γ(HO2) values ranging from 0.02 at 275 K to 0.5 at 220 K. This successfully reproduces the concentrations and vertical distributions of the different HOx species and HOy reservoirs. HO2 uptake by aerosol is then a major HOx and HOy sink, decreasing mean OH and HO2 concentrations in the Arctic troposphere by 32% and 31% respectively. Better rate and product data for HO2 uptake by aerosol are needed to understand this role of aerosols in limiting the oxidizing power of the Arctic atmosphere.
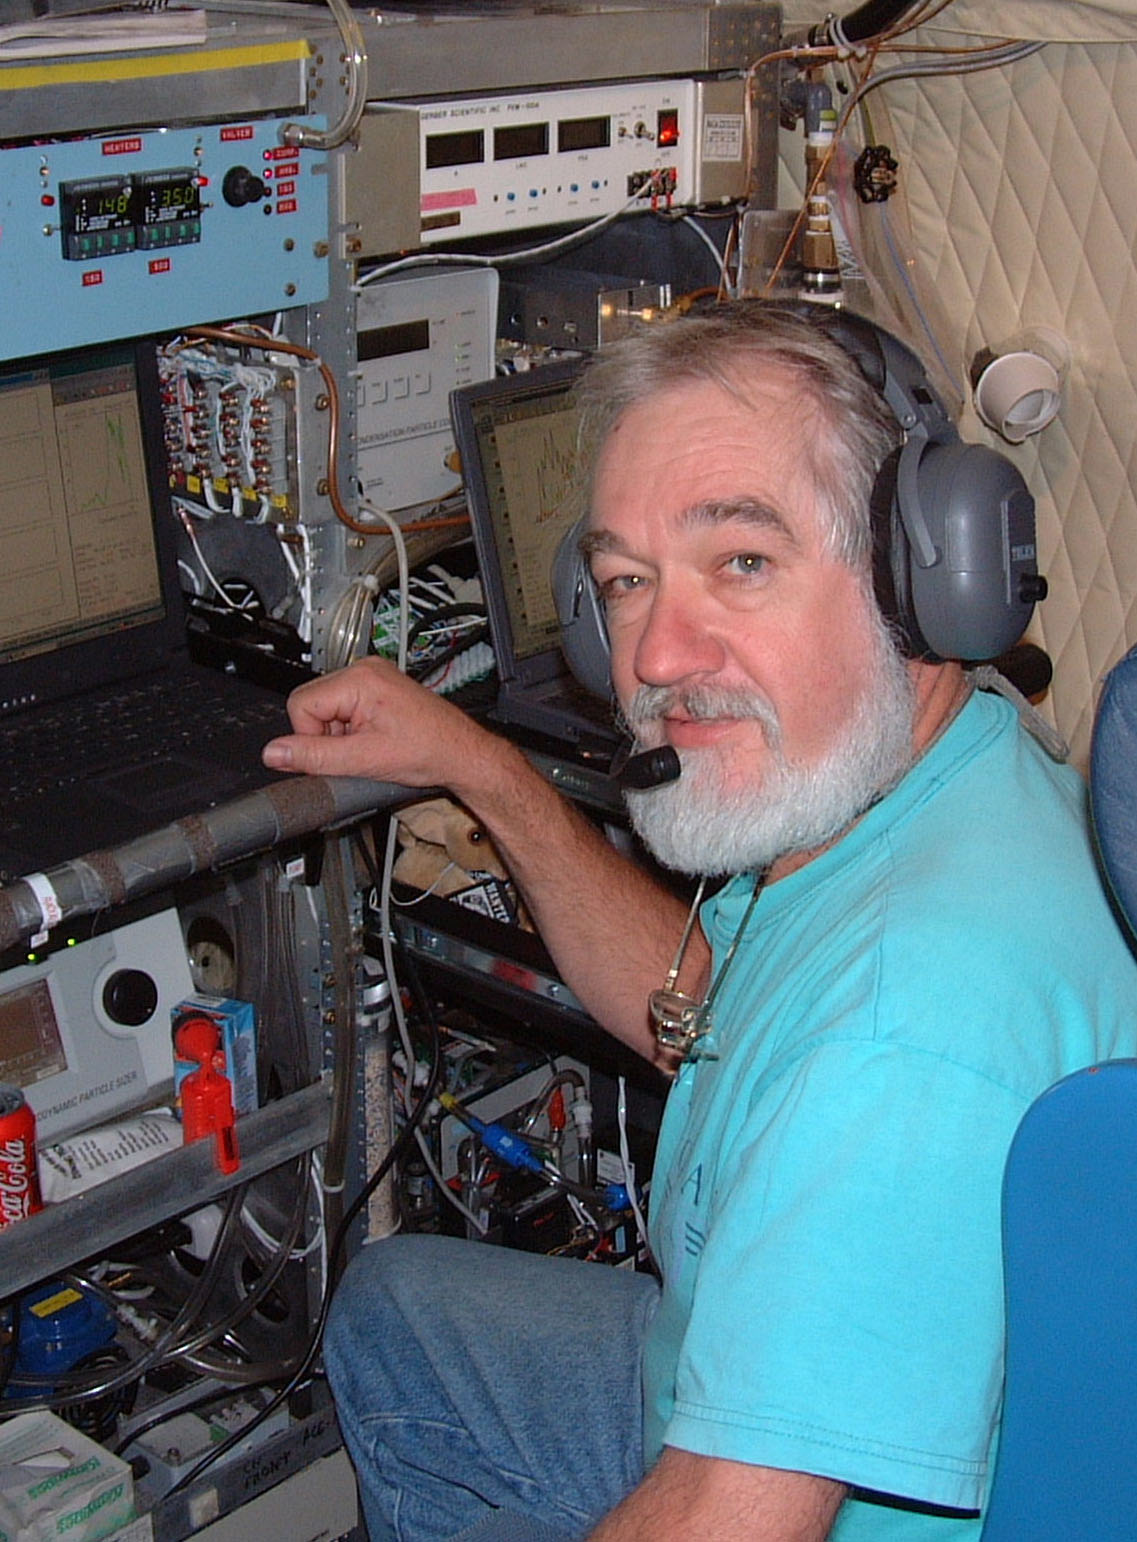 Antony Clarke合作论文数Department of Oceanography, School of Ocean & Earth Science & Technology, University of Hawai`i at Manoa81
 Steven G. Howell合作论文数School of Ocean, Earth Science and Technology, University of Hawaii54Y. Shinozuka合作论文数36Vladimir N Kapustin合作论文数31V. Kapustin合作论文数Sch Ocean & Earth Sci & Technol, Univ Hawaii28Steffen Freitag合作论文数20
 Jack Dibb合作论文数Earth Systems Research Center, Institute of Earth, Oceans and Space, University Of New Hampshire20
 Jens Redemann合作论文数CLoud-CLimatE-Aerosol-Radiation Research Group, School of Meteorology, College of Atmospheric and Geographic Sciences, University of Oklahoma18
 Philip B Russell合作论文数Ames Research Center, National Aeronautics and Space Administration18J. M. Livingston合作论文数17Vera Brekhovskikh合作论文数16
 Jose-Luis Jimenez合作论文数Department of Chemistry, College of Arts and Sciences, University of Colorado Boulder14
 Rodney Weber合作论文数School of Earth and Atmospheric Sciences, College of Sciences, Georgia Institute of Technology13
 Chris Hostetler合作论文数NASA Langley Research Center13Theodore L. Anderson合作论文数12l shank合作论文数11
 Barry Huebert合作论文数Department of Oceanography, University of Hawai`i at Manoa11Edward L. Winstead合作论文数11
 Peter F Decarlo合作论文数Laboratory of Atmospheric Chemistry|Paul Scherrer Institut10Lee Thornhill合作论文数Head and Neck Oncology Program, Dana Farber Cancer Institute10britt e anderson合作论文数9Sarah J. Masonis合作论文数9BE Anderson合作论文数8
 Athanasios Nenes合作论文数Laboratory of Atmospheric Processes and their Impacts, School of Architecture, Civil & Environmental Engineering, Ecole Polytechnique Federale de Lausanne8
 Terry L. Lathem合作论文数Sch Earth & Atmospher Sci, Georgia Inst Technol8
 Gregory Carmichael合作论文数Department of Chemical & Biochemical Engineering, University of Iowa8
 Glenn Diskin合作论文数Langley Research Center, National Aeronautics and Space Administration8
 John Hair合作论文数Langley Research Center, National Aeronautics and Space Administration8
 Glen W. Sachse合作论文数7
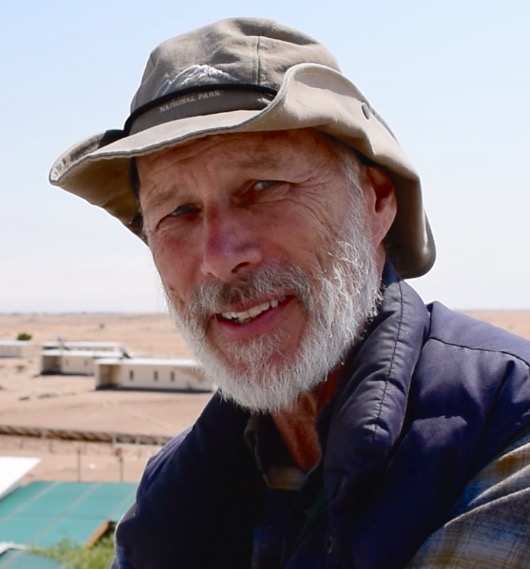 Brent N Holben合作论文数Goddard Space Flight Center, National Aeronautics and Space Administration7
 Teresa Campos合作论文数Atmospheric Chemistry Observations & Modeling Lab, National Center for Atmospheric Research7
 Ralph A Kahn合作论文数NASA Goddard Space Flight Center;The University of Colorado Boulder7
 Bruce Anderson合作论文数Department of Earth and Environment, Boston University7AD Clarke合作论文数6
 Robert Wood合作论文数Department of Atmospheric Sciences, University of Washington6
 John D. Crounse合作论文数Division of Geological and Planetary Sciences, California Institute of Technology6
 Beat F. Schmid合作论文数Pacific Northwest National Laboratory6K. G. Moore合作论文数6
 Sarah J. Doherty合作论文数Cooperative Institute for Climate, Ocean, and Ecosystem Studies, College of the Environment, University of Washington;Department of Atmospheric Sciences, College of the Environment, University of Washington6
 K. Knobelspiesse合作论文数Department of Applied Physics and Applied Mathematics, Columbia University6
 Michael J. Cubison合作论文数Atmospheric Sciences Group;University of Manchester;Atmospheric Sciences Group, University of Manchester6
 Paul Wennberg合作论文数Ronald and Maxine Linde Center for Global Environmental Science, California Institute of Technology;Laboratory for the Study of Atmospheric Composition, California Institute of Technology6
 Byron Blomquist合作论文数Cooperative Institute for Research in Environmental Sciences;University of Colorado Boulder;NOAA Physical Sciences Division6terry l anderson合作论文数5sandra freitag合作论文数5
 Ronald C. Cohen合作论文数Department of Chemistry, College of Chemistry, University of California, Berkeley;Department of Earth & Planetary Science, University of California, Berkeley;Energy and Environment Technologies Division, LBNL5
 Andreas Beyersdorf合作论文数Department of Chemistry & Biochemistry, California State University, San Bernardino5
 David S. Covert (David Covert)合作论文数Department of Atmospheric Sciences, College of the Environment, University of Washington5




