Remotely sensed observations of built environments are controlled by the physical properties of the materials and the structural form of the objects used to construct the environment. When using remote sensing to map and monitor built environments, it is important to understand how different sensors respond to the objects and materials. We give a brief overview of some fundamental characteristics of built environments as imaged by optical, microwave, thermal, and night-light sensors. The focus is on the relationship between physical characteristics and sensor response in the context of uniqueness and fundamental questions of inference based on remote measurements.
Smallholder irrigation is crucial to livelihoods and growth in rural agro-economies. Identifying where it occurs provides valuable insights for agriculture extension, water management, infrastructure investments, marketing and energy provision. Remote sensing methods can aid but have been stymied by the small plot sizes, especially of irrigated plots. Humid tropical climates are characterized by high temperatures and heavy seasonal or year-round rainfall. This adds an additional layer of challenge due to fewer cloud-free imagery from persistent cloud cover. This study focuses on these settings to compare the performance, interpretability and transferability of classification using embeddings versus a feature engineering approach. Geospatial foundation models such as AlphaEarth Foundations (AEF) have emerged to address the contrasting scarcity of high-quality labels in comparison to increasing volumes of earth observation data. The embeddings from these models have been shown to generate maps from sparse labels outperforming traditional machine learning approaches in certain cases. In this study, we utilize a nation-wide smallholder irrigation survey data from Uganda as a data-rich region and pilot surveys from Zambia as a data-sparse region. We present a reproducible cloud-native Earth observation workflow in Google Earth Engine that discusses the tradeoffs and performance of the feature engineering approach compared to foundational model embeddings. The results show that a model trained on AEF embeddings outperforms a traditional feature engineering approach on a rich label dataset. The performance is similar in a data-sparse region. However, the embedding models do not lend themselves to auditable methods for applicability to regions where no data is available.
Because of high visible and near-infrared (VNIR) reflectance, and deep shortwave infrared (SWIR) absorption, snow and ice are unique among terrestrial land cover. As such, both are well-suited to mapping and monitoring using optical remote sensing. However, to date, almost all studies of snow and ice spectroscopy have been limited to single or small numbers of specific cryospheric environments. These studies serve a diversity of objectives, but together also suggest the importance of the global continuum of snow and ice composition and spectroscopy. The continuum of snow and ice composition gives rise to the characteristics that allow different types of snow and ice to be distinguished optically. Particularly with imaging spectrometers. Characterization of this continuum of reflectance can facilitate development of physical models to quantify snow and ice composition and abundance, particularly in the presence of other types of land cover. In this study, a collection of similar to 140,000,000 visible through SWIR (VSWIR) reflectance spectra, collected by NASA's EMIT imaging spectrometer from 56 diverse cryospheric environments, is used to characterize the continuum of snow and ice reflectance. This continuum is characterized using linear dimensionality reduction to quantify the dimensionality and topology of the spectral feature space of snow and ice. The resulting spectral feature space is effectively two-dimensional with a planar spectral feature continuum bounded by dry and wet snow, ice and dark targets (e.g., shadow, water). Because of the near collinearity of snow and ice endmember reflectances, linear spectral mixture models based only on these endmembers are ill-posed and unstable to inversion. However, in landscapes where sufficiently homogeneous seasonal snow is present with other land cover types, the standardized spectroscopic mixture model based on the Substrate, Vegetation and Dark (SVD) continuum can be extended with an instance-specific snow endmember (SVD + snow) to yield plausible areal fraction estimates with small misfits to observed spectra. More generally, the snow-ice-dark continuum can also be represented accurately with an optimal normalized difference index exploiting compositionally distinct differential absorptions at similar to 650 and similar to 1230 nm to distinguish dry from wet snow from white and blue ice. This optimized index, referred to as the Continuous Cryosphere Index (CCI), minimizes BRDF effects of topographic slope and aspect relative to illumination, while avoiding the saturation that causes the Normalized Difference Snow Index (NDSI) to conflate wet snow with white and blue ice reflectance. In addition to imaging spectrometers like EMIT, operational sensors like MODIS, VIIRS and WorldView-3 have spectral bands near 650 nm and 1230 nm, so they could also be used for CCI mapping.
The urban scaling theory (UST) strives for a universal taxonomy that depicts relationships among urban indicators (e.g. energy consumption, economic output) with city size. However, the lack of international agreement on city definitions and statistics complicates cross-country comparisons of urban scaling performance. Remote sensing provides a uniform standard for measuring cities around the world. To scrutinize the consistency of UST, we quantified changes in remotely sensed urban built-up areas (UBA) and nighttime lights (NTL) distributions from 11,581 cities in 61 countries spanning 2000-2020, representing urban physical elements and socioeconomic activities, respectively. We find that UBA is well described by UST in all analyzed countries, while NTL aligns with 98% of them. UST quantified by remote sensing shows greater robustness than country-dependent aggregate statistics. We also observed disparities of scaling exponents (beta) among countries, with UBA all being sublinear (beta < 1), and NTL ranging from 0.46 to 1.22 with a median of 0.94. Both UST and rank-size distributions of urban area and population show stronger scaling relationships for countries with larger networks of built environments, (Brazil, China, Germany, Japan, Russia, United States) suggesting that both size and evolution of urban systems impact the underlying scaling processes. Comparison of scaling properties of remotely sensed UBA and NTL captures complementary physical characteristics of built environments while minimizing the Modifiable Area Unit Problem introduced using spatially aggregated metrics within administrative units. Our findings highlight the consistency of urban growth patterns while confirming the systematic socioeconomic disparities among urban systems of varying size and growth trajectory.
Anthropogenic night light (ANL) provides a unique observable for the spatially explicit mapping of human-modified landscapes in the form of lighted infrastructure. Since 2013, the Visible Infrared Imaging Radiometer Suite (VIIRS) Day Night Band (DNB) on the Suomi NPP satellite has provided more than a decade of near-daily observations of anthropogenic night light. The objective of this study is to quantify changes in ANL in developed eastern China post-2013 using VIIRS DNB monthly mean brightness composites. Specifically, to constrain sub-annual and interannual changes in night light brightness to distinguish between apparent and actual change of ANL sources, and then conduct a spatiotemporal analysis of observed changes to identify areas of human activity, urban development and rural electrification. This analysis is based on a combination of time-sequential bitemporal brightness distributions and quantification of the spatiotemporal evolution of night light using Empirical Orthogonal Function (EOF) analysis. Bitemporal brightness distributions show that bright (>~1 nW/cm2/sr) ANL is heteroskedastic, with temporal variability diminishing with increasing brightness. Hence, brighter lights are more temporally stable. In contrast, dimmer (<~1 nW/cm2/sr) ANL is much more variable on monthly time scales. The same patterns of heteroskedasticity and variability of the lower tail of the brightness distribution are observed in year-to-year distributions. However, year-to-year brightness increases vary somewhat among different years. While bivariate distributions quantify aggregate changes on both subannual and interannual time scales, spatiotemporal analysis quantifies spatial variations in the year-to-year temporal evolution of ANL. The spatial distribution of brightening (and, much less commonly, dimming) revealed by the EOF analysis indicates that most of the brightening since 2013 has occurred at the peripheries of large cities and throughout the networks of smaller settlements on the North China Plain, the Yangtze River Valley, and the Sichuan Basin. A particularly unusual pattern of sequential brightening and dimming is observed on the Loess Plateau north of Xi’an, where extensive terrace construction has occurred. All aspects of this analysis highlight the difference between apparent and actual changes in night light sources. This is important because many users of VIIRS night light attribute all observed changes in imaged night light to actual changes in anthropogenic light sources—without consideration of low luminance variability related to the imaging process itself.
In many parts of the tropics a prolonged dry season presents an economic opportunity for farmers to grow a second crop beyond an otherwise single crop that a shorter rainy season permits. These additional second crops can ensure food security, improve nutrition and increase incomes. The first contribution of this paper is to granularly identify regions of Sub-Saharan Africa where a prolonged dry season exists. Energy planners are also keen to assess where dry-season agriculture is being currently practiced and the extent of the area cropped in the dry season. Assuming this is carried out using irrigation, this allows planners to assess the scale of water and energy needs if these practices are to be scaled. The phenological characterization of the landscape using vegetation patterns helps to identify regions where dry season irrigation is feasible. This study operationalizes an irrigation detection methodology originally applied to the Ethiopian highlands built using visually collected labels from high resolution imagery and limited ground truth data. The second contribution of the paper lies in the application of the methodology over a range of African geographies, with the exclusive use of visually collected labels. The methodology relies on the distinct phenology of irrigated crops in the dry season that differentiates them from rain-fed agriculture and evergreen vegetation. The method is applied across different countries in sub-Saharan Africa to detect smallholder plots that are as small as a tenth of a hectare. The method is found to be viable in semi-arid areas with a prolonged dry season such as Northern Nigeria and Burkina Faso. We demonstrate how humid regions such as those in Uganda with longer duration rainfall are not well suited for the methodology. This is because the short dry season does not allow sufficient time for non-irrigated vegetation to senesce making it difficult to distinguish dry-season irrigation.
Spectral mixing space characterization is especially important for studies of built environments because of the range of materials around which humans establish residence. With the launch of NASA’s EMIT imaging spectrometer in 2022, spectroscopic characterization of a variety of built environments using atmospherically corrected imagery collected by a common instrument became feasible. The recent availability of four cloud-free EMIT granules imaging Beijing, Chongqing, Guangzhou and Shanghai in early 2025 allows us to address a critical limitation of a 2023 study of built environments using EMIT. The 3D topology of an EMIT mixing space combining all four cities and their surrounding environments shows the familiar ternary structure with Substrate, Vegetation, Dark endmember apexes but extends it to a 3D tetrahedral structure with the addition of a non-photosynthetic vegetation (NPV) endmember. In contrast to multispectral characterizations, EMIT spectra distinguish a variety of anthropogenic substrates not resolvable with broadband sensors. However, semivariogram analysis of coincident 10 m Sentinel-2 and 1.2 m WorldView-3 imagery confirms extensive spectral mixing at the ~50 m scale of the EMIT IFOV. As a result, some of the spectral diversity resolvable with meter resolution spectroscopy is certainly attenuated by decameter resolution sensors.
The standardized spectral mixture model combines the specificity of a physically based representation of a spectrally mixed pixel with the generality and portability of a spectral index. Earlier studies have used spectrally and geographically diverse collections of broadband and spectroscopic imagery to show that the reflectance of the majority of ice-free landscapes on Earth can be represented as linear mixtures of rock and soil substrates (S), photosynthetic vegetation (V) and dark targets (D) composed of shadow and spectrally absorptive/transmissive materials. However, both broadband and spectroscopic studies of the topology of spectral mixing spaces raise questions about the completeness and generality of the Substrate, Vegetation, Dark (SVD) model for imaging spectrometer data. This study uses a spectrally diverse collection of 40 granules from the EMIT imaging spectrometer to verify the generality and stability of the spectroscopic SVD model and characterize the SVD topology and plane of substrates to assess linearity of spectral mixing. New endmembers for soil and non-photosynthetic vegetation (NPV; N) allow the planar SVD model to be extended to a tetrahedral SVDN model to better accommodate the 3D topology of the mixing space. The SVDN model achieves smaller misfit than the SVD, but does so at the expense of implausible fractions beyond [0, 1]. However, a refined spectroscopic SVD model still achieves small (<0.03) RMS misfit, negligible sensitivity to endmember variability and strongly linear scaling over more than an order of magnitude range of spatial resolution.
Spaceborne spectroscopic imaging offers the potential to improve our understanding of biodiversity and ecosystem services, particularly for challenging and rich environments like mangroves. Understanding the signals present in large volumes of high-dimensional spectroscopic observations of vegetation communities requires the characterization of seasonal phenology and response to environmental conditions. This analysis leverages both spectroscopic and phenological information to characterize vegetation communities in the Sundarban riverine mangrove forest of the Ganges–Brahmaputra delta. Parallel analyses of surface reflectance spectra from NASA’s EMIT imaging spectrometer and MODIS vegetation abundance time series (2000–2022) reveal the spectroscopic and phenological diversity of the Sundarban mangrove communities. A comparison of spectral and temporal feature spaces rendered with low-order principal components and 3D embeddings from Uniform Manifold Approximation and Projection (UMAP) reveals similar structures with multiple spectral and temporal endmembers and multiple internal amplitude continua for both EMIT reflectance and MODIS Enhanced Vegetation Index (EVI) phenology. The spectral and temporal feature spaces of the Sundarban represent independent observations sharing a common structure that is driven by the physical processes controlling tree canopy spectral properties and their temporal evolution. Spectral and phenological endmembers reside at the peripheries of the mangrove forest with multiple outward gradients in amplitude of reflectance and phenology within the forest. Longitudinal gradients of both phenology and reflectance amplitude coincide with LiDAR-derived gradients in tree canopy height and sub-canopy ground elevation, suggesting the influence of surface hydrology and sediment deposition. RGB composite maps of both linear (PC) and nonlinear (UMAP) 3D feature spaces reveal a strong contrast between the phenological and spectroscopic diversity of the eastern Sundarban and the less diverse western Sundarban.
Due to their transient nature, clouds represent anomalies relative to the underlying landscape of interest. Hence, the challenge of cloud identification can be considered a specific case in the more general problem of anomaly detection. The confounding effects of transient anomalies are particularly troublesome for spatiotemporal analysis of land surface processes. While spatiotemporal characterization provides a statistical basis to quantify the most significant temporal patterns and their spatial distributions without the need for a priori assumptions about the observed changes, the presence of transient anomalies can obscure the statistical properties of the spatiotemporal processes of interest. The objective of this study is to implement and evaluate a robust approach to distinguish clouds and other transient anomalies from diurnal and annual thermal cycles observed with time-lapse thermography. The approach uses Robust Principal Component Analysis (RPCA) to statistically distinguish low-rank (L) and sparse (S) components of the land surface temperature image time series, followed by a spatiotemporal characterization of its low rank component to quantify the dominant diurnal and annual thermal cycles in the study area. RPCA effectively segregates clouds, sensor anomalies, swath gaps, geospatial displacements and transient thermal anomalies into the sparse component time series. Spatiotemporal characterization of the low-rank component time series clearly resolves a variety of diurnal and annual thermal cycles for different land covers and water bodies while segregating transient anomalies potentially of interest.
Growing environmental risk threatens communities in cold regions, particularly as climate change contributes to permafrost thaw, a reduction in sea-ice extent, and some of the largest rates of coastal erosion on earth. In the context of these significant and growing risks, the Engineering With Nature® (EWN®) program formed its cold regions work unit in 2021 to explore the potential to apply EWN approaches in these areas to mitigate environmental risk while supporting resilient outcomes. The work unit’s objectives include working with communities to preserve the natural environment and traditions, advancing the work unit’s understanding of coldregion environments, and providing guidance on the implementation of natural and nature-based features (NNBF) and EWN in cold regions to increase resilience. This technical note (TN) provides an overview of the EWN in cold regions technical approach as applied to Point Hope, Alaska, which includes community engagement, the integration of traditional ecological knowledge (TEK) throughout the project, and the development of cold-regions-specific knowledge and tools.
Polis is a platform that leverages machine intelligence to scale up deliberative processes. In this paper, we explore the opportunities and risks associated with applying Large Language Models (LLMs) towards challenges with facilitating, moderating and summarizing the results of Polis engagements. In particular, we demonstrate with pilot experiments using Anthropic's Claude that LLMs can indeed augment human intelligence to help more efficiently run Polis conversations. In particular, we find that summarization capabilities enable categorically new methods with immense promise to empower the public in collective meaning-making exercises. And notably, LLM context limitations have a significant impact on insight and quality of these results. However, these opportunities come with risks. We discuss some of these risks, as well as principles and techniques for characterizing and mitigating them, and the implications for other deliberative or political systems that may employ LLMs. Finally, we conclude with several open future research directions for augmenting tools like Polis with LLMs.
NASA’s Earth Surface Mineral Dust Source Investigation (EMIT) mission seeks to use spaceborne imaging spectroscopy (hyperspectral imaging) to map the mineralogy of arid dust source regions. Here we apply recent developments in Joint Characterization (JC) and the spectral Mixture Residual (MR) to explore the information content of data from this novel mission. Specifically, for a mosaic of 20 spectrally diverse scenes, we find: (1) a generalized three-endmember (Substrate, Vegetation, Dark; SVD) spectral mixture model is capable of capturing the preponderance (99% in three dimensions) of spectral variance with low misfit (99% pixels with <3.7% RMSE); (2) manifold learning (UMAP) is capable of identifying spatially coherent, physically interpretable clustering relationships in the spectral feature space; (3) UMAP yields results that are at least as informative when applied to the MR as when applied to raw reflectance; (4) SVD fraction information usefully contextualizes UMAP clustering relationships, and vice-versa (JC); and (5) when EMIT data are convolved to spectral response functions of multispectral instruments (Sentinel-2, Landsat 8/9, Planet SuperDove), SVD fractions correlate strongly across sensors, but UMAP clustering relationships for the EMIT hyperspectral feature space are far more informative than for simulated multispectral sensors. Implications are discussed for both the utility of EMIT data in the near-term and for the potential of high signal-to-noise (SNR) spaceborne imaging spectroscopy more generally, to transform the future of optical remote sensing in the years and decades to come.
The Dynamic World product is a discrete land cover classification of Sentinel 2 reflectance imagery that is global in extent, retrospective to 2015, and updated continuously in near real time. The classifier is trained on a stratified random sample of 20,000 hand-labeled 5 × 5 km Sentinel 2 tiles spanning 14 biomes globally. Since the training data are based on visual interpretation of image composites by both expert and non-expert annotators, without explicit spectral properties specified in the class definitions, the spectral characteristics of the classes are not obvious. The objective of this study is to quantify the physical distinctions among the land cover classes by characterizing the spectral properties of the range of reflectance present within each of the Dynamic World classes over a variety of landscapes. This is achieved by comparing both the eight-class probability feature space (excluding snow) and the maximum probability class assignment (label) distributions to continuous land cover fraction estimates derived from a globally standardized spectral mixture model. Standardized substrate, vegetation, and dark (SVD) endmembers are used to unmix nine Sentinel 2 reflectance tiles from nine spectral diversity hotspots for comparison between the SVD land cover fraction continua and the Dynamic World class probability continua and class assignments. The variance partition for the class probability feature spaces indicates that eight of these nine hotspots are effectively five-dimensional to 95% of variance. Class probability feature spaces of the hotspots all show a tetrahedral form with probability continua spanning multiple classes. Comparison of SVD land cover fraction distributions with maximum probability class assignments (labels) and probability feature space distributions reveal a clear distinction between (1) physically and spectrally heterogeneous biomes characterized by continuous gradations in vegetation density, substrate albedo, and structural shadow fractions, and (2) more homogeneous biomes characterized by closed canopy vegetation (forest) or negligible vegetation cover (e.g., desert, water). Due to the ubiquity of spectrally heterogeneous biomes worldwide, the class probability feature space adds considerable value to the Dynamic World maximum probability class labels by offering users the opportunity to depict inherently gradational heterogeneous landscapes otherwise not generally offered with other discrete thematic classifications.
The monitoring of agronomic parameters like biomass, water stress, and plant health can benefit from synergistic use of all available remotely sensed information. Multispectral imagery has been used for this purpose for decades, largely with vegetation indices (VIs). Many multispectral VIs exist, typically relying on a single feature—the spectral red edge—for information. Where hyperspectral imagery is available, spectral mixture models can use the full VSWIR spectrum to yield further insight, simultaneously estimating area fractions of multiple materials within mixed pixels. Here we investigate the relationships between VIs and mixture models by comparing hyperspectral endmember fractions to six common multispectral VIs in California’s diverse crops and soils. In so doing, we isolate spectral effects from sensor- and acquisition-specific variability associated with atmosphere, illumination, and view geometry. Specifically, we compare: (1) fractional area of photosynthetic vegetation (Fv) from 64,000,000 3–5 m resolution AVIRIS-ng reflectance spectra; and (2) six popular VIs (NDVI, NIRv, EVI, EVI2, SR, DVI) computed from simulated Planet SuperDove reflectance spectra derived from the AVIRIS-ng spectra. Hyperspectral Fv and multispectral VIs are compared using both parametric (Pearson correlation, ρ) and nonparametric (Mutual Information, MI) metrics. Four VIs (NIRv, DVI, EVI, EVI2) showed strong linear relationships with Fv (ρ > 0.94; MI > 1.2). NIRv and DVI showed strong interrelation (ρ > 0.99, MI > 2.4), but deviated from a 1:1 correspondence with Fv. EVI and EVI2 were strongly interrelated (ρ > 0.99, MI > 2.3) and more closely approximated a 1:1 relationship with Fv. In contrast, NDVI and SR showed a weaker, nonlinear, heteroskedastic relation to Fv (ρ < 0.84, MI = 0.69). NDVI exhibited both especially severe sensitivity to unvegetated background (–0.05 < NDVI < +0.6) and saturation (0.2 < Fv < 0.8 for NDVI = 0.7). The self-consistent atmospheric correction, radiometry, and sun-sensor geometry allows this simulation approach to be further applied to indices, sensors, and landscapes worldwide.
Characterization of topology and dimensionality of spectral feature spaces provides insight into information content. The objective of this study is to characterize topology and spectral dimensionality of spectral mixing spaces representing a diversity of built environments in urban areas worldwide using both spaceborne and airborne imaging spectroscopy. Comparing complementary types of dimensionality reduction to render high dimensional spectral mixing spaces allows for characterization of both spectral dimensionality and mixing space topology. Using a diverse collection of 30 decameter-resolution urban core subscenes imaged by the EMIT spaceborne imaging spectrometer and 5 sub-decameter-resolution urban gradient flight lines imaged by the AVIRIS-NG airborne imaging spectrometer, we conduct such characterizations. Global scale topology of low order principal component-derived mixing spaces resembles the Substrate, Vegetation, Dark (SVD) triangular topology of globally diverse composite mixing spaces found in numerous earlier studies - but these spaces are also characterized by multiple (2-3) distinct substrate endmembers and a wide variety of less common spectra corresponding to synthetic anthropogenic materials. Local scale topology from 2D and 3D UMAP manifold embeddings reveals the presence of multiple spectrally distinct impervious substrate mixing continua corresponding to geographically distinct built environments.
NASA’s Gateway to Astronaut Photography of Earth contains over 30,000 photos of ~2500 cataloged urban lightscapes (anthropogenic night light) taken from the International Space Station. A subset of over 100 of these multispectral DSLR photos are of sufficient spatial resolution, sharpness and exposure to be potentially useful for broadband spectral characterization of urban lightscapes. Spectral characterization of multiple urban lightscapes can provide a basis for quantifying intra and interurban variability in night light brightness, color and extent, as well as the potential for change analyses. A comparative analysis of simulated atmospheric transmissivity from the MODTRAN radiative transfer model indicates that the spectral slopes of transmissivity spectra are relatively insensitive model atmospheres, with variations in atmospheric path length and aerosol optical depth primarily affecting the bias of the spectrum rather than the slope. A mosaic of 18 intercalibrated, transmissivity-compensated RGB photos renders a spectral feature space bounded by four clearly defined spectral endmembers corresponding to white, yellow and red light sources, with brightness modulated by a dark background endmember. These four spectral endmembers form the basis of a linear spectral mixture model which can be inverted to provide estimates of the areal fraction of each endmember present within every pixel field of view. The resulting spectral feature spaces consistently show two distinct mixing trends extending from the dark endmember to flat spectrum (white–yellow) and warm spectrum (orange) sources. The distribution of illuminated pixels is strongly skewed toward a lower luminance background of warm spectrum street lighting with brighter lights, generally corresponding to point sources and major thoroughfares.
Most applications of multispectral imaging are explicitly or implicitly dependent on the dimensionality and topology of the spectral mixing space. Mixing space characterization refers to the identification of salient properties of the set of pixel reflectance spectra comprising an image (or compilation of images). The underlying premise is that this set of spectra may be described as a low dimensional manifold embedded in a high dimensional vector space. Traditional mixing space characterization uses the linear dimensionality reduction offered by Principal Component Analysis to find projections of pixel spectra onto orthogonal linear subspaces, prioritized by variance. Here, we consider the potential for recent advances in nonlinear dimensionality reduction (specifically, manifold learning) to contribute additional useful information for multispectral mixing space characterization. We integrate linear and nonlinear methods through a novel approach called Joint Characterization (JC). JC is comprised of two components. First, spectral mixture analysis (SMA) linearly projects the high-dimensional reflectance vectors onto a 2D subspace comprising the primary mixing continuum of substrates, vegetation, and dark features (e.g., shadow and water). Second, manifold learning nonlinearly maps the high-dimensional reflectance vectors into a low-D embedding space while preserving manifold topology. The SMA output is physically interpretable in terms of material abundances. The manifold learning output is not generally physically interpretable, but more faithfully preserves high dimensional connectivity and clustering within the mixing space. Used together, the strengths of SMA may compensate for the limitations of manifold learning, and vice versa. Here, we illustrate JC through application to thematic compilations of 90 Sentinel-2 reflectance images selected from a diverse set of biomes and land cover categories. Specifically, we use globally standardized Substrate, Vegetation, and Dark (S, V, D) endmembers (EMs) for SMA, and Uniform Manifold Approximation and Projection (UMAP) for manifold learning. The value of each (SVD and UMAP) model is illustrated, both separately and jointly. JC is shown to successfully characterize both continuous gradations (spectral mixing trends) and discrete clusters (land cover class distinctions) within the spectral mixing space of each land cover category. These features are not clearly identifiable from SVD fractions alone, and not physically interpretable from UMAP alone. Implications are discussed for the design of models which can reliably extract and explainably use high-dimensional spectral information in spatially mixed pixels—a principal challenge in optical remote sensing.
Multispectral and hyperspectral feature spaces are useful for a variety of remote sensing applications ranging from spectral mixture modeling to discrete thematic classification. In many of these applications, models are used to project the higher dimensional continuum of reflectances (or radiances) onto lower dimensional mappings of the image target’s physical properties or categorical composition. In such cases, characterization of the feature space dimensionality, geometry and topology can provide fundamental guidance for effective model design. Utility of this characterization, however, hinges on identification of appropriate basis vectors for the feature space. The objective of this study is to compare and contrast two fundamentally different approaches for identifying feature space basis vectors via dimensionality reduction. In so doing, we illustrate how these two approaches can be combined to render a joint characterization that reveals spectral properties not apparent using either approach alone. We use a diverse collection of AVIRIS-NG reflectance spectra of ice and snow to illustrate the utility of the joint characterization to facilitate both modeling and classification of snow and ice reflectance. Joint characterization is also shown to assist with interpretation of physical properties inferred from the spectra. Spectral feature spaces combining principal components (PCs) and t-distributed Stochastic Neighbor Embeddings (t-SNEs) provide both physically interpretable dimensions representing the global structure of cryospheric reflectance properties as well as local manifold structures revealing clustering not resolved within the global continuum. The joint characterization reveals distinct continua for snow-firn gradients on different parts of the Greenland Ice Sheet and multiple clusters of ice reflectance properties common to both glacier and sea ice in different locations. The clustering revealed in the t-SNE feature spaces, and extended to the joint characterization, distinguishes subtle differences in spectral curvature specific to different spatial locations within the snow accumulation zone, as well as BRDF effects related to view geometry. The ability of the PC + t-SNE joint characterization to produce a physically interpretable spectral feature space revealing global topology while preserving local manifold structures for cryospheric hyperspectra suggests that this type of characterization might be extended to the much higher dimensional hyperspectral feature space of all terrestrial land cover.
Modeling spatiotemporal data can be a challenge due to the plethora of processes, both independent and interacting, which may or may not contribute to the measurements. Characterization can be considered a complement to modeling by helping guide assumptions about generative processes and their representation in the data. For high-D signals, Dimensionality Reduction (DR) is a frequently implemented type of characterization designed to mitigate the effects of the so-called “curse of dimensionality”. For decades, Principal Component (PC) and Empirical Orthogonal Function (EOF) analysis has been used as a linear, invertible approach to dimensionality reduction and spatiotemporal analysis. Recent years have seen the additional development of a suite of nonlinear DR algorithms, frequently categorized as “manifold learning”. Here, we explore the idea of joint characterization of spatiotemporal data manifolds using the PC/EOF approach alongside two nonlinear DR approaches: Laplacian Eigenmaps (LE) and t-distributed Stochastic Neighbor Embedding (t-SNE). Starting with a synthetic example and progressing to global, regional, and field scale spatiotemporal datasets spanning roughly 5 orders of spatial magnitude and 2 orders of temporal magnitude, we show these three DR approaches can yield complementary information about the topology of spatiotemporal data manifolds. Compared to the PC/EOF projections, the nonlinear DR approaches yield more compact manifolds with decreased ambiguity in temporal endmembers (LE) and/or in spatiotemporal clustering (t-SNE), compared to the relatively diffuse temporal feature space produced by the PC/EOF approach. However, these properties are compensated by the greater interpretability of PCs and EOFs than of the LE or t-SNE dimensions, as well as significantly lower computational demand and diminished sensitivity to spatial aliasing for PCs/EOFs than LE or t-SNE. Taken together, we find the joint characterization using the three complementary DR approaches capable of providing substantially greater insight about the generative processes represented in spatiotemporal datasets than is possible using any single approach alone. This parsimonious, complementary characterization of both local manifold structure and global variance can advance remote sensing time series analysis by providing important context to constrain and guide design of effective spatiotemporal models.
 Daniel Sousa合作论文数Head and Neck Surgery Department, Instituto Português de Oncologia de Lisboa30
 Christopher Elvidge合作论文数Payne Institute of Public Policy, Colorado School of Mines13
 Steven L. Goodbred合作论文数Marine Sciences Research Center, State University of New York8
 David T. Sandwell合作论文数Scripps Institution of Oceanography, University of California, San Diego6
 Patrick L. Kinney合作论文数School of Public Health, Boston University;Institute for Sustainable Energy, Boston University6
 Christian Hogrefe合作论文数Center for Environmental Measurement and Modeling, Office of Research and Development, Environmental Protection Agency6
 Deborah Balk合作论文数Center for International Earth Science;Columbia University;Center for International Earth Science, Columbia University6
 Ruth DeFries合作论文数Department of Ecology, Evolution, and Environmental Biology, Climate School, Columbia University;Earth Institute, Columbia University6
 Kevin Civerolo合作论文数6
 Shojaeddin Chenouri合作论文数Department of Statistics and Actuarial Science, University of Waterloo6
 Michael S. Steckler合作论文数Lamont-Doherty Earth Observatory, Columbia Climate School, Columbia University6
 Dhiman R Mondal合作论文数Haystack Observatory, Massachusetts Institute of Technology5
 Greg Yetman合作论文数5
 Kim Knowlton合作论文数Department of Environmental Health Sciences, Columbia University Mailman School of Public Health5
 Cynthia Rosenzweig合作论文数Goddard Institute for Space Studies, National Aeronautics and Space Administration;Center for Climate Systems Research, Columbia Climate School;Department of Environmental Science, Barnard College5Richard Goldberg合作论文数5
 Francesca Pozzi合作论文数Istituto Tecnologie Didattiche, CNR5
 Pinki Mondal合作论文数Department of Geography, University of Florida5
 Gillian Galford合作论文数5
 Reinaldo Paul Pérez Machado合作论文数5William D. Solecki合作论文数Florida State University5
 Andy Yaw Kwarteng合作论文数Remote Sensing Group, Kuwait Institute for Scientific Research5
 Suzanne M. Carbotte合作论文数Lamont-Doherty Earth Observatory, Columbia University;Columbia Climate School, Columbia University5Jennifer Cox合作论文数4
 Joel E. Cohen合作论文数Laboratory of Populations, The Rockefeller University;Department of Earth and Environmental Sciences, Columbia University4
 Son V. Nghiem合作论文数Jet Propulsion Laboratory, California Institute of Technology4Ernesto Rodriguez合作论文数Jet Propulsion Laboratory, California Institute of Technology4
 William B. F. Ryan合作论文数Lamont-Doherty Earth Observatory, Columbia Climate School, Columbia University in the City of New York4Jeffrey K. Weissel合作论文数4
 Paul C. Sutton合作论文数Department of Geography and the Environment, College of Natural Sciences and Mathematics, University of Denver4
 Syed Humayun Akhter合作论文数Department of Geology, University of Dhaka4
 Ligia Vizeu Barrozo合作论文数4J.-Y. Ku合作论文数3william f haxby合作论文数3Charles Oliveri合作论文数3
 Kazi Matin Ahmed合作论文数3
 Colin Megill合作论文数3
 Carol A. Wilson合作论文数Department of Geology and Geophysics, Louisiana State University, Baton Rouge, LA 70803, USA3
 Md. Bodruddoza Mia合作论文数Geology University of Dhaka3
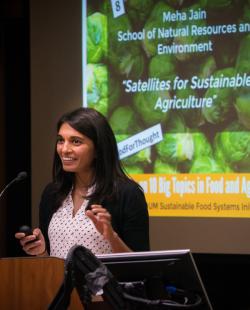 Meha Jain合作论文数School for Environment and Sustainability, University of Michigan-Ann Arbor3
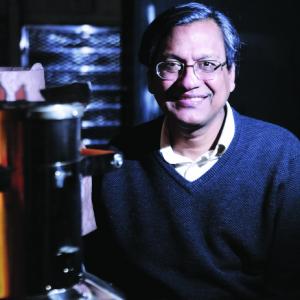 Vijay Modi合作论文数Department of Earth and Environmental Engineering, Fu Foundation School of Engineering and Applied Science, Columbia University3
 Lex Van Geen合作论文数Department of Earth and Environmental Sciences, Columbia University;Geochemistry Division, Lamont-Doherty Earth Observatory, Columbia University3
 Zuoqi Chen合作论文数Key Laboratory of Geographic Information Science, East China Normal University;c;Key Laboratory of Geographic Information Science, East China Normal University3
 Roger Buck合作论文数Lamont-Doherty Earth Observatory, Columbia University in New York City3
 Mark R Montgomery合作论文数Department of Pharmacology, University of Minnesota3
 Leonardo Seeber合作论文数3
 Gregory A Neumann合作论文数NASA Goddard Space Flight Center3Andrea Taramelli合作论文数Lamont Doherty Earth Observatory, Columbia University3Kimberly E. Baugh合作论文数3




