Remotely sensed Earth science information (ESI) has become increasingly central to addressing global challenges, yet its societal value, i.e., the difference ESI makes in real-world decisions and outcomes, is rarely quantified. In this study, we systematically map peer-reviewed literature that explicitly assesses the societal value of ESI across instrumental, intrinsic, and relational value types, and the diversity of approaches used to assess those values. Drawing from 13,823 publications across Scopus, Web of Science, and a curated library of ESI valuation studies, we identify 171 studies that applied ESI in a decision context and used a valuation method to compare outcomes with and without ESI. The majority of these studies employed decision analysis methods (e.g., Value of Information, Cost-Benefit Analysis), focusing primarily on quantitative instrumental values (e.g., profit, crop yield, lives saved), particularly in agricultural contexts. A smaller set of studies applied preference elicitation methods (e.g., stated preference, surveys, interviews, focus groups) to capture qualitative benefits and relational values including quality of life improvements, empowerment, and procedural justice. Many excluded studies demonstrated scientific value of ESI but did not explicitly translate that into societal value, revealing the need for a more systematic approach to ESI valuation. By promoting a more inclusive, interdisciplinary, and flexible portfolio of valuation methods, we aim to expand our understanding of the societal benefits of ESI to help guide investment in future missions, enhance public support, and ensure that science and policy goals are well aligned.
Increased awareness of human-nature interconnectedness could, according to recent global syntheses, transform the dominant unsustainable systems that threaten our shared future on this planet. We collected and synthesized evidence from the interdisciplinary body of literature on how humans perceive their interconnectedness using a systematic search and thematic coding. Our findings provide three practical additions to the literature and the science-policy interface. First, our typology of six types of interconnectedness lends structure to the interconnectedness concept. It provides an intelligible, operationalizable core of a definition that can serve as goal and guide for efforts to increase interconnectedness. Second, the wide-ranging list of benefits and associations we found can aid practitioners and researchers to understand how diverse the benefits of interconnectedness can be; this may help to broaden coalitions and build support behind the recommended practices of working to increase perceptions of interconnectedness. Finally, our Perception of Interconnectedness Toolkit compiles diverse methods that researchers have used to measure perception of interconnectedness; it provides a menu of options for researchers to adapt to their research goals and contexts. This selection of repeatable methods can help practitioners and researchers to monitor and understand current perceptions of interconnectedness, and whether and how actions (e.g., interventions) may change those perceptions.
Perennial grasslands are essential in supporting global food systems. Different grassland use types, such as hay, pasture, or idle grasslands, are important to differentiate on the landscape because they serve distinct production and ecological goals. However, available spatial agricultural datasets have shortcomings that prevent accurate tracking of grassland use trends in the Northeastern U.S. We employ a machine learning method to map grassland use in the U.S. state of Vermont. We combined high-resolution imagery (National Agriculture Imagery Program; NAIP) and time series of vegetation phenology and structure (Sentinel-2 and Sentinel-1) to build a machine learning model that classifies land as cultivated crops, hay, pasture, or idle (fallowed or minimally managed grasslands). Our model, the Vermont Cultivated Crops, Hay, and Pasture Dataset (VT CHPD) was robustly trained and tested on 12,500 reference points. We evaluate the VT CHPD via 1) accuracy of model predictions, 2) importance of NAIP, Sentinel-2 Normalized Difference Vegetation Index (NDVI), and Sentinel-1 Radar Vegetation Index (RVI) for grassland use classification, and 3) comparison of dataset estimates to existing data products. The VT CHPD demonstrates a high overall accuracy of 90% and high accuracy in identifying cultivated crops, hay, pasture, and idle land, with the greatest variable importance from Sentinel-2 NDVI. Our dataset has high agreement of cropland and hayland cover with the survey-based U.S. Census of Agriculture at the county-level, and thus overcomes a persistent challenge of the overestimation of hay cover common in currently available datasets. The VT CHPD improves our knowledge of agricultural land use in the state of Vermont through the identification and quantification of idle agricultural grasslands, which comprise 26.7% of agricultural area in the state. This finding has implications for the future agricultural production capacity of Vermont and, in particular, places priority on tracking the status and use of these idle grasslands in conjunction with other productive agricultural grassland uses.
Understanding and accurately predicting soil organic carbon (SOC) stocks in agricultural lands play a vital role in mitigating climate and sustainable land management. However, existing studies often lack high-resolution SOC stock maps at regional scales, limiting their applicability for site-specific land management. This research provides a novel and comprehensive framework for generating high-resolution (10-m) SOC stock maps of agricultural lands in Vermont, USA-one of the first efforts of its kind in a temperate, data-scarce region-using digital soil mapping (DSM). We compiled 361 topsoil samples (0 to 30 cm depth) and then applied Cubist, kNN (k-Nearest Neighbors), and RF (Random Forest) machine learning (ML) algorithms to predict SOC stocks (t ha-1) using environmental variables including climate, terrain, remote sensing, and soil characteristics. Prior to modeling, we used the Boruta algorithm to identify significant variables for SOC stock. Model performance was assessed using cross-validation (70% training and 30% validation). Validation parameters indicated that the RF ML algorithm outperformed others in predictive accuracy. Dynamic variables, including climate and biota, were the most influential variables in defining SOC distribution, while static variables, like terrain attributes and soil properties, were less influential. Spatial prediction maps revealed high SOC stocks in the northeastern part of Vermont, where there is high precipitation and elevation. The study also includes novel spatial uncertainty quantification across different land use types, offering practical insights into prediction confidence and C incentive targeting. Uncertainty in SOC stock prediction accuracy ranged from approximately 3.35 % to 3.63 %, with mean SOC stock values of 94.3 +/- 3.42 (t ha-1) for crops, 100.0 +/- 3.35 (t ha-1) for hay, and 96.1 +/- 3.30 (t ha-1) for pasture. Our findings provide a foundational SOC stock map for Vermont's agricultural lands, revealing key spatial distribution and drivers. The strong influence of climate variables suggests that adaptation strategies should account for regional climatic conditions, and incentives for soil C sequestration should be location specific. This research enhances the capacity to make soil carbon-informed agricultural management decisions aimed at mitigating the impacts of climate change, while also highlighting the need for further research to overcome the limitations of current SOC mapping approaches in Vermont and similar temperate agricultural regions worldwide.
Soil organic carbon (SOC) is critical for sustaining agricultural productivity, enhancing resilience to climate change, and supporting ecosystem functions, particularly in fragile regions facing increasing aridity like Patagonia. Knowledge of SOC is often represented by decades old, coarse-scale maps or sparse data, limiting its utility for land managers and policymakers. This study leverages a novel SOC database (1,724 samples) integrated with remote sensing and spatial variables in a machine learning model to produce high-resolution (30 m) SOC data that captures decision-relevant scales of variability across diverse land covers and uses. Results revealed that Random Forest modelling performed best in the NW Patagonian mountainous region. Feature selection procedures identified soil depth, spectral indices, and climatic factors such as evapotranspiration and aridity as important co-variates. We found significant heterogeneity in SOC distribution, ranging from the greatest SOC concentration in Nothofagus pumilio forests (132.4 +/- 19.2 t ha-1 at 0-30 cm depth), to the lowest in the grasslands of the Monte ecoregion (27.6 +/- 8.0 t ha-1). Due to landmass size, the grasslands of the Steppe ecoregion have the most carbon (276.5 million tons), followed by Nothofagus pumilio forests (103.7 million tons). These SOC (t ha-1) estimates agree with other studies, showing little difference for forests (10 %) and grasslands (14 %). The resulting maps of this study provide a critical baseline for evaluating SOC distribution, informing land management strategies, and guiding future climate resilience efforts in Patagonia and other similarly vulnerable regions across the globe.
Understanding carbon dynamics in Earth’s ecosystem is necessary for mitigating climate change. With recent advancements in technologies, it is important to understand both how carbon quantification in soil and vegetation is measured and how it can be improved. Therefore, this study conducted a bibliometric and bibliographic review of the most common carbon quantification methodologies. Among the most widely used techniques, the Walkley-Black method and Elemental Analysis stand out for measuring below-ground carbon, while forest inventories are prominent for assessing above-ground carbon. Additionally, we found that the United States and China have the largest number of publications on this topic, with forest and agricultural areas being the most studied, followed by grasslands and mangroves. However, it should be noted that despite being indirect techniques, remote sensing, regression analysis, and machine learning have increasingly been used to generate geo-environmental carbon models for various areas. Landsat satellite images are the most widely used in remote sensing, followed by LiDAR digital models. These results demonstrate that while new technologies do yet not replace analytical techniques, they are valuable allies working in conjunction with the current carbon quantification process.
With rising global temperatures come greater temperature and precipitation variability, contributing to more frequent and severe climate hazards that can upend lives and displace families. Lower-income households are often disproportionately impacted, so it is important to understand how climate hazards influence human migration patterns across income levels. There has been limited research on climate migration within the United States (US), particularly with respect to its economic impacts, like the associated transfer of household resources and incomes, or “income migration.” Here, we investigate spatial and temporal patterns of US domestic migration across income brackets between 2011 and 2021. We then investigate the role of climate hazards in shaping migration and income migration across US counties using panel data for the years 1995–2021. We found that lower-income households moved at higher rates overall but had less net migration across state lines, while higher-income households moved in a more directed fashion towards the most popular migration destinations. We also found an uptick in migration and income migration after the onset of the COVID-19 pandemic, particularly among higher income brackets. Property damage from climate hazards had small but significant relationships with migration. More destructive hurricanes were associated with reduced net migration and income migration nationally and in the South and Northeast. Flood damage was associated with reduced net income migration (greater outflow and/or reduced inflow of aggregate household income from migration) but had minimal effects on net migration overall, suggesting higher-income households (whose moves have a larger impact on net income migration) may be more likely to leave or avoid counties impacted by flooding. This work provides valuable new insights on the roles of both climate hazards and income levels in shaping domestic migration.
An adventurous ecologist, Cheryl Ann Palm brought together agriculture, forest and social science experts and pioneered interdisciplinary approaches to reduce deforestation and enhance food security.
Abstract Ecosystem change can profoundly affect human well‐being and health, including through changes in exposure to vector‐borne diseases. Deforestation has increased human exposure to mosquito vectors and malaria risk in Africa, but there is little understanding of how socioeconomic and ecological factors influence the relationship between deforestation and malaria risk. We examined these interrelationships in six sub‐Saharan African countries using demographic and health survey data linked to remotely sensed environmental variables for 11,746 children under 5 years old. We found that the relationship between deforestation and malaria prevalence varies by wealth levels. Deforestation is associated with increased malaria prevalence in the poorest households, but there was not significantly increased malaria prevalence in the richest households, suggesting that deforestation has disproportionate negative health impacts on the poor. In poorer households, malaria prevalence was 27%–33% larger for one standard deviation increase in deforestation across urban and rural populations. Deforestation is also associated with increased malaria prevalence in regions where Anopheles gambiae and Anopheles funestus are dominant vectors, but not in areas of Anopheles arabiensis. These findings indicate that deforestation is an important driver of malaria risk among the world's most vulnerable children, and its impact depends critically on often‐overlooked social and biological factors. An in‐depth understanding of the links between ecosystems and human health is crucial in designing conservation policies that benefit people and the environment.
While publicly-available datasets often document how much fossil fuel is extracted within oil-producing countries, they do not generally indicate who is responsible. To address this gap, we constructed the Global Oil and Gas Extraction Network, a dataset containing the extraction sites of the 26 largest oil and gas companies, and the quantities extracted annually from 2014 to 2018, accounting for 67% of total production. Using this dataset, we present a first-of-its-kind network analysis of global oil and gas extraction. We find fifty-eight percent of operations involved joint ownership across companies, demonstrating growing interdependence after industry-wide losses in 2016. Countries in which National Oil Companies (NOCs) were active were less likely to host Hybrid state-investor companies, and even less likely to host Investor-Owned Companies (IOCs), while certain Hybrids and IOCs tended to operate in the same countries; both trends became more pronounced between 2014 and 2018. Reflecting colonial legacies, the seven Big Oil companies, headquartered in either the US or Europe, extracted oil and gas from the most countries. These findings reveal a complex global network of strategically aligned actors, indicative of tacit and explicit transnational industry-state collusion to obstruct climate policies. These findings additionally underscore the need for comprehensive data to support a managed fossil fuel phaseout.
Crop switching, in which farmers grow a crop that is novel to a given field, can help agricultural systems adapt to changing environmental, cultural, and market forces. Yet while regional crop production trends receive significant attention, relatively little is known about the local-scale crop switching that underlies these macrotrends. We characterized local crop-switching patterns across the United States using the US Department of Agriculture (USDA) Cropland Data Layer, an annual time series of high resolution (30 m pixel size) remote-sensed cropland data from 2008 to 2022. We found that at multiple spatial scales, crop switching was most common in sparsely cultivated landscapes and in landscapes with high crop diversity, whereas it was low in homogeneous, highly agricultural areas such as the Midwestern corn belt, suggesting a number of potential social and economic mechanisms influencing farmers’ crop choices. Crop-switching rates were high overall, occurring on more than 6% of all US cropland in the average year. Applying a framework that classified crop switches based on their temporal novelty (crop introduction versus discontinuation), spatial novelty (locally divergent versus convergent switching), and categorical novelty (transformative versus incremental switching), we found distinct spatial patterns for these three novelty dimensions, indicating a dynamic and multifaceted set of cropping changes across US farms. Collectively, these results suggest that innovation through crop switching is playing out very differently in various parts of the country, with potentially significant implications for the resilience of agricultural systems to changes in climate and other systemic trends.
Mangrove forests provide a range of ecosystem services but may be increasingly threatened by climate change in the North Atlantic due to high-intensity storms. Hurricane Irma (Category 5) hit the northern coast of Cuba in September 2017, causing widespread damage to mangroves; losses have not yet been extensively documented due to financial and logistical constraints for local scientists. Our team estimated Irma’s impacts on Cuban ecosystems in a coastal and upland study area spanning over 1.7 million ha. We developed a multi-resolution time series “vegetation anomaly” approach, where post-disturbance observations in photosynthetically active vegetation (Enhanced Vegetation Index, EVI) were normalized to the reference period (dry season mean over a historical time series). The Hurricane Disturbance Vegetation Anomaly (HDVA) was used to estimate the extent, severity, and temporal patterns of ecological changes with Sentinel-2 and MODIS data and used vicarious validation with microsatellite interpretation (Planet). HDVA values were classed to convey qualitative labels useful for local scientists: (1) Catastrophic, (2) Severe, (3) Moderate, (4) Mild, and (5) No Loss. Sentinel-2 had a limited reference period (2015–2017) compared to MODIS (2000–2017), yet the HDVA patterns were similar. Mangrove and wetlands (>265,000 ha) sustained widespread damages, with a staggering 78% showing damage, largely severe to catastrophic (0–0.81 HDVA; >207,000 ha). The damaged area is 24 times greater than impacts from Irma as documented elsewhere. Caguanes National Park (>8400 ha, excluding marine zones) experienced concentrated, severe mangrove and wetland damages (nearly 4000 ha). The phenological declines from Irma’s impacts took up to 17 months to fully actualize, a much longer period than previously suggested. In contrast, dry forests saw rapid green flushes post-hurricane. With the increase of high-intensity storm events and other threats to ecosystems, the HDVA methods outlined here can be used to assess intense to low-level damages.
We evaluated how the spatial resolution of environmental variables (n = 47) altered their ability to predict soil organic carbon (SOC) stocks (0-30 cm depth) using training data from Gridded Soil Survey GeographicgSSURGO and SoilGrids databases. Training and validation subsamples (1,629) were selected using a conditioned Latin hypercube sampling (cLHS) design based on environmental variables in Vermont, U.S. The predictive relationships between environmental variables and SOC stock (t C ha-1) were developed using machine learning algorithms. The algorithms were trained (70 %) and evaluated (30 %) using a random subset of database subsamples, respectively, with an additional evaluation step using local, independent SOC reference data (n = 272). The Random Forest (RF) algorithm outperformed other algorithms at all spatial resolutions in estimating SOC stocks. As spatial resolution increased, model performance with the gSSURGO database increased (R2 = 0.33-0.62 and RMSE = 42.42-34.92), while no such trend was observed for the SoilGrids database. The best SOC stock model prediction using the SoilGrids database was achieved with a 10 m resolution (R2 = 0.54 and RMSE = 4.67). Evaluation of modeled results using the external, or independent, reference data showed a significant decrease compared to the internal validation in prediction accuracy (R2 = 0.11-0.14 for gSSURGO and, R2 = -0.19 for SoilGrids). The gSSURGO database showed that soil maps (including suborders, drainage classes, temperature, and moisture) and geology/landform maps had a greater influence than other environmental variables at all spatial resolution scales. In contrast, climatic- and DEM-related variables were more significant for the SoilGrids database. Our study suggested that the origin of the SOC stock database and the sampling scheme largely affects the importance of environmental variables assigned in the machine learning algorithm. Our results confirmed that the variable and data sources, model type, and combination of environmental variables significantly influenced prediction accuracy. In conclusion, DSM products should be re-evaluated with local references when used for spatial extents that are different from those for which they were initially designed.
Transitioning to more sustainable agricultural practices is a key goal in agroecology. Before practices are adopted, however, farmers must weigh a complex set of biophysical and socioeconomic tradeoffs. Tarping is a weed control practice gaining popularity in New England, but many of its biophysical impacts remain unclear to farmers. Here, we used participatory action research to engage in mutual learning with farmers around the tradeoffs of tarping for weed control. We collected quantitative biophysical data with a field study and qualitative data on biophysical and socioeconomic factors by interviewing farmers. We found tarping has a number of benefits, challenges, and uncertainties, though most farmers had positive overall perceptions of the practice. Many of our biophysical results matched farmers' experiences, including that tarping dramatically heated soils, suppressed weeds, and increased crop yields. However, our mixed results for the effects of tarping on soil nitrate contrasted farmers' perception that tarping increases soil nitrate availability. Engaging in participatory and mixed methods research was an effective approach to unveil complex tradeoffs around tarping and ensure our research was relevant to farmer interests. Future research on long-term effects of tarps will be valuable to inform the sustainability of this practice.
Agricultural tarping, the practice of placing impermeable plastic tarps over crop beds before planting to suppress weeds, is rising in popularity. However, the use of tarps has uncertain effects on soil arthropod communities. We studied the impact of silage (black plastic) tarps and clear plastic tarps on surface-active and soil-dwelling arthropods by tracking immediate impacts and arthropod recovery for 5 weeks after tarps were removed. We also assessed how well environmental and experimental variables explained arthropod diversity and composition. During tarp application, we found that both silage and clear plastic tarps had significant negative impacts on surface-active arthropod diversity, while only clear plastic tarps impacted soil-dwelling arthropods. Surface-active arthropod diversity recovered by 1–3 weeks after tarping, but at 5 weeks after tarping soil-dwelling arthropod diversity was significantly lower in silage tarp and clear plastic plots than control plots. Tarps also led to compositional changes in the arthropod communities, though these changes were only significant during tarp cover. The variables that best explained arthropod diversity and community composition were treatment (i.e., silage tarp, clear plastic tarp, or control) and farm site. Other variables, such as soil moisture and weed coverage, were not consistently strong model predictors. These results imply that tarps may have temporary impacts on surface-active arthropods but potentially longer-lasting impacts on soil-dwelling arthropods. Continuing to monitor impacts of tarps on soil arthropods will better inform the sustainability of this practice.
Mapping tools that characterize environmental inequities and health disparities have shown to be an effective approach to facilitate environmental decision making at the state level. We developed the Vermont Environmental Disparity Index (VTEDI) to measure the cumulative impacts of environmental risk, social vulnerability, and health risk in the Vermont communities. In addition to exploring regions with high cumulative impacts, we conducted a Bayesian analysis, using weights of evidence, to understand the probabilistic association of poverty, populations on food stamps, race, and limited English proficiency (LEP) with exposure to multiple environmental risks. The results show that census tracts with high racial diversity and LEP residents are significantly associated with greater environmental risks, while poverty and food stamp use have weaker associations with exposure to environmental risks. The results demonstrate that environmental risks are significantly higher in communities of color and neighborhoods with more LEP residents than in lower income communities. The VTEDI is an effective tool in local environmental governance to explore cumulative environmental justice issues and to make informed decisions to redress environmental injustice.
Abstract Invasive plant species contribute to alteration of ecosystem functioning, reduction of native diversity, and have negative effects on numerous ecosystem services. Increases in anthropogenic regional connectivity is effectively intensifying establishment of self-sustaining populations of invasive plants around the globe. However, some ecosystems are disproportionately susceptible to incoming species. In this study, we used a recently compiled global data set of invasive plant distributions to calculate exotic fraction and estimate regional invasibility on a global scale. We found islands in Australasia to have the highest potential for future plant invasions. An appropriate invasibility metric, as the one developed here, has been largely lacking from invasive species studies despite its potential to guide effective, pre-emptive strategies for invasion prevention. We suggest that this tool is used as an efficient method to determine regions of greatest priority and opportunity for successful mitigation of threats from invasion.
As global climate change progresses, the United States (US) is expected to experience warmer temperatures as well as more frequent and severe extreme weather events, including heat waves, hurricanes, and wildfires. Each year, these events cost dozens of lives and do billions of dollars' worth of damage, but there has been limited research on how they influence human decisions about migration. Are people moving toward or away from areas most at risk from these climate threats? Here, we examine recent (2010–2020) trends in human migration across the US in relation to features of the natural landscape and climate, as well as frequencies of various natural hazards. Controlling for socioeconomic and environmental factors, we found that people have moved away from areas most affected by heat waves and hurricanes, but toward areas most affected by wildfires. This relationship may suggest that, for many, the dangers of wildfires do not yet outweigh the perceived benefits of life in fire-prone areas. We also found that people have been moving toward metropolitan areas with relatively hot summers, a dangerous public health trend if mean and maximum temperatures continue to rise, as projected in most climate scenarios. These results have implications for policymakers and planners as they prepare strategies to mitigate climate change and natural hazards in areas attracting migrants.
 Ruth DeFries合作论文数Department of Ecology, Evolution, and Environmental Biology, Climate School, Columbia University;Earth Institute, Columbia University15
 Pinki Mondal合作论文数Department of Geography, University of Florida12
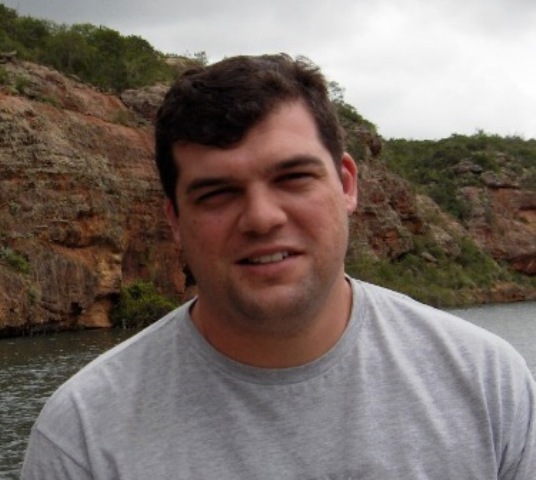 Carlos Eduardo Pellegrino Cerri合作论文数Escola Superior de Agricultura Luiz de Queiroz, Universidade de Sao Paulo11
 Julie Nash合作论文数CGIAR Res Program Climate Change Agr & Food Secur, Univ Vermont10
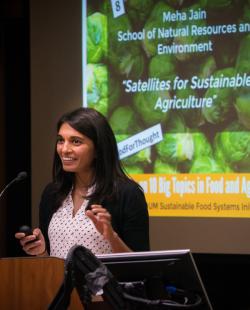 Meha Jain合作论文数School for Environment and Sustainability, University of Michigan-Ann Arbor10
 Taylor Ricketts合作论文数Rubenstein School of Environment and Natural Resources, University of Vermont;Gund Institute for Environment, University of Vermont9
 John Mustard合作论文数Department of Earth, Environmental & Planetary Sciences, Brown University9
 Jerry M. Melillo合作论文数The Ecosystems Center, Marine Biological Laboratory, University of Chicago8
 Eva Kinnebrew合作论文数Gund Institute for Environment, University of Vermont6
 Michael Coe合作论文数The Woods Hole Research Center;Center for Sustainability and the Global Environment Institute for Environmental Studies6
 Louis Bockel合作论文数5Gillian Pirolli合作论文数5
 Uwe Grewer合作论文数5
 Laura Sonter合作论文数Centre for Biodiversity and Conservation Science, Faculty of Science, The University of Queensland5
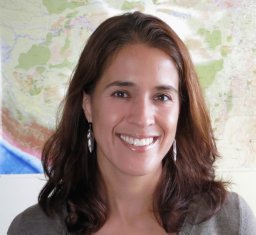 Marcia N. Macedo合作论文数Department of Ecology, Evolution, and Environmental Biology, Columbia University;Department of Ecology, Evolution, and Environmental Biology, Columbia University5
 Deborah A. Neher合作论文数Department of Plant and Soil Science, College of Agriculture and Life Sciences, University of Vermont5
 Christopher Small合作论文数Lamont-Doherty Earth Observatory, Columbia University5
 Carlos Clemente Cerri合作论文数Centro de Energia Nuclear Na Agricultura, Universidade de São Paulo5
 Ephraim Nkonya合作论文数International Food Policy Research Institute5J. Wyngaard合作论文数4Ram Fishman合作论文数Tel Aviv University4
 Mojtaba Zeraatpisheh合作论文数Rubenstein Sch Environm & Nat Resources, Univ Vermont4Keri B. Watson合作论文数Gund Inst Environm, Univ Vermont4Sonya Ahamed合作论文数Department of Civil, Environmental, and Geospatial Engineering, Michigan Technological University4
 Rebecca Chaplin-Kramer合作论文数Woods Institute for the Environment, Stanford University;Woods Institute for the Environment, Stanford University4
 Christopher Neill合作论文数The Ecosystems Center, Marine Biological Laboratory, Woods Hole, MA 02543, USA4Noel P. Gurwick合作论文数4
 Eva Wollenberg合作论文数Center for International;Forestry Research;Center for International|Forestry Research4
 David W. Kicklighter合作论文数Ecosystems Center;Marine Biological Laboratory;Ecosystems Center|Marine Biological Laboratory4Elizabeth Palchak合作论文数3
 Julianna White合作论文数3
 Lindsay (Bar) Barbieri合作论文数Rubenstein Sch Environm & Nat Resources, Univ Vermont3
 Shahid Naeem合作论文数Earth Institute Center for Environmental Sustainability, Columbia University;Department of Ecology, Evolution, and Environmental Biology, Columbia University;School of Professional Studies, Columbia University3
 González-Díaz Patricia合作论文数Center of Marine Research, University of La Habana3
 Eric A. Davidson合作论文数Appalachian Laboratory, University of Maryland Center for Environmental Science3
 O'Connell Christine合作论文数3
 Rachelle K Gould合作论文数Emmett Interdisciplinary Program in Environment &Resources and Center for Conservation Biology, Stanford University;Emmett Interdisciplinary Program in Environment & Resources and Center for Conservation Biology, Stanford University3
 Heather Darby合作论文数3
 Jennie C. Stephens合作论文数College of Social Sciences and Humanities, Northeastern University3
 Gregory Fiske合作论文数Woods Hole Research Center3
 Kate Brauman合作论文数Inst Environm, Univ Minnesota3
 Kimberly F. Wallin合作论文数Department of Entomology;University of Wisconsin-Madison Madison;Department of Entomology, University of Wisconsin-Madison Madison3
 Tim Cronin合作论文数Department of Earth, Atmospheric, and Planetary Sciences, Massachusetts Institute of Technology3
 Donna M. Rizzo合作论文数3
 Kathijo Jankowski合作论文数University of Michigan Biological Station3Darlisson Nunes合作论文数2Britaldo Soares Filho合作论文数2
 Victor Izzo合作论文数2
 Paul Lefebvre合作论文数2




