Supplementary Figure S21 shows Venn diagrams of CNV-confirmed cancer cells and their coexpression of DLL3, SEZ6, B7H3 for tumors in Cohort C.
Supplementary Figure S24 shows the distribution of DLL3 positive cells based on cell type for Cohort B and patient 37.
Supplementary Figure S17 shows graphs of CD4+ T cells phenotypic profiles for memory, activation and exhaustion.
Supplementary Figure S5 shows single-cell transcriptional landscape of SCLC tumor biopsies and CNV for Cohort B.
Supplementary Figure S2 shows the CTC-iCHIP workflow and images of staining optimization using control cancer cell lines.
Supplementary Figure S9 shows that the fraction of DLL3-positive tumor cells does not significantly correlate with the distribution of SCLC molecular subtypes in primary tumors across cohorts.
Supplementary Figure S8 shows fraction of DLL3 negative tumor cells based on single-cell RNA-seq “drop out” of rare transcripts.
Supplementary Figure S12 shows isoform characterization of DLL3 including protein structure, expression and isoform profiles for specific patients.
Supplementary Table S1 shows patient demographics and clinical characteristics for Cohort A.
Supplementary Figure S4 shows the size distribution of the CTCs based on their marker expression profiles.
Supplementary Figure S16 shows CD4+ T cells phenotypic profiling for individual markers in control sample HD2.
Markers of T-cell dysfunction in patients with acquired tarlatamab resistance despite persistent DLL3 expression. A, Box plot representing flow cytometric analysis of PBMCs showing the percentage of CD8+ (left) or CD4+ (right) live T cells. Blood specimens analyzed from healthy donors (HD: gray, N = 3), tarlatamab-untreated advanced SCLC (Pre-Tx: orange, N = 5), SCLC cases at the time of tarlatamab response (Resp.: blue, N = 4), and patients with SCLC with acquired resistance to tarlatamab despite persistent DLL3 expression in CTCs (Prog.: red, N = 2, open circles denote two distinct measurements from one case). For A–E and G–I, multiple measurements from a single patient (where available) were averaged for statistical comparison using the Student unpaired t test between Resp. vs. Prog. groups. B, Percentage of central memory (CM) CD8+ T cells (phenotype: CD45RA−CCR7+CD28+) versus effector memory subtype 1 (EM1) CD8+ T cells (phenotype: CD45RA−CCR7−CD28+). C, Percentage of KLRG1+ cells within activated (PD-1+) CD8+ T cells. D, Percentage of GZMB+ cells within activated (PD-1+) CD8+ T cells. E, Percentage of CD39+ cells within activated (PD-1+) CD8+ T cells. F, Percentage of GZMB+ cells within PD-1+CD8+ T cells, with and without CD39 expression, across all SCLC samples. Statistical comparison between CD39+ (dark red) and CD39− (gray) cells was done using the Student paired t test (N = 9 SCLC cases, including Pre-Tx, Resp., and Prog.). Samples with fewer than 50 recorded T cells in either the CD39+ or the CD39− group were excluded. G, Percentage of PD-1+ cells within total CD8+ T cells. H, Percentage of TIM3+ cells within activated (PD-1+) CD8+ T cells. I, Percentage of TOX+ cells within activated (PD-1+) CD8+ T cells.
Supplementary Figure S19 shows Venn diagrams of CNV-confirmed cancer cells and their coexpression of DLL3, SEZ6, B7H3 for tumors in Cohort B.
Differential CTC expression of DLL3 upon acquired resistance to tarlatamab. A, Representative case (patient 1) showing total CTC enumeration and DLL3 staining in a DLL3High patient with initial profound response to tarlatamab, whose CTCs show complete loss of expression of the targeted epitope at the time of acquired resistance and disease progression. CTC counts are normalized to 20 mL, with the percentage DLL3-positive (orange) versus DLL3-negative (green) shown for each time point during the course of treatment (arrowheads: tarlatamab cycles). B, Another representative tarlatamab-responsive DLL3High case (patient 8) in which increasing numbers of CTCs at the time of acquired drug resistance show universally persistent expression of the targeted DLL3 epitope. C, Relative fraction of DLL3Pos patients who initially benefited from tarlatamab (PR or SD), whose CTCs at the time of cancer progression are either above (positive) or below (low) the median 25% cutoff for DLL3 expression (N = 5).
Antibody-drug conjugates (ADCs) target surface proteins on cancer cells, leading to internalization and delivery of a drug payload, thereby enhancing selectivity and minimizing toxicity. ADCs against TROP2 (Sacituzumab govitecan) or HER2 (T-DXd) have demonstrated efficacy in metastatic breast cancer, yet paradoxically, outside of HER2-amplified breast cancers, expression levels of these breast cancer-enriched epitopes in tumor biopsies have not been strongly correlated with clinical response. We undertook serial quantitative imaging of circulating tumor cells (CTCs) in a prospective cohort of 35 patients treated with either of these ADCs. At the single-cell level, expression of TROP2 and HER2 within individual patients is highly heterogeneous in both CTCs and paired tumor biopsies. Measurement of these epitopes on CTCs immediately prior to ADC therapy does not predict depth of clinical response. However, absence of CTCs or >80% reduction in CTC numbers after three weeks of treatment (CTCLow) predicts durable response, compared with CTCHigh cases (TROP2: HR 5.15, P = 0.012; HER2: HR 6.01, P < 0.001). Targeted epitopes are not commonly downregulated on CTCs at the time of acquired clinical resistance, and switching between TROP2- and HER2-targeting ADCs sharing similar payloads infrequently leads to second-line response. Thus, while CTC burden is correlated with response to these ADCs, the level of TROP2 or HER2 expression is poorly predictive. These findings point to sensitivity to the drug payload as a potential driver of clinical response to currently approved ADCs in breast cancer.
Supplementary Figure S13 displays a gallery of CTFs in specific patient samples following the onset of tarlatamab therapy.
Supplementary Figure S16 shows CD4+ T cells phenotypic profiling for individual markers in control sample HD2.
 Shyamala Maheswaran合作论文数Harvard Medical School, Harvard University;Mass General Research Institute, Massachusetts General Hospital274
 Mehmet Toner合作论文数Center for Engineering in Medicine & Surgery, Massachusetts General Hospital;Harvard Medical School176
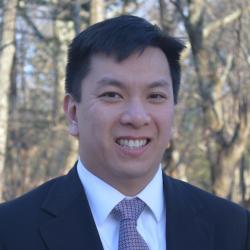 David T Ting合作论文数Krantz Family Center for Cancer Research, Massachusetts General Hospital;Harvard Medical School87
 Ben S. Wittner合作论文数Broad Institute of, Harvard;Cambridge Center;Broad Institute of, Harvard73
 Lecia Sequist合作论文数Cancer Early Detection and Diagnostics Clinic, Massachusetts General Hospital Cancer Center;Harvard Medical School;Dana-Farber Cancer Center68
 Michael S. Lawrence合作论文数Harvard Medical School;Lawrence Laboratory, Mass General Cancer Center, Massachusetts General Hospital62
 Jeff Settleman合作论文数Pfizer60
 Shannon Stott合作论文数Department of Biomedical Engineering, College of Engineering, Boston University58
 Sridhar Ramaswamy合作论文数Google Ventures58
 Daphne W. Bell合作论文数National Human Genome Research Institute, National Institutes of Health56
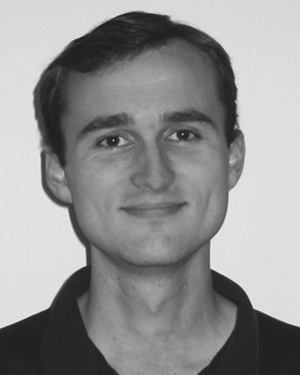 Jon F. Edd合作论文数Harvard Medical School and Shriners Hospital for Children, Massachusetts General Hospital56
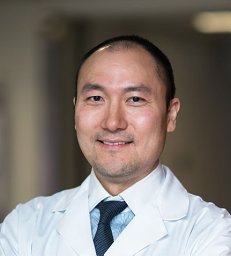 David Miyamoto合作论文数Massachusetts General Hospital Cancer Center, Harvard Medical School53
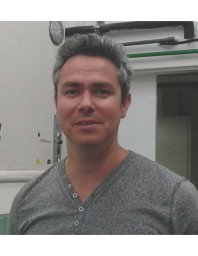 Moshe Sade-Feldman合作论文数Broad Institute of MIT and Harvard, Cambridge, MA, USA.48
 Anthony Iafrate合作论文数Department of Pathology, Massachusetts General Hospital Cancer Center;Harvard Medical School48
 Min Yu合作论文数University of Southern California45
 Sen Debattama R合作论文数Dana Farber Canc Inst, Dept Pediat Oncol, Boston, MA 02115 USA43
 Gainor Justin F合作论文数Massachusetts Gen Hosp, Boston, MA 02114 USA43
 Aditya Bardia合作论文数Dana-Farber/Harvard Cancer Center42Meador Catherine B合作论文数42Ravi Kapur合作论文数40Brannigan Brian W合作论文数35Dubash Taronish合作论文数35Lindsey E. Ulkus合作论文数34
 Ultan Mcdermott合作论文数Street31
 Toshi Shioda合作论文数30Patricia Greninger合作论文数Massachusetts General Hospital Cancer Center and Harvard Medical School30
 Miguel N. Rivera合作论文数Harvard Medical School, Harvard University29
 Dennis Sgroi合作论文数Harvard Medical School;Molecular Pathology Unit, Mass General Research Institute, Massachusetts General Hospital28Gromoslaw A. Smolen合作论文数27Richard Lee合作论文数Department of Medical Physics, British Columbia Cancer Agency24Douglas S. Micalizzi合作论文数Department of Obstetrics and Gynecology, University of Colorado School of Medicine23Sreenath V Sharma合作论文数22Sarah Javaid合作论文数22Joseph A LiCausi合作论文数20
 Nicola Aceto合作论文数Institute of Molecular Health Sciences, Department of Biology, Eidgenössische Technische Hochschule Zürich20Madden Marissa W合作论文数20Desai Rushil合作论文数19
 Leif Ellisen合作论文数Center for Cancer Research, Mass General Research Institute, Massachusetts General Hospital;Harvard Medical School19
 Jeffrey Engelman合作论文数Treeline Biosciences19
 Cyril H Benes合作论文数Massachusetts General Hospital Cancer Center and Harvard Medical School/Department of Medicine, Harvard Medical School19
 Kurt Julius Isselbacher合作论文数Harvard Medical School;Cancer Center, Massachusetts General Hospital19Raffaella Sordella合作论文数19Thomas J. Lynch合作论文数18Valentine Comaills合作论文数Cell Biology and Stem Cell Unit, Center for Cooperative Research in Biosciences, 48160 Derio Bizkaia, Spain18
 Risa Burr合作论文数18S Michael Rothenberg合作论文数17
 Mark Kalinich合作论文数Harvard Med Sch, Massachusetts Gen Hosp, Ctr Canc, Charlestown, MA 02129 USA17
 David N. Louis合作论文数Department of Pathology, Massachusetts General Hospital;Mass General Research Institute, Massachusetts General Hospital;Department of Pathology, Brigham and Women's Hospital;Harvard Medical School17




