Supplementary Figure S21 shows Venn diagrams of CNV-confirmed cancer cells and their coexpression of DLL3, SEZ6, B7H3 for tumors in Cohort C.
Supplementary Figure S24 shows the distribution of DLL3 positive cells based on cell type for Cohort B and patient 37.
Supplementary Figure S17 shows graphs of CD4+ T cells phenotypic profiles for memory, activation and exhaustion.
Supplementary Figure S5 shows single-cell transcriptional landscape of SCLC tumor biopsies and CNV for Cohort B.
Supplementary Figure S2 shows the CTC-iCHIP workflow and images of staining optimization using control cancer cell lines.
Supplementary Figure S9 shows that the fraction of DLL3-positive tumor cells does not significantly correlate with the distribution of SCLC molecular subtypes in primary tumors across cohorts.
Supplementary Figure S8 shows fraction of DLL3 negative tumor cells based on single-cell RNA-seq “drop out” of rare transcripts.
Supplementary Figure S12 shows isoform characterization of DLL3 including protein structure, expression and isoform profiles for specific patients.
The retinoblastoma protein (RB) is a well-characterized repressor of E2F transcriptional activity that controls genes involved in cell proliferation during the G1 phase. Here, we examine the effect of RB on chromatin organization and uncover a non-canonical role for RB in which it promotes the removal of cohesin from insulators and thereby induces the expression of adjacent genes. We identify that RB colocalizes with cohesin across the human genome. During mitosis, RB facilitates the removal of cohesin from CTCF sites, with this effect persisting into early G1, impacting loop formation and extrusion at topologically associating domain (TAD) boundaries. Chromosome conformation capture assays reveal that RB reduces insulation at TAD boundaries and promotes enhancer-promoter interactions marked by histone 3 lysine 27 acetylation. In this way, RB enhances the transcription of hundreds of genes beyond the E2F transcriptional program, a finding that expands our understanding of this key tumor suppressor and cell cycle regulator.
Supplementary Figure S4 shows the size distribution of the CTCs based on their marker expression profiles.
Supplementary Table S1 shows patient demographics and clinical characteristics for Cohort A.
Supplementary Figure S16 shows CD4+ T cells phenotypic profiling for individual markers in control sample HD2.
Markers of T-cell dysfunction in patients with acquired tarlatamab resistance despite persistent DLL3 expression. A, Box plot representing flow cytometric analysis of PBMCs showing the percentage of CD8+ (left) or CD4+ (right) live T cells. Blood specimens analyzed from healthy donors (HD: gray, N = 3), tarlatamab-untreated advanced SCLC (Pre-Tx: orange, N = 5), SCLC cases at the time of tarlatamab response (Resp.: blue, N = 4), and patients with SCLC with acquired resistance to tarlatamab despite persistent DLL3 expression in CTCs (Prog.: red, N = 2, open circles denote two distinct measurements from one case). For A–E and G–I, multiple measurements from a single patient (where available) were averaged for statistical comparison using the Student unpaired t test between Resp. vs. Prog. groups. B, Percentage of central memory (CM) CD8+ T cells (phenotype: CD45RA−CCR7+CD28+) versus effector memory subtype 1 (EM1) CD8+ T cells (phenotype: CD45RA−CCR7−CD28+). C, Percentage of KLRG1+ cells within activated (PD-1+) CD8+ T cells. D, Percentage of GZMB+ cells within activated (PD-1+) CD8+ T cells. E, Percentage of CD39+ cells within activated (PD-1+) CD8+ T cells. F, Percentage of GZMB+ cells within PD-1+CD8+ T cells, with and without CD39 expression, across all SCLC samples. Statistical comparison between CD39+ (dark red) and CD39− (gray) cells was done using the Student paired t test (N = 9 SCLC cases, including Pre-Tx, Resp., and Prog.). Samples with fewer than 50 recorded T cells in either the CD39+ or the CD39− group were excluded. G, Percentage of PD-1+ cells within total CD8+ T cells. H, Percentage of TIM3+ cells within activated (PD-1+) CD8+ T cells. I, Percentage of TOX+ cells within activated (PD-1+) CD8+ T cells.
Supplementary Figure S19 shows Venn diagrams of CNV-confirmed cancer cells and their coexpression of DLL3, SEZ6, B7H3 for tumors in Cohort B.
The establishment of distinct transcriptional states entails coordinated transcriptional coregulation of several functionally disparate biological processes (fd-BPs), involving thousands of genes scattered throughout the genome. Linear clustering of genes in a single BP is one strategy for their transcriptional coregulation. However, whether such gene clustering also plays a role in transcriptional coherence of several fd-BPs remains unexplored. Here, by analyzing the genomes of eukaryotes ranging from yeast to plants to humans, we find thousands of conserved and species-specific clustered fd-BP pairs, many of which are transcriptionally correlated in normal human tissues. Strikingly, our results reveal that often this system-level transcriptional coordination is achieved in part by the genic proximity of regulatory nodes of fd-BPs (such as transcription factors) whose coregulation drives the transcriptional coherence of their respective pathways. This, we hypothesize, is one strategy for creating coregulated, tunable modulons in eukaryotes.
Differential CTC expression of DLL3 upon acquired resistance to tarlatamab. A, Representative case (patient 1) showing total CTC enumeration and DLL3 staining in a DLL3High patient with initial profound response to tarlatamab, whose CTCs show complete loss of expression of the targeted epitope at the time of acquired resistance and disease progression. CTC counts are normalized to 20 mL, with the percentage DLL3-positive (orange) versus DLL3-negative (green) shown for each time point during the course of treatment (arrowheads: tarlatamab cycles). B, Another representative tarlatamab-responsive DLL3High case (patient 8) in which increasing numbers of CTCs at the time of acquired drug resistance show universally persistent expression of the targeted DLL3 epitope. C, Relative fraction of DLL3Pos patients who initially benefited from tarlatamab (PR or SD), whose CTCs at the time of cancer progression are either above (positive) or below (low) the median 25% cutoff for DLL3 expression (N = 5).
Supplementary Figure S13 displays a gallery of CTFs in specific patient samples following the onset of tarlatamab therapy.
 Gad A. Getz合作论文数Harvard Medical School;Department of Pathology, Massachusetts General Hospital;Broad Institute of Harvard and MIT145
 Stacey Gabriel合作论文数The Broad Institute of Harvard and Massachusetts Institute of Technology66
 Matthew L. Meyerson合作论文数Harvard Medical School;Center for Cancer Genomics, Dana-Farber Cancer Institute66
 Daniel Arie Haber合作论文数Harvard Medical School;Medicine-MGH Cancer Center, Massachusetts General Hospital62
 Shyamala Maheswaran合作论文数Harvard Medical School, Harvard University;Mass General Research Institute, Massachusetts General Hospital62
 Meador Catherine B合作论文数55
 Mehmet Toner合作论文数Center for Engineering in Medicine & Surgery, Massachusetts General Hospital;Harvard Medical School53
 Kristian Cibulskis合作论文数Genetic Analysis Platform, Broad Institute of MIT and Harvard52Gainor Justin F合作论文数Massachusetts Gen Hosp, Boston, MA 02114 USA51
 Moshe Sade-Feldman合作论文数Broad Institute of MIT and Harvard, Cambridge, MA, USA.46
 Scott L. Carter合作论文数Division of Medical Sciences, Harvard Medical School;Joint Center for Cancer Precision Medicine, Dana-Farber Cancer Institute;Harvard T.H. Chan School of Public Health45Carrie Sougnez合作论文数45
 Eric S. Lander合作论文数Department of Biology, Massachusetts Institute of Technology;Harvard Medical School;Broad Institute, Massachusetts Institute of Technology44
 Jon F. Edd合作论文数Harvard Medical School and Shriners Hospital for Children, Massachusetts General Hospital44
 Sen Debattama R合作论文数Dana Farber Canc Inst, Dept Pediat Oncol, Boston, MA 02115 USA42
 Todd R. Golub合作论文数Broad Institute;Dana-Farber Cancer Institute;Harvard Medical School41Gordon Saksena合作论文数40Petar Stojanov合作论文数Carnegie Mellon University40
 Levi Garraway合作论文数Roche;Genentech37
 Andrey Sivachenko合作论文数Broad Inst MIT & Harvard36
 Chip Stewart合作论文数Broad Inst34
 Jaegil Kim合作论文数Broad Institute of MIT and Harvard, Cambridge, Massachusetts.31
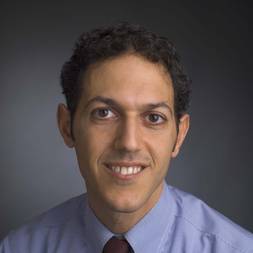 Rameen Beroukhim合作论文数Division of Medical Sciences, Harvard Medical School;Dana-Farber Cancer Institute31Adam Langenbucher合作论文数Harvard Med Sch, Massachusetts Gen Hosp, Canc Ctr, Boston, MA 02115 USA30Douglas Voet合作论文数29Daniel Auclair合作论文数28Alex H Ramos合作论文数Dept Med Oncol, Dana Farber Canc Inst28
 Cyril H Benes合作论文数Massachusetts General Hospital Cancer Center and Harvard Medical School/Department of Medicine, Harvard Medical School27Wendy Winckler合作论文数26
 Steven E Schumacher合作论文数Cancer Program, The Broad Institute of MIT and Harvard24Nicholas J. Dyson合作论文数24
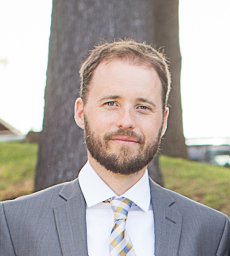 Aaron McKenna合作论文数The Broad Institute of MIT and Harvard, Cambridge, MA 02142;The Broad Institute of MIT and Harvard, Cambridge, MA 02142;23Robert C. Onofrio合作论文数22
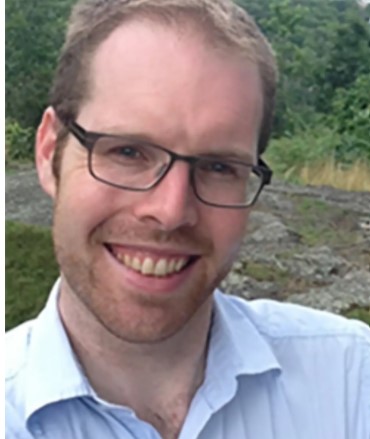 Trevor Pugh合作论文数Department of Medical Biophysics, Temerty Faculty of Medicine, University of Toronto;Princess Margaret Cancer Centre, University Health Network;Translational Genomics Laboratory, Ontario Institute for Cancer Research22
 William C. Hahn合作论文数Department of Medical Oncology, Dana-Farber Cancer Institute;Harvard Medical School;Broad Institute, MIT22
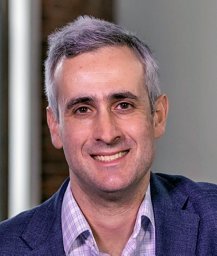 Jesse S. Boehm合作论文数The Broad Institute of MIT and Harvard, 7 Cambridge Center, Cambridge, MA 02142, USA22
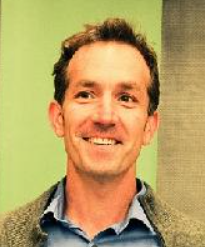 Joshua M Stuart合作论文数Baskin School of Engineering, University of California Santa Cruz;Genomics Institute, University of California Santa Cruz21
 Marcello Stanzione合作论文数Tech Univ Dresden, Fac Med, Inst Physiol Chem, Fetscherstr 74, D-01307 Dresden, Germany20
 Kwok-Kin Wong合作论文数Department of Medicine, Grossman School of Medicine, New York University20
 Wise Jillian F合作论文数Univ Texas MD Anderson Canc Ctr20David T. Myers合作论文数19
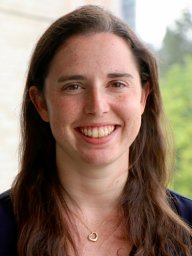 Rosenberg Mara合作论文数19Cho Juok合作论文数19
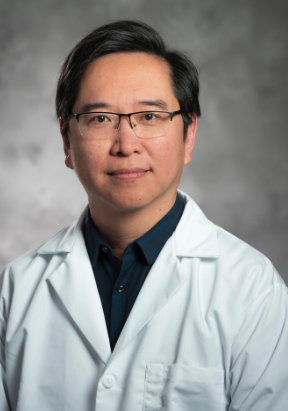 Lee Zou合作论文数Department of Pharmacology and Cancer Biology, School of Medicine, Duke University;Duke Cancer Institute, School of Medicine, Duke University19Lihua Zou合作论文数Vascular Biology Center, Medical College of Georgia19Wilhelm Haas合作论文数Department of Cell Biology, Harvard Medical School19Benjamin J Drapkin合作论文数18
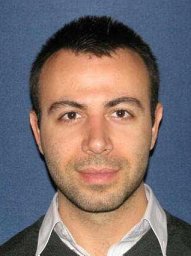 Atanas Kamburov合作论文数Computational Genomics Group, The European Bioinformatics Institute;Max-Planck Institute for Molecular Genetics, Ihnestrasse 63-73, D-14195 Berlin, Germany;The European Bioinformatics Institute, UK|Max-Planck Institute for Molecular Genetics18
 Adam Bass合作论文数Novartis Institutes for BioMedical Research18




