The urban heat island (UHI) effect is one of the most studied phenomena in urban climatology. Numerous studies have revealed the heterogeneous nature of air temperature within cities, manifesting as an urban heat "archipelago" with small-scale air-temperature differences and multiple hot and cold spots rather than a single, uniform hot spot in the city core. With the introduction of the local climate zones (LCZs) scheme, close attention has been paid to the definition and description of "urban" and "rural" sites. However, what remains understudied and inconsistent across studies is the "sea level" of the "archipelago," i.e., defining the air-temperature conditions of the surroundings, unaffected by the city. Here, we compare definitions and requirements of that "sea level," and investigate multiple possible data sets for UHI calculation. Most typically, single weather stations, often at airports, are used as a "rural" reference. However, these stations are not ubiquitously available and typically suffer from effects such as a high fraction of impervious surfaces or urban heat advection when located downwind of the city. Crowd weather stations (CWS), which have gained attention in recent years in urban climate studies due to their abundance, are often affected by nearby buildings and are mostly located in urban areas. Besides station-based data, reanalysis products such as ERA5-Land could provide an independent reference, as they are available globally and often do not consider urban areas. In this study, all three data sources were compared against an ideal case of multiple professional weather stations placed around the city. We investigate the two temperate European cities of Paris (France) and Berlin (Germany) during six years (2019-2024), focusing on crowdsourced data from CWS. We find that ERA5-Land air-temperature data is a consistent and ubiquitously available reference for the definition of "rural," providing UHI-calculations most comparable to the ideal case of having multiple professional weather stations. Using it as a universal rural reference allows for comparison between cities and further enables exploiting the potential of CWS, even in regions with few stations and a lack of professionally-operated rural weather stations. Establishing a consistent "sea level" for urban air-temperature and UHI-studies enables comparison between various cities globally and allows for the integration of different data sources, such as local networks of weather stations or CWS, on a larger scale.
Accurate modelling of turbulent sensible heat fluxes (QH) within cities is essential for understanding energy exchange between the urban surface and the atmosphere, with implications for several fields, including climate modelling, weather prediction, and urban environmental management. In this study, six Large-Aperture Scintillometers (LAS) operating over different neighbourhoods of Berlin within the urbisphere-Berlin campaign (Fenner et al., 2024) are used to derive QH. Following Saunders et al. (2024), the LAS source areas are determined by combining multiple footprints along each path using the optical path-weighting function, with iteratively derived surface roughness parameters (z0, zd, zf) obtained using the Kanda et al. (2013) method combined with a detailed building-vegetation digital surface model. Geospatial data resolution is adjusted with varying atmospheric stability conditions to ensure adequate domain representation. The LAS-derived QH uses observed refractive index structure parameter (Cn2), with meteorological variables, roughness parameters and Monin-Obukhov Similarity Theory.The six LAS paths span both inner and outer city areas of Berlin, enabling analysis of the spatial and temporal variability of QH for different building density and vegetation, as well as land use (e.g. inner city, residential). Results are presented across season and synoptic conditions, highlighting the influence of land cover and boundary layer dynamics on QH. Source-area land cover composition shows a clear urban gradient, with vegetation decreasing from ≈ 50-55% in outer-city paths to ≈ 35-50% in inner-city paths, while building fractions increase from ≈ 15-17% to ≈ 20-32%, alongside consistently high paved surface contributions (≈ 28-35%). LAS observed QH compared to eddy-covariance measurements show strong consistency. QH from high resolution (O(100 m)) numerical weather prediction modelling, undertaken with the Met Office Unified model during selected days, are compared to the LAS QH using the footprint characteristic to assess simulation capability.
Climate change with increasing air temperatures results in amplified hazards for human health by excessive heat. Compared to their non-urban surroundings, cities typically show elevated air temperatures, causing urban dwellers to be even more threatened by heat in warmer conditions. Up until now, studies could not conclusively clarify how climate change and urban effects on air temperature interact with each other over time scales covering decades since multi-decadal measurements from urban climate observation networks are generally scarce. Here, we present robust air-temperature trends for the Climate Normal 1991-2020 using quality-controlled data from eleven urban and 14 non-urban weather stations in the Berlin region, Germany, covering a wide range of urban and non-urban settings. We analyse trends for four daily variables as annual and seasonal means, as well as during heatwaves. Our findings highlight that climate change and the city interact linearly on the analysed time scales. This results in similar air-temperature trends in urban and non-urban areas, yet at different absolute levels. An exception is the daily minimum air temperature in spring, which shows different trends for urban and non-urban stations. Investigation of the built-up area around the stations and in the study region shows no significant change during the study period. This highlights that the observed warming is due to regional climate change and not related to urbanisation processes. By comparing trends for the last 30 years (1991-2020) with observational data since the end of the 19th century, we show that the recent rise in air temperature is unprecedented in the study region, indicating accelerated regional climate change. Our study, a first presenting 30 years of data from an urban climate observation network, offers a blueprint for investigating climate change in other cities with sufficient data.
Privately-owned weather stations, Crowd Weather Stations (CWS), offer high spatial and temporal density in many urban regions across the globe, and therefore have been used in a variety of urban climate studies, mostly focusing on single cities. One challenge in crowdsourcing CWS data lies in the fact that the link between measured atmospheric data and (historic-) metadata is often lost due to the limited metadata available from popular CWS networks. This poses challenges in retrieving and analyzing data, as, e.g., past changes in CWS location remain undetected, introducing incorrect data, thus reducing data integrity.We developed an end-to-end workflow for consistently collecting and checking CWS (meta-)data in 257 areas worldwide, covering over 500 urban regions since 2019. The workflow automatically adds newly set-up CWS to the database, as well as consistently handling changes in CWS location. Until now, the database includes over 310,000 CWS with 7 Billion hourly observations of air temperature and relative humidity (mean, maximum, minimum). Over 65,000 changes in CWS location have been detected since 2019. This highlights the importance of continuous metadata updates for this dynamic data source, further enabling the use of the measurements for different applications. Within the database, CWS are linked to additional metadata, including a global digital elevation model, a global Local Climate Zones map, and the Global Human Settlement Layer Urban Center Database.The database was developed using open data and open-source software, combining PostgreSQL, PostGIS, and Timescale, which allows us to manage billions of measurements efficiently. All air-temperature measurements are consistently and continuously quality controlled using the state-of-the-art open R-Package CrowdQC+. The result is a dataset of consistently-processed metadata and measurements with potential for global-scale (intra-)urban climate studies and in-depth city analyses.[MD1] [DF2]
The role of vegetation in urban climate has been in the spotlight in recent years, as it can play significant roles in carbon sequestration through photosynthesis as well as in the urban energy balance, mainly through evapotranspiration and shading. Based on these, the green infrastructureof cities is considered as a potential solution to lower the urban net CO2 exchange and lower air temperatures, improving the resilience of cities in the context of climate change.Being part of the general physiological responses of trees, the abovementioned mechanismshave been excessively studied in natural environments. However, the quantification of the different effects of these processes in complex and heterogeneous urban landscapes is challenging. In this study, we demonstrate initial results of a year-long observation period of tree vegetation in a residential area in Berlin, Germany, using PhenoCam and flux-tower observations. The phenology curves were extracted from half-hourly PhenoCam images of trees from the Acer, Aesculus, Fagus, and Pinus genera and analysed in combination with comprehensive observations of thesurface energy balance components, including net radiation, turbulent sensible and latent heat fluxes as well as CO2 fluxes and standard meteorological variables. We showcase the agreement between the gradual development of tree foliage fordeciduous vegetation (which dominates the area) with: a) the upward latent heat flux seasonal maxima observations; and b) the decline of upward CO2 flux values. In particular, the timing of the start of season (SOS), peak of season (POS) and end of season (EOS) is assessed and compared to changes detected in the flux trends. Our data indicates a strong connection of the green-up period of deciduous vegetation with the largest rate of decrease of the CO2 fluxes, leading to a change from CO2 source to sink for a constrained time period. These observations highlight the measurable effect of vegetation-related carbon sequestration that can take place in urban areas with significant vegetation cover under specific/average meteorological conditions.
Surface temperature, a key factor in the urban surface energy balance, influencing human thermal comfort, heat fluxes, and building energy use. Three-dimensional (3D) surface temperature is crucial for these applications, but satellite-derived land surface temperature (LST) has a directional view bias. 3D building energy balance models show potential in evaluating satellite view biases. Here, the VTUF-3D model (Nice et al., 2018, based on Krayenhoff and Voogt, 2007) is compared to ground-based thermal camera observations and satellite LST in Berlin, Germany.During the urbisphere-Berlin campaign (Fenner et al., 2024), four Optris PI160 thermal cameras were mounted 80 m above ground level on a residential tower block to capture diverse urban surfaces. Emissivity correction was applied on the images. ASTER LST was retrieved in multiple locations in Berlin, covering a total area of 2 km2.VTUF-3D simulations used a 5 m grid resolution and material properties based on the Hertwig et al. (2025) approach. Forcing meteorological data came from the same site as the cameras.For comparison with the cameras, sample facets (building facades and ground) were selected and the average temperature from the cameras was compared to the modelled temperature. Mean absolute error (MAE) is 3-8 K, with greater errors for surfaces such as glass or metal due to parametrization challenges.To compare the model results against LST, near-nadir view was assumed allowing the consideration of horizontal facets only. VTUF-3D pixels were aggregated to satellite resolution (90 m) to allow comparison. MAE is 2-7 K (MBE > 0 K), with greater errors in vegetated areas.Overall, VTUF-3D performs reasonably well, but its limitations must be considered during simulations for reliable results. Our simulations can help inform assessment of neighborhood-scale temperature variability, and support urban heat monitoring, climate resilience, and urban planning initiatives for city-wide heat management and sustainable development.
Gaining a deeper understanding of dynamic interactions between cities and the atmospheric boundary layer (ABL) and ABL processes in general is crucial for, e.g., the development and application of next-generation numerical weather prediction and climate modelling. In this context, detailed ABL observations provide essential information to identify potential spatial heterogeneity in urban and rural environments with respect to surface-atmosphere exchanges and resulting ABL characteristics such as ABL clouds.As part of the year-long urbisphere-Berlin measurement campaign in Berlin, Germany (October 2021-September 2022), a wide range of ABL observations were carried out to study impacts of the city on the ABL. Central to the deployed systematic network were 25 sites with ground-based Automatic Lidar and Ceilometers (ALC) to measure aerosol backscatter for investigation of intra-urban, urban-rural, and upwind-city-downwind effects of ABL clouds and detection of the mixed layer.Here, we present a systematic investigation of year-round effects of the city on ABL cloud-base height and cloud-cover fraction, mixed-layer height, and near-surface fog conditions, exploiting the dense ALC network. The comprehensive data set allows studies along diurnal and annual cycles in high temporal resolution, as well as obtaining robust statistical results for groups of sites, considering spatial heterogeneity due to local effects around the sites. Our analyses show city effects on ABL clouds along the diurnal cycle including upwind-city-downwind effects, yet also depending on cloud type and season. Mixed-layer height undergoes a distinctive annual cycle, being systematically higher above the city and with intra-urban differentiation. Over the year, the occurrence of ground-based fog is on average 1,5 times more frequently found at rural sites compared to city sites, most prominent differences are found during autumn and winter. These results are the first that are based on the complete year-long urbisphere-Berlin ALC data and highlight potentials and benefits of such high-resolution observational data sets from ground-based remote sensing for future investigations.
Detailed measurements are indispensable in order to understand small-scale urban climate effects. With professional weather stations (PWS) mostly being available outside of cities with few sites per city, alternative data sources such as crowd-sourced weather data have proven to be valuable. Often the Urban Heat Island (UHI) is studied under ideal calm conditions when its development is strongest. At the same time, it has been shown that wind leads to advection of urban air, impacting regions downwind of urban areas and within the city.We aim to provide insights into the effects of Urban Heat Advection (UHA) in the Urban Canopy Layer (UCL). The metropolitan regions of Paris and Berlin were studied, using four years (2019 - 2022) of quality-controlled crowdsourced air-temperature data from thousands of privately-owned Crowd Weather Stations (CWS). Those data were combined with global ERA5-Land data to overcome gaps in rural CWS coverage and globally-available Local Climate Zone (LCZ) information.It is shown that wind causes increased exposure to urban heat for areas located downwind of the city core, which was derived using a LCZ-weighted centroid detection. For all observed wind directions, classified by dynamically moving wind sectors, differences in spatial patterns were visible with the effect being strongest with regional wind speeds of 3 m·s−1. The results highlight the importance of considering the effects of UHA when studying the UHI to avoid underestimating the exposure to urban heat in downwind areas of the city. The results could be used as a starting point for coupling the conditions in the Atmospheric Boundary Layer with the resulting conditions in the UCL, utilizing a large database with crowdsourced CWS data.
Climate change is accompanied by increasing air temperatures, resulting in amplified hazards for human health by excessive heat. Cities typically show elevated air temperatures as compared to their non-urban surroundings such that urban dwellers are even more threatened by heat. So far, studies could not conclusively clarify how climate change and urban effects on air temperature interact with each other over time scales covering decades since multi-decadal atmospheric data from urban climate observation networks are generally scarce. Here, we present robust air-temperature trends for the climate normal period 1991-2020 using quality-controlled data from eleven urban and 14 non-urban weather stations in Berlin, Germany, and the surrounding region, covering a wide range of urban and non-urban settings. We analysed trends for four daily variables as annual and seasonal mean values, as well as during heatwaves. The results show that climate change and the city interact linearly on the analysed time scales, also during heatwaves. This results in similar air-temperature trends in urban and non-urban areas but at different absolute levels. Investigation of the built-up area around the stations and in the study region shows no significant change in the study period, highlighting that the observed warming is due to regional climate change and not related to urbanisation processes. By comparing trends for the last 30 years with those at two stations with observational data for longer time periods, we show that the recent rise in air temperature is unprecedented in the study region, indicating accelerated regional climate change. Our study, the first one presenting 30 years of data from an urban climate observation network, offers a blueprint for investigating climate change in other cities with sufficient data and supports the design of solutions for adapting cities to climate change.
With development in recent years of hectometric (𝒪(100 m); hm) scale numerical weather prediction (NWP) models, there is a need for their evaluation with high spatio-temporal scale observations. Here we assess UK Met Office Unified Model (UM) simulations with grid-spacing down to 100 m using a dense network of observations obtained during the urbisphere-Berlin campaign. A network of 25 automatic lidars-ceilometers (ALCs) provide aerosol attenuated backscatter observations from which mixed-layer height (MLH) is determined. UM simulated aerosol on 2 d (18 April and 4 August 2022) is used to determine model MLH with a novel algorithm (MMLH). Evaluation of MMLH with ALCs is focused on the MLH (1) urban-rural variability, and (2) urban plume. MMLH is consistently able to reproduce the vertical extent of the mixed layer during late afternoon despite the 2 case-study days having different maxima. MMLH performance is better in the 100 m model domain compared to a 300 m configuration, which may be explained by the higher vertical resolution in the 100 m configuration. During the August case in which an extreme heat event occurred, a delayed MLH growth is seen in the morning and afternoon over the city compared to the rural surroundings in both the model and ALCs. Both days show a distinct influence of the city through the mixed layer, including a plume extending downwind of the city that is detectable in both the observations and model. The modelled urban plume has a deeper mixed layer compared to the rural surroundings (4 August: ∼ 500 m; 18 April: ∼ 200 m) for up to 15 km downwind of the city.
Characterizing inter-instrument variability of sensors is crucial to assessing uncertainties in observational campaigns, networks, and for data assimilation. Here, we co-locate six high signal-to-noise ratio Vaisala CL61 lidar-ceilometers for a period of 10 days to quantify instrument-related differences in several observed variables: profiles of attenuated backscatter, its components (parallel- and cross-polarized backscatter) and the volume linear depolarisation ratio (), as well as derived cloud variables and mixed-layer height. Analysing intervals between 5 and 60 min, median absolute differences between sensors (AD) and percentiles (e.g., AD) are used to quantify instrument related uncertainties. For backscatter and , we differentiate between conditions with rain, clear sky, and clouds. Here we address instrument precision rather than accuracy, with instrument accuracy assumed. The detected agreement between instruments suggests a distributed measurement network should be capable of providing context for interpretation of spatial differences. If instruments measure accurately, it is possible to resolve spatial differences (e.g., urban-rural) for attenuated backscatter, derived cloud variables and layer heights. However, differences exist and vary with signal-to-noise ratio and atmospheric conditions. The AD inter-sensor results for 15 min intervals for total cloud-cover fraction (excluding clear sky and fully overcast conditions) is 1.9%, and for cloud base height 7.3 m. Agreement of all cloud variables is better for boundary layer clouds (when first cloud layer 4 km agl) than for all five cloud layers recorded by the sensor firmware. The 15 min mixed-layer height AD is 0 m and the AD 21.5 m. We show that instrument precipitation flags are in good agreement, but do not link closely with ground-level rainfall observations, hence an alternative algorithm is proposed. We provide quality control recommendations for data processing to improve inter-instrument agreement of cloud variables and mixed-layer height.
In order to better understand how urban areas modify the regional atmospheric boundary layer (ABL) and to improve and evaluate weather and climate models for urban applications and services, detailed ABL observations are needed. With new instrument technologies and advanced automatic algorithms for detection of aerosols, mixed-layer height (MLH) and boundary-layer clouds, ground-based remote sensing instruments are increasingly used in urban observational networks.During a one-year measurement campaign in Berlin, Germany (urbisphere-Berlin, Autumn 2021 – Autumn 2022), a variety of ground-based ABL observations were carried out in the greater Berlin region. Berlin as an isolated continental city with approximately 3.8 million inhabitants provides a fairly homogeneous rural background. The urbisphere network included five inner-city, six outer-city and 14 rural sites equipped with continuously-operated Automatic Lidar and Ceilometers (ALC). The measurement network was designed and set up in a systematic and rigorous manner in order to capture intra-urban, urban-rural, and upwind-city-downwind effects of MLH, cloud-base height (CBH), and cloud cover fraction (CCF) along several transects as air masses move over the city. Based on the ALC observations, MLH, CBH and CCF were automatically derived. ALC observations are complemented by measurements of wind and temperature profiles over the city using Doppler-Wind Lidars and radiosondes concurrently released in urban and rural locations during selected days. Surface heat fluxes are continuously measured with six eddy-covariance flux towers and seven path-averaging scintillometers in urban and rural settings.This contribution highlights the scientific considerations of the systematic measurement network design and the corresponding data analysis. We are proposing a scheme of attributing measurements to rings around the city centre representing the inner city (radius of 6 km), the outer city (radius of 18 km) and rural areas (radius of 90 km), further separated into upwind, downwind and other sectors. A detailed statistical analysis of the year-long dataset finds differences in MLH, CBH and CCF during different seasons and under different weather forcings. Selected case-study days are analysed in more detail to understand the processes controlling the interactions between surface fluxes and mixed-layer dynamics. These days are further used to evaluate the forecasting skill of hectometric dynamical-modelling runs with regard to ABL dynamics, quantifying also the sensitivity of ABL dynamics in the model to surface representation (e.g. soil moisture, heat flux partitioning).
We describe features and results of a data system developed to allow timely access to data from novel modular atmospheric monitoring systems deployed in urban areas in multiple cities of different sizes, simultaneously. The ERC urbisphere project is collecting a wide range of atmospheric environmental data to improve weather and climate models, in order to assess the impact of cities on the atmosphere (e.g., aerosols, greenhouse gases) and human exposure to extreme events (e.g., heat waves, heavy precipitation, air pollution). Modular observing systems involving short-term deployments include customised automatic weather stations, Doppler and ceilometer lidars, scintillometers, balloon radio sounding and spectral imaging. Deployments range from streetlight-mounted to building roofs and indoors to mobile platforms (vehicles, drones). Together this creates challenges to synthesise across multiple sources of diversity.Data are uploaded in near-time to a central data infrastructure via cell phone and IOT networks. A metadata system helps track the location and configuration of all deployed components and provides the backbone for processing instrument records into location-aware, convention-aligned and quality-assured data products according to FAIR. The data system provides services (e.g., APIs, Apps, ICEs) for inspection and computation by campaign participants. Workflow and design considerations also include collaboration tools that ensure attribution for multiple uses in near time by researchers, operational agencies and citizens.We will demonstrate how the systematic, easily adoptable approach can simplify complex campaign workflows, for both modellers and observers. The showcase of the data system will use examples from outdoor/indoor temperature observations and spatial wind field observations from past and ongoing campaigns.
Urban observation networks are becoming denser, more diverse, and more mobile, while being required to provide results in near time. The Synergy Grant "urbisphere" funded by the European Research Council (ERC) has multiple simultaneous field campaigns in cities of different sizes, collecting data to improve weather and climate models and services, including assessing the impact of cities on the atmosphere (e.g., heat, moisture, pollutant, and aerosol emissions) and people's exposure to extremes (e.g., heat waves, heavy precipitation, air pollution episodes). Here, a solution to this challenge for facilitating diverse data streams from multiple sources, scales (e.g., indoors, regional-scale atmospheric boundary layer), and cities is presented.For model development and evaluation in heterogeneous urban environments, we need meshed networks of in situ observations with ground-based and airborne (remote) sensing platforms. In this contribution we describe challenges, approaches, and solutions for data management, data infrastructure, and data governance to handle the variety of data streams from primarily novel modular observation networks deployed in multiple cities, in combination with existing data collected by partners, ranging in scale from indoor sensor deployments to regional-scale boundary layer observations.A metadata system documents (1) sensors and instruments, (2) the location and configuration of deployed components, and (3) maintenance and events. This metadata system provides the backbone for converting instrument records to calibrated, location-aware, convention-aligned, and quality-assured data products, according to FAIR (findable, accessible, interoperable, and reusable) principles. The data management infrastructure provides services (via, e.g., Application Programming Interface - APIs, apps, integrated computing interfaces - ICEs) for data inspection and subsequent calculations by campaign participants. Some near-real-time distributions are made to international networks (e.g., AERONET, PhenoCam) or local agencies (e.g., GovDATA) with appropriate attribution. The data documentation conventions, used to ensure structured datasets, in this case are used to improve the delivery of integrated urban services, such as to research and operational agencies, across many cities.
For next-generation weather and climate numerical models to resolve cities, both higher spatial resolution and subgrid parameterizations of urban canopy-atmosphere processes are required. The key is to better understand intraurban variability and urban-rural differences in atmospheric boundary layer (ABL) dynamics. This includes upwind-downwind effects due to cities' influences on the atmosphere beyond their boundaries. To address these aspects, a network of >25 ground-based remote sensing sites was designed for the Berlin region (Germany), considering city form, function, and typical weather conditions. This allows investigation of how different urban densities and human activities impact ABL dynamics. As part of the interdisciplinary European Research Council Grant urbisphere, the network was operated from autumn 2021 to autumn 2022. Here, we provide an overview of the scientific aims, campaign setup, and results from 2 days, highlighting multiscale urban impacts on the atmosphere in combination with high-resolution numerical modeling at 100-m grid spacing. During a spring day, the analyses show systematic upwind-city-downwind effects in ABL heights, largely driven by urban-rural differences in surface heat fluxes. During a heatwave day, ABL height is remarkably deep, yet spatial differences in ABL heights are less pronounced due to regionally dry soil conditions, resulting in similar observed surface heat fluxes. Our modeling results provide further insights into ABL characteristics not resolved by the observation network, highlighting synergies between both approaches. Our data and findings will support modeling to help deliver services to a wider community from citizens to those managing health, energy, transport, land use, and other city infrastructure and operations. SIGNIFICANCE STATEMENT: A yearlong field campaign with a dense and systematic network of sites provides comprehensive measurements of the atmospheric boundary layer to gain deep knowledge of urban-rural and intraurban variability of surface-atmosphere exchanges. Understanding these is of high relevance for developing next-generation numerical weather prediction and climate models. We showcase the campaign and highlight synergies between ground-based and satellite observations and high-resolution numerical weather prediction modeling on two example days. Our findings show multiscale interactions between city and atmosphere, including urban-induced effects beyond the city's boundaries ("urban plume") and urban impacts under heatwave conditions. These results are important for developing dynamic modeling frameworks, which will help in delivering services to make cities more resilient.
Improving understanding of urban atmospheric boundary layer (ABL) processes and dynamics is central to improving the modelling and forecasting of weather, air quality, and thermal comfort, in particular in densely populated urban areas. The ERC (European Research Council) urbisphere-Paris measurement campaign generated extensive in-situ and remotely sensed observations of the ABL from a network of concurrently operated automated lidars and ceilometers (ALC), doppler wind lidars, radiometers, and automatic weather stations to explore surface-atmosphere feedbacks focusing on ABL dynamics upwind, over, and downwind of a metropolitan area.Paris, one of the densest metropolitan areas in Europe, is located ~130 km from the coast in relatively flat orography, making it well-suited to study urban modifications of atmospheric boundary layer dynamics. urbisphere-Paris aims to gather consistent and coherent datasets on the magnitude and interplay of surface heat fluxes, radiation fluxes, aerosol load, and boundary layer dynamics to evaluate and improve next generation numerical weather and air quality modelling approaches.From March 2023 to March 2024 a transect along the predominant wind direction had seven Vaisala CL61 Ceilometers operating. As the transect extended both upwind and downwind of the city centre by 60 km to include the rural periphery, modifications of the ABL aerosol profile, cloud properties, and mixed layer dynamics could be observed as air moves into, across, and beyond the metropolitan area.The transect provides continuous profiles of attenuated backscatter and linear depolarisation ratio, with very high vertical (4.8 m up to 15.4 km) and temporal (every 5 s) resolution. From this other variables are derived, such as mixed layer height (MLH), cloud cover of boundary layer clouds (CC), and cloud base height (CBH). This contribution will present selected cases of spatiotemporal differences in ABL processes along the urban-rural continuum. Wind direction changes the upwind/ downwind effects such as the urban plume. Differences in temporal evolution of the ABL are also explored, including MLH, CC and CBH. These results will help identify both typical and unusual patterns to explore further with high resolution numerical weather prediction models.
Understanding how cities impact the atmospheric boundary layer is crucial for many processes such as air-pollution dispersion and concentrations, and is therefore important as part of weather and climate modelling. To improve modelling of those dynamic processes observation are critical as they inform development and evaluation of models, and enhance delivery of services to citizens and the management of urban infrastructure, which is vulnerable to different strengths of heat and pollutant exposure.During a year-long field campaign from Autumn 2021 to Autumn 2022 a comprehensive set of ground-based remote sensing observations were gathered in Berlin, Germany. These allow us to explore the impact of a large city on the regional atmospheric boundary layer. The campaign, undertaken within the European Research Council funded urbisphere project, involved a grid-like network of instruments in the densely built-up city centre, with ground-based remote sensing (e.g. automatic lidars and ceilometers ALC, Doppler-wind lidars) for mixed/mixing layer height (MLH) detection. Additional instruments were located along two perpendicular rural-urban-rural transects, with existing instruments in the city and surrounding region complementing the network. During Intensive Observation Periods (IOP) in spring and summer 2022 radiosonde releases within and outside the city during selected days allow air temperature, humidity and wind-distribution profiles in the atmospheric boundary layer to be investigated.This contribution showcases how an urban environment modifies the dynamics and convective cloud properties under varying regional-scale weather conditions. We focus on case studies for different synoptic conditions to show the extent of impact of a large city on the MLH within and beyond the urban area, including urban-rural contrasts, upwind-downwind effects, and intra-urban variability of MLH.
Field observation networks are becoming denser, more diverse, and more mobile, while being required to provide real-time results. The ERC urbisphere program is coordinating multiple field campaigns simultaneously to collect datasets on urban atmospheric and environmental conditions and processes in cities of different sizes. The datasets are used for improving climate and weather models and services, including assessing the impact of cities on the atmosphere (e.g. aerosols, greenhouse gases) as well as the exposure of urban populations in the context of atmospheric extreme events (heat waves, heavy precipitation, air pollution). For model development and evaluation, we are using meshed networks of in-situ observations with ground-based and airborne (remote-)sensing platforms. This contribution describes the urbisphere data management infrastructure and processes required to handle a variety of data streams from primarily novel modular observation systems deployed in complex urban environments.The modular observation systems consist of short-term deployed instrumentation and are separated into three thematic modules. Module A aims at characterizing urban form and function affecting urban climates. Module B quantifies the impact of urban emissions (heat, pollutants, greenhouse gases, etc.) on the urban boundary layer over and downwind of cities. Module C provides data on human exposure at street and indoor-level. The three modules are served with consistent data management, documentation and calibration. Systems deployed in Modules A, B and C include customized automatic weather stations, (Doppler) lidars and ceilometers, scintillometers, balloon radio sounding and spectral camera imaging. Systems are street-light-mounted, located on building roof-tops or indoors as well as on mobile platforms (vehicles, drones). Data ingestion processes are automated, delivering moderate data volumes in real-time to central data infrastructure through mobile phone and IOT connectivity. A meta data system helps keep track of the location and configuration of all deployed components and forms the backbone for conversion of instrument records into location-aware, conventions-aligned and quality-assured F.A.I.R. data products. Furthermore, the data management infrastructure provides services (APIs, Apps, IDEs, etc.) for data inspection and computations by scientists and students involved in the campaigns. Select datasets are integrated in near real-time into other global or local data systems such as, e.g., AERONET, the Phenocam Network, ICOS, or PANAME, for multiple uses.Besides technical aspects and design considerations, we discuss how cooperation and attribution are safeguarded when data are being accessed for immediate academic and citizen data science.
The development of inexpensive sensors and the availability of masses of meteorological measurement data, mainly of air pressure, air temperature and air humidity, enable a spatial and temporal compression of conventional measurement networks. This opens up completely new possibilities not only for science but also for municipalities, companies and other institutions, e. g. in environmental monitoring and description of the local climate. The easy availability and operation of these sensors enable even the layman to operate them and to participate or even contribute to these measurement programs. This new way of collecting and incorporating measurement data outside the standard measurement networks is called crowdsourcing.The article serves the preparation of a corresponding VDI guideline and describes the available sensor technology, the assurance of data quality and the possibilities of data processing.
Recent advances in citizen weather station (CWS) networks, with data accessible via crowd-sourcing, provide relevant climatic information to urban scientists and decision makers. In particular, CWS can provide long-term measurements of urban heat and valuable information on spatio-temporal heterogeneity related to horizontal heat advection. In this study, we make the first compilation of a quasi-climatologic dataset covering 6 years (2015–2020) of hourly near-surface air temperature measurements obtained via 1560 suitable CWS in a domain covering south-east England and Greater London. We investigated the spatio- temporal distribution of urban heat and the influences of local environments on climate, captured by CWS through the scope of Local Climate Zones (LCZ) – a land-use land-cover classification specifically designed for urban climate studies. We further calculate, for the first time, the amount of advected heat captured by CWS located in Greater London and the wider south east England region. We find that London is on average warmer by ∼1.0 ◦C to ∼2.0 ◦C than the rest of south-east England. Characteristics of the southern coastal climate are also captured in the analysis. We find that on average, urban heat advection (UHA) contributes to 0.22 ◦C of the total urban heat in Greater London. Certain areas, mostly in the centre of London are deprived of urban heat through advection since heat is transferred more to downwind suburban areas. UHA can positively contribute to urban heat by up to ∼2.0 ◦C on average and negatively by down to ∼-1.0 ◦C. Our results also show an important degree of inter- and intra-LCZ variability in UHA, calling for more research in the future. Nevertheless, we already find that UHA can impact green areas and reduce their cooling benefit. Such outcomes show the added value of CWS for future urban design.
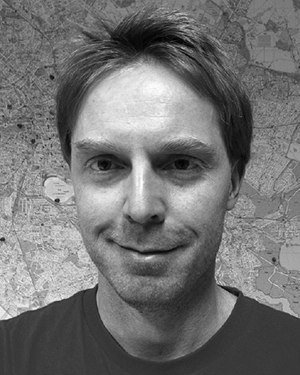 Fred Meier合作论文数24
 Dieter Scherer合作论文数Chair Climatol, Tech Univ Berlin14
 Andreas Christen合作论文数university of british columbia11
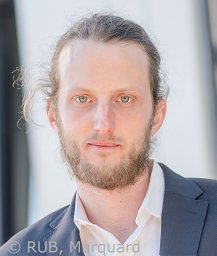 Benjamin Bechtel合作论文数Institute of Geography;Physical Geography, Section;University of Hamburg;Institute of Geography, University of Hamburg11
 Sue Grimmond合作论文数Department of Meteorology, School of Mathematical & Physical Sciences, University of Reading11
 William J. Morrison合作论文数The Neuroimmunology Research Laboratory, Veterans Administration Medical Center;and the Departments of Pharmacology, Neurology, and Microbiology/Immunology, Oregon Health Sciences University;Veterans Administration Medical Center, Oregon Health Sciences University9
 Matthias J. Zeeman合作论文数Institute of Plant Sciences;ETH Zurich7
 Nektarios Chrysoulakis合作论文数Inst Appl & Computat Math, Fdn Res & Technol Hellas FORTH7
 Marco Otto合作论文数6
 Achim Holtmann合作论文数6
 Simone Kotthaus合作论文数Laboratoire de Météorologie Dynamique, École Polytechnique6
 Matthias Demuzere合作论文数Department of Environment, Faculty of Bioscience Engineering, Ghent University;B-Kode;The World Bank6
 Jonas Kittner合作论文数Urban Climatol Grp, Ruhr Univ Bochum5Gregor Feigel合作论文数4Alexander Krug合作论文数4Tom Grassmann合作论文数3Arjan Droste合作论文数3
 Mikhail Varentsov合作论文数A.M. Obukhov Institute of Atmospheric Physics, Pyzhevskiy Pereulok, 3, 119017 Moscow, Russia3
 Sebastian Schubert合作论文数Humboldt Univ, Geog Dept, Berlin, Germany3Oscar Brousse合作论文数Institute for Environmental Design and Engineering, The Bartlett Faculty of the Built Environment, University College London3
 Timofey E. Samsonov合作论文数3
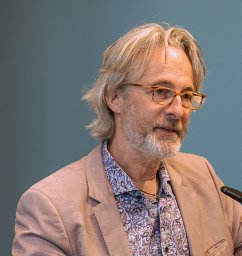 Christoph Schneider合作论文数Department of Geography;Aachen University;Department of Geography, Aachen University3
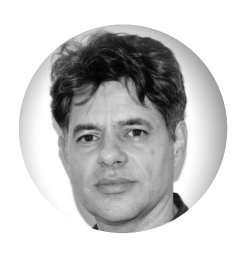 Swen M. Metzger合作论文数Biogeochemistry and Air Chemistry Departments, Max Planck Institute for Chemistry, Mainz, Germany3Marvin Plein合作论文数2
 Joern Birkmann合作论文数2Markus Sulzer合作论文数2
 Dimitris Tsirantonakis合作论文数2Friderike Kuik合作论文数2
 Ferdinand Briegel合作论文数2
 Rainer Hilland合作论文数2
 Luxi Jin合作论文数2
 Kathleen Anne Mar合作论文数Institute for Advanced Sustainability Studies (IASS), Berliner Strasse 130, 14467 Potsdam, Germany2
 Marie-Leen Verdonck合作论文数FORSIT, Ghent University2britta janicke合作论文数, Braunschweig, Germany.2
 Hugo Denier Van Der Gon合作论文数TNO2
 Christoph Beck合作论文数2
 Gerard Johannes Steeneveld (Gert Jan Steeneveld)合作论文数Division of Meteorology and Air Quality, Department of Environmental Sciences, Wageningen University2
 Martial Haeffelin合作论文数CNRS;Institut Pierre Simon Laplace2
 Frieke M.B. Van Coillie合作论文数Laboratory of Forest Management and Spatial Information Techniques, Ghent University2
 Matthias Budde合作论文数Disy Informationssysteme GmbH2
 Pavel Konstantinov合作论文数2
 Galina Churkina合作论文数Leibniz-Centre for Agricultural Landscape Research2
 Tim Butler合作论文数Department of Human Geography, King's College London2T. Foken合作论文数1
 Nancy Walker合作论文数1
 Pavel Kargashin合作论文数1Nimra Iqbal合作论文数1
 Burkhard Neuwirth合作论文数1




