Steady-state Reynolds-averaged Navier-Stokes (RANS) simulations of urban wind fields and linear interpolation between computed wind directions, are validated against experimental wind sensor measurements. In comparison with linear interpolation, the effectiveness of Proper Orthogonal Decomposition (POD)-based reduced-order modeling is also evaluated with the objective of reducing data storage requirements while maintaining interpolation accuracy. The study focuses on a complex urban area of approximately 3 km2 surrounding the campus of the Technical University of Berlin. A total of 36 wind field simulations are conducted for inflow wind directions at 10 degrees intervals. Validation against long-term experimental wind measurements at nine locations within the urban area yields average deviations of 21.7% for relative wind speed, 0.58 m/s for absolute wind speed, and 28 degrees for wind direction. A standard linear interpolation approach is subsequently applied to estimate wind fields for various wind directions using an interpolation database of 12 simulated wind fields. The validation of the interpolated wind fields against experimental measurements results in average deviations of 29.7% for relative wind speed, 0.56 m/s for absolute wind speed, and 31 degrees for wind direction. It is further demonstrated that increasing the number of wind fields in the interpolation database beyond 12 does not lead to an improvement in estimation accuracy. Finally, POD-based interpolation is introduced as a reduced-order modeling approach aimed at substantially reducing data storage requirements. The accuracy of the wind field estimates obtained using POD-based interpolation is evaluated in comparison with standard linear interpolation. Using six POD modes, an estimation error of 6.3% is obtained, compared to 12% for linear interpolation based on six wind directions, this demonstrates an improved accuracy for an equivalent level of data storage using POD-based interpolation.
This study provides a comprehensive dataset (FAIRUrbTemp) that addresses the lack of high-resolution urban air temperature data across Europe. It compiles sub-hourly street-level air temperature data from 811 low-cost to commercial sensors across several European cities and offers data in a quality-controlled, standardized format in sub-hourly, hourly, and daily resolutions. In addition, detailed metadata, as an important source of information in urban studies, is provided at network, station, and measurement levels. This pan-European dataset is rigorously quality-controlled using a serially automatic method applicable to diverse city-scale air temperature data, which identifies systematic and minor inconsistencies to enhance reliability. Expert-based validation shows that the QC reliably identifies problematic measurements, while its performance varies across urban and climatic settings due to local environmental and instrumental effects. To ensure transparency, the results of the quality control are provided to the user together with the original value in the dataset. The validated FAIRUrbTemp is a valuable resource for urban climate studies, with direct applications in validating microclimate models, assessing heat-health risks, and informing climate-adaptive urban planning.
Climate change with increasing air temperatures results in amplified hazards for human health by excessive heat. Compared to their non-urban surroundings, cities typically show elevated air temperatures, causing urban dwellers to be even more threatened by heat in warmer conditions. Up until now, studies could not conclusively clarify how climate change and urban effects on air temperature interact with each other over time scales covering decades since multi-decadal measurements from urban climate observation networks are generally scarce. Here, we present robust air-temperature trends for the Climate Normal 1991-2020 using quality-controlled data from eleven urban and 14 non-urban weather stations in the Berlin region, Germany, covering a wide range of urban and non-urban settings. We analyse trends for four daily variables as annual and seasonal means, as well as during heatwaves. Our findings highlight that climate change and the city interact linearly on the analysed time scales. This results in similar air-temperature trends in urban and non-urban areas, yet at different absolute levels. An exception is the daily minimum air temperature in spring, which shows different trends for urban and non-urban stations. Investigation of the built-up area around the stations and in the study region shows no significant change during the study period. This highlights that the observed warming is due to regional climate change and not related to urbanisation processes. By comparing trends for the last 30 years (1991-2020) with observational data since the end of the 19th century, we show that the recent rise in air temperature is unprecedented in the study region, indicating accelerated regional climate change. Our study, a first presenting 30 years of data from an urban climate observation network, offers a blueprint for investigating climate change in other cities with sufficient data.
We analyze the weather-related link availabilities of high-capacity THz-wireless transmission systems, focusing on fiber-integrated point-to-point links in the lower THz frequency range around 300 GHz. First, we discuss latest component technologies for electronic and photonic THz generation, showing that there is a good basis for the implementation of wideband THz-wireless links. Then, we review the application of a THz-wireless fiber extender and identify challenges for its integration into future 6G optical networks, being mainly the linear optical-to-THz conversion and the weather-dependent THz link loss. Both aspects will be addressed in the following: We describe the concept and implementation of a fiber-integrated THz outdoor unit prototype based on electronic THz components and provide link budget calculations for a data rate of 100 Gbit/s. Then, we estimate the THz link loss from theoretical models and real weather data, showing that high link availabilities above 99.999% are possible for link distances of 500 m with state-of-the-art components. Estimates for a longer distance of 1 km are given as well. Finally, we describe our outdoor testbed built with our prototypes and present measured data on the link attenuation over 500 m in comparison to the theoretical expectations, achieving a good correlation.
The role of vegetation in urban climate has been in the spotlight in recent years, as it can play significant roles in carbon sequestration through photosynthesis as well as in the urban energy balance, mainly through evapotranspiration and shading. Based on these, the green infrastructureof cities is considered as a potential solution to lower the urban net CO2 exchange and lower air temperatures, improving the resilience of cities in the context of climate change.Being part of the general physiological responses of trees, the abovementioned mechanismshave been excessively studied in natural environments. However, the quantification of the different effects of these processes in complex and heterogeneous urban landscapes is challenging. In this study, we demonstrate initial results of a year-long observation period of tree vegetation in a residential area in Berlin, Germany, using PhenoCam and flux-tower observations. The phenology curves were extracted from half-hourly PhenoCam images of trees from the Acer, Aesculus, Fagus, and Pinus genera and analysed in combination with comprehensive observations of thesurface energy balance components, including net radiation, turbulent sensible and latent heat fluxes as well as CO2 fluxes and standard meteorological variables. We showcase the agreement between the gradual development of tree foliage fordeciduous vegetation (which dominates the area) with: a) the upward latent heat flux seasonal maxima observations; and b) the decline of upward CO2 flux values. In particular, the timing of the start of season (SOS), peak of season (POS) and end of season (EOS) is assessed and compared to changes detected in the flux trends. Our data indicates a strong connection of the green-up period of deciduous vegetation with the largest rate of decrease of the CO2 fluxes, leading to a change from CO2 source to sink for a constrained time period. These observations highlight the measurable effect of vegetation-related carbon sequestration that can take place in urban areas with significant vegetation cover under specific/average meteorological conditions.
The Central European Refined analysis (CER) was developed in 2016 as a high-resolution, reanalysis-based, gridded dataset for Central Europe. The second version (CER v2) aims to further improve the performance of the CER with a particular focus on precipitation data for the metropolitan region Berlin-Brandenburg. The simulation setup consists of two-way nested, cascaded domains for Germany (10 km grid spacing) and the region Berlin-Brandenburg (2 km grid spacing) and employs a daily re-initialization approach. Major changes from the precursor version include the use of ECMWF-ERA5 reanalysis forcing data and a newer WRF version, allowing for the production of longer time series. To further improve the precipitation performance for the CER v2 we performed sensitivity experiments with five cumulus and five microphysics schemes. The results of these test simulations were evaluated using one year of daily precipitation data at 244 stations of the German Weather Service (DWD) in the 2 km domain of the model. The best average performance was achieved for a combination of the conventional Kain-Fritsch cumulus and the Thompson microphysics scheme. Using this setup, we simulated the precipitation conditions for 30 years (1991-2020) and evaluated monthly and annual precipitation averages against station and radar data by the DWD. Here, the CER v2 showed a significant reduction in deviations and mean bias compared to the previous version. Based on the spatial resolution of the ERA5 data, we resampled the CER v2 and observational data to compare the performance of both datasets. We observed a wet bias in the ERA5 precipitation data for this region, which was significantly reduced in the CER v2. Results of monthly averages indicated a comparable performance to ERA5 data throughout most of the year. Deviations from the observational data were typically higher during the summer months. However, due to the significant bias reduction and the high spatial resolution, the CER v2 could provide important insights about the local- to mesoscale precipitation dynamic of this region.
Gaining a deeper understanding of dynamic interactions between cities and the atmospheric boundary layer (ABL) and ABL processes in general is crucial for, e.g., the development and application of next-generation numerical weather prediction and climate modelling. In this context, detailed ABL observations provide essential information to identify potential spatial heterogeneity in urban and rural environments with respect to surface-atmosphere exchanges and resulting ABL characteristics such as ABL clouds.As part of the year-long urbisphere-Berlin measurement campaign in Berlin, Germany (October 2021-September 2022), a wide range of ABL observations were carried out to study impacts of the city on the ABL. Central to the deployed systematic network were 25 sites with ground-based Automatic Lidar and Ceilometers (ALC) to measure aerosol backscatter for investigation of intra-urban, urban-rural, and upwind-city-downwind effects of ABL clouds and detection of the mixed layer.Here, we present a systematic investigation of year-round effects of the city on ABL cloud-base height and cloud-cover fraction, mixed-layer height, and near-surface fog conditions, exploiting the dense ALC network. The comprehensive data set allows studies along diurnal and annual cycles in high temporal resolution, as well as obtaining robust statistical results for groups of sites, considering spatial heterogeneity due to local effects around the sites. Our analyses show city effects on ABL clouds along the diurnal cycle including upwind-city-downwind effects, yet also depending on cloud type and season. Mixed-layer height undergoes a distinctive annual cycle, being systematically higher above the city and with intra-urban differentiation. Over the year, the occurrence of ground-based fog is on average 1,5 times more frequently found at rural sites compared to city sites, most prominent differences are found during autumn and winter. These results are the first that are based on the complete year-long urbisphere-Berlin ALC data and highlight potentials and benefits of such high-resolution observational data sets from ground-based remote sensing for future investigations.
Climate change is accompanied by increasing air temperatures, resulting in amplified hazards for human health by excessive heat. Cities typically show elevated air temperatures as compared to their non-urban surroundings such that urban dwellers are even more threatened by heat. So far, studies could not conclusively clarify how climate change and urban effects on air temperature interact with each other over time scales covering decades since multi-decadal atmospheric data from urban climate observation networks are generally scarce. Here, we present robust air-temperature trends for the climate normal period 1991-2020 using quality-controlled data from eleven urban and 14 non-urban weather stations in Berlin, Germany, and the surrounding region, covering a wide range of urban and non-urban settings. We analysed trends for four daily variables as annual and seasonal mean values, as well as during heatwaves. The results show that climate change and the city interact linearly on the analysed time scales, also during heatwaves. This results in similar air-temperature trends in urban and non-urban areas but at different absolute levels. Investigation of the built-up area around the stations and in the study region shows no significant change in the study period, highlighting that the observed warming is due to regional climate change and not related to urbanisation processes. By comparing trends for the last 30 years with those at two stations with observational data for longer time periods, we show that the recent rise in air temperature is unprecedented in the study region, indicating accelerated regional climate change. Our study, the first one presenting 30 years of data from an urban climate observation network, offers a blueprint for investigating climate change in other cities with sufficient data and supports the design of solutions for adapting cities to climate change.
The Urban Climate Observatory (UCO) Berlin is an open and long-term infrastructure for integrative research on urban weather, climate, and air quality. Quality-controlled observations are carried out in order to study the interaction between atmospheric processes and urban structures, as well as climate variability and climate change in urban environments. It enables multi-scale, three-dimensional atmospheric studies integrating observational and numerical modelling methods. The UCO Berlin includes the following components: The Urban Climate Observation Network (UCON) Berlin provides long-term observations of atmospheric variables (air temperature, relative humidity, air pressure, global radiation, wind, precipitation) in the Urban Canopy Layer (UCL) at various locations since the 1990s. Since 2015 freely available data from Netatmo weather stations in Berlin and surrounding have been systematically collected (Crowdsourcing). The meteorological towers are located in the garden of the Institute of Ecology at Rothenburgstraße (ROTH) in Berlin-Steglitz since 2018 and on the roof of the main building of the TU Berlin at Campus Charlottenburg (TUCC) since 2014. Turbulent fluxes of sensible and latent heat as well as carbon dioxide are derived from eddy covariance (EC) systems, which combines an open-path gas analyzer and a three dimensional sonic anemometer-thermometer (IRGASON, Campbell Scientific). The EC-systems at ROTH are installed at 40 m, 30 m, 20 m, 10 m and 2 m above ground and at TUCC at 10 m above roof (56 m above ground). The down- and upwelling radiation is measured separately for short-wave and long-wave radiation (CNR4, Kipp & Zonen) at the same heights as the EC-systems. The seasonal development of vegetation is observed at both tower locations using phenocams part of the international PhenoCam (phenocam.nau.edu) network. The ROTH tower is an associate site of the European research infrastructure Integrated Carbon Observation System (ICOS) and part of the national ICOS-D network (ID: DE-BeR). Ground-based remote sensing is used to study the urban boundary layer since 2017. The UCO Berlin operates two Doppler LiDAR systems (Streamline XR, Halo Photonics) and provide profiles of the horizontal wind speed and wind direction as well as information on atmospheric turbulence. Cloud height, cloud cover and aerosol layers are recorded with ceilometers (CHM 15k, Lufft) at sites Grunewald and TUCC, which is part of the E-Profile Network of the European meteorological services EUMETNET. The ceilometer range is 15 km, the vertical resolution is 15 m and the temporal resolution is 15 s. A microwave radiometer (HATPRO-G5, RPG Radiometer Physics GmbH) provides vertical profiles of air temperature and absolute humidity up to an altitude of 10 km. Integrated liquid water path (LWP) and the integrated water vapor (IWV) are derived from measurements of the brightness temperature in 14 channels. An X-band Doppler weather radar with dual polarization (GMWR-25-DP, GAMIC) for precipitation research is in operation since autumn 2022 and has a range of 100 km. The website of the UCO Berlin provides a data portal for search of meta data and download of open climate data in Berlin and surrounding: https://uco.berlin
In order to better understand how urban areas modify the regional atmospheric boundary layer (ABL) and to improve and evaluate weather and climate models for urban applications and services, detailed ABL observations are needed. With new instrument technologies and advanced automatic algorithms for detection of aerosols, mixed-layer height (MLH) and boundary-layer clouds, ground-based remote sensing instruments are increasingly used in urban observational networks.During a one-year measurement campaign in Berlin, Germany (urbisphere-Berlin, Autumn 2021 – Autumn 2022), a variety of ground-based ABL observations were carried out in the greater Berlin region. Berlin as an isolated continental city with approximately 3.8 million inhabitants provides a fairly homogeneous rural background. The urbisphere network included five inner-city, six outer-city and 14 rural sites equipped with continuously-operated Automatic Lidar and Ceilometers (ALC). The measurement network was designed and set up in a systematic and rigorous manner in order to capture intra-urban, urban-rural, and upwind-city-downwind effects of MLH, cloud-base height (CBH), and cloud cover fraction (CCF) along several transects as air masses move over the city. Based on the ALC observations, MLH, CBH and CCF were automatically derived. ALC observations are complemented by measurements of wind and temperature profiles over the city using Doppler-Wind Lidars and radiosondes concurrently released in urban and rural locations during selected days. Surface heat fluxes are continuously measured with six eddy-covariance flux towers and seven path-averaging scintillometers in urban and rural settings.This contribution highlights the scientific considerations of the systematic measurement network design and the corresponding data analysis. We are proposing a scheme of attributing measurements to rings around the city centre representing the inner city (radius of 6 km), the outer city (radius of 18 km) and rural areas (radius of 90 km), further separated into upwind, downwind and other sectors. A detailed statistical analysis of the year-long dataset finds differences in MLH, CBH and CCF during different seasons and under different weather forcings. Selected case-study days are analysed in more detail to understand the processes controlling the interactions between surface fluxes and mixed-layer dynamics. These days are further used to evaluate the forecasting skill of hectometric dynamical-modelling runs with regard to ABL dynamics, quantifying also the sensitivity of ABL dynamics in the model to surface representation (e.g. soil moisture, heat flux partitioning).
Artificial Intelligence (AI) tools based on Machine learning (ML) have demonstrated their potential in modeling climate-related phenomena. However, their application to quantifying greenhouse gas emissions in cities remains under-researched. Here, we introduce a ML-based bottom-up framework to predict hourly CO2 emissions from vehicular traffic at fine spatial resolution (30 × 30 m). Using data-driven algorithms, traffic counts, spatio-temporal features, and meteorological data, our model predicted hourly traffic flow, average speed, and CO2 emissions for passenger cars (PC) and heavy-duty trucks (HDT) at the street scale in Berlin. Even with limited traffic information, the model effectively generalized to new road segments. For PC, the Relative Mean Difference (RMD) was +16% on average. For HDT, RMD was 19% for traffic flow and 2.6% for average speed. We modeled seven years of hourly CO2 emissions from 2015 to 2022 and identified major highways as hotspots for PC emissions, with peak values reaching 1.639 kgCO2 m−2 d−1. We also analyzed the impact of COVID-19 lockdown and individual policy stringency on traffic CO2 emissions. During the lockdown period (March 15 to 1 June 2020), weekend emissions dropped substantially by 25% (−18.3 tCO2 day−1), with stay-at-home requirements, workplace closures, and school closures contributing significantly to this reduction. The continuation of these measures resulted in sustained reductions in traffic flow and CO2 emissions throughout 2020 and 2022. These results highlight the effectiveness of ML models in quantifying vehicle traffic CO2 emissions at a high spatial resolution. Our ML-based bottom-up approach offers a useful tool for urban climate research, especially in areas lacking detailed CO2 emissions data.
The LCZ4r is a novel toolkit designed to streamline Local Climate Zones (LCZ) classification and Urban Heat Island (UHI) analysis. Built on the open-source R statistical programming platform, the LCZ4r package aims to improve the usability of the LCZ framework for climate and environment researchers. The suite of LCZ4r functions is categorized into general and local functions ( https://bymaxanjos.github.io/LCZ4r/index.html ). General functions enable users to quickly extract LCZ maps for any landmass of the world at different scales, without requiring extensive GIS expertise. They also generate a series of urban canopy parameter maps, such as impervious fractions, albedo, and sky view factor, and calculate LCZ-related area fractions. Local functions require measurement data to perform advanced geostatistical analysis, including time series, thermal anomalies, air temperature interpolation, and UHI intensity. By integrating LCZ data with interpolation techniques, LCZ4r enhances air temperature modeling, capturing well-defined thermal patterns, such as vegetation-dominated areas, that traditional methods often overlook. The openly available and reproducible R-based scripts ensure consistent results and broad applicability, making LCZ4r a valuable tool for researchers studying the relationship between land use-cover and urban climates.
Heat stress is the leading climate-related cause of premature deaths in Europe. Major heatwaves have struck Europe recently and are expected to increase in magnitude and length. Large cities are particularly threatened due to the urban morphology and imperviousness. Green spaces mitigate heat, providing cooling services through shade provision and evapotranspiration. However, the distribution of green cooling and the population most affected are often unknown. Here we reveal environmental injustice regarding green cooling in 14 major European urban areas. Vulnerable residents in Europe are not concentrated in the suburbs but in run-down central areas that coincide with low-cooling regions. In all studied areas, lower-income residents, tenants, immigrants and unemployed citizens receive below-average green cooling, while upper-income residents, nationals and homeowners experience above-average cooling provision. The fatality risk during extreme heatwaves may increase as vulnerable residents are unable to afford passive or active cooling mitigation.
Ultrafine particles (UFP) are abundant in urban atmospheres. To assess the strength and temporal variation of urban UFP emission sources, information on the surface-atmosphere exchange, i.e. the turbulent vertical flux of particles, is vital. A three-year time series of UFP emission fluxes (FUFP) observed at an urban site in Berlin, Germany, using the eddy covariance technique was utilized to develop and evaluate generalized additive models (GAM) for FUFP. GAM allow to account for non-linear relationships between response and predictor variables. Two separate models for summer and winter were developed. The predictors that most strongly influenced modelled FUFP in the summer model were traffic activity, friction velocity, land use, air temperature and PM10 concentration, whereas the winter model additionally incorporated relative humidity. The GAM were evaluated by ten-fold cross-validation for the first two study years, and by predicting the third year based on the model trained with observational data of the first two years. The coefficients of determination of the two validation methods were R2 = 0.52 (uncertainty of -47 to 88% for FUFP) and R2 = 0.48 (-45 to 82% for FUFP) for the winter model, whereas the summer model yielded R2 = 0.48 and 0.44 (uncertainty of -51 to 102%). GAM were shown to successfully capture the non-linear relationships between predictor variables and FUFP for the three-year data set at this urban site.
For next-generation weather and climate numerical models to resolve cities, both higher spatial resolution and subgrid parameterizations of urban canopy-atmosphere processes are required. The key is to better understand intraurban variability and urban-rural differences in atmospheric boundary layer (ABL) dynamics. This includes upwind-downwind effects due to cities' influences on the atmosphere beyond their boundaries. To address these aspects, a network of >25 ground-based remote sensing sites was designed for the Berlin region (Germany), considering city form, function, and typical weather conditions. This allows investigation of how different urban densities and human activities impact ABL dynamics. As part of the interdisciplinary European Research Council Grant urbisphere, the network was operated from autumn 2021 to autumn 2022. Here, we provide an overview of the scientific aims, campaign setup, and results from 2 days, highlighting multiscale urban impacts on the atmosphere in combination with high-resolution numerical modeling at 100-m grid spacing. During a spring day, the analyses show systematic upwind-city-downwind effects in ABL heights, largely driven by urban-rural differences in surface heat fluxes. During a heatwave day, ABL height is remarkably deep, yet spatial differences in ABL heights are less pronounced due to regionally dry soil conditions, resulting in similar observed surface heat fluxes. Our modeling results provide further insights into ABL characteristics not resolved by the observation network, highlighting synergies between both approaches. Our data and findings will support modeling to help deliver services to a wider community from citizens to those managing health, energy, transport, land use, and other city infrastructure and operations. SIGNIFICANCE STATEMENT: A yearlong field campaign with a dense and systematic network of sites provides comprehensive measurements of the atmospheric boundary layer to gain deep knowledge of urban-rural and intraurban variability of surface-atmosphere exchanges. Understanding these is of high relevance for developing next-generation numerical weather prediction and climate models. We showcase the campaign and highlight synergies between ground-based and satellite observations and high-resolution numerical weather prediction modeling on two example days. Our findings show multiscale interactions between city and atmosphere, including urban-induced effects beyond the city's boundaries ("urban plume") and urban impacts under heatwave conditions. These results are important for developing dynamic modeling frameworks, which will help in delivering services to make cities more resilient.
Cool roofs have higher solar reflectance and thermal emissivity than conventional roofs, decreasing the temperature of buildings during sunlight hours. This benefits the buildings (reducing the cooling loads) and the environment (improving the outdoor thermal comfort) during summer. However, cool roofs' impact on outdoor air quality is not well known.Computational Fluid Dynamic (CFD) models allow the evaluation of environmental improvement measures at very high spatial resolution. Nevertheless, microscale studies combining outdoor thermal comfort and air quality at district or city scales have been scarce in the literature due to the computational cost involved.The objective of this work is to estimate the impact of cool roofs on outdoor thermal comfort and air quality at the district scale. For this purpose, a CFD model is used considering:atmospheric flows through a URANS (Unsteady Reynolds-Averaged Navier-Stokes) approach traffic-related NOX dispersion as a passive scalar thermal loads using a complete radiation model (solar radiation, radiation from the environment, transmission through non-opaque surfaces, and emission from non-transparent surfaces) thermal and optical properties of the building envelope energy storage in walls, floors and roofs (in glazing is negligible) through a non-steady state conjugate heat transfer model between the outdoor and indoor Firstly, some scenarios of the COSMO experiment (Kawai et al., 2007) are simulated to evaluate the model performance. Finally, the cool roof impact is estimated during 24 hours of a heat wave episode in a district of Madrid (Spain), characterized by a regular morphology (aligned blocks of H=15 m and H/W=1).Results show that cool roofs modify the urban meteorology (mean radiant temperature, air temperature, wind speed and turbulent kinetic energy), decreasing the Universal Thermal Climate Index, UTCI, at pedestrian height, especially upstream and during hours of higher irradiance. However, depending on the wind speed, cool roofs can generate thermal inversions at building height affecting the pollutant dispersion within the streets. This fact increases the pollutant concentration at pedestrian height.
The Central Europe Refined Analysis (CER) was developed in 2016 as a high-resolution, reanalysis-based, gridded data set for Central Europe and the Berlin-Brandenburg metropolitan region of Germany in particular. The data set was successfully used for investigations of near-surface air temperatures, but showed inaccuracies in the simulated precipitation compared to station measurements. In this study we characterize the development of the second version of this data set (CER v2), which focused primarily on improving the performance of precipitation products. This new version uses an updated version of the WRF model and new ERA5 forcing data. Comprehensive sensitivity studies were carried out to optimize the physical parameterization of daily precipitation results. The combination of the Kain-Fritsch cumulus and the Thompson microphysics scheme was selected for the CER v2 due to the reduction of the domain average Mean Deviation (MD) by 77% and the Root Mean Squared Deviation (RMSD) by 18% when compared to the original CER setup. The validation of 30 years (1991-2020) of the CER v2 precipitation data against station data by the German Weather Service (DWD) revealed that the domain median RMSD was the lowest during the winter with seasonal median RMSD of 0.24 mm d-1 and the highest during the summer with 0.71 mm d-1 . The comparison against 20 years of radar data (2001-2020) identified the highest seasonal RMSD during the summer along the western and southern border of the model domain and in the northeast of Berlin with values above 1 mm d-1 . CER v2 data was compared to the CER v1 and ERA5 data for the time period of 2001-2018 on a resampled 0.25 degrees grid. In terms of the domain median RMSD and MD, the CER v2 outperformed the CER v1 and the ERA5 during the winter, spring and autumn. However during summer, the domain median CER v2 RMSD was 46% higher than for ERA5. One of the biggest advantages of the data set is the substantial reduction in the domain median annual MD, which was about 94% lower than for the ERA5 forcing data. Due to its longer available time series and increased performance compared to the previous version, the CER v2 could provide important insights about the local- to mesoscale precipitation dynamics of the study region and serve as a foundation for data-driven hydrological models.
Understanding how cities impact the atmospheric boundary layer is crucial for many processes such as air-pollution dispersion and concentrations, and is therefore important as part of weather and climate modelling. To improve modelling of those dynamic processes observation are critical as they inform development and evaluation of models, and enhance delivery of services to citizens and the management of urban infrastructure, which is vulnerable to different strengths of heat and pollutant exposure.During a year-long field campaign from Autumn 2021 to Autumn 2022 a comprehensive set of ground-based remote sensing observations were gathered in Berlin, Germany. These allow us to explore the impact of a large city on the regional atmospheric boundary layer. The campaign, undertaken within the European Research Council funded urbisphere project, involved a grid-like network of instruments in the densely built-up city centre, with ground-based remote sensing (e.g. automatic lidars and ceilometers ALC, Doppler-wind lidars) for mixed/mixing layer height (MLH) detection. Additional instruments were located along two perpendicular rural-urban-rural transects, with existing instruments in the city and surrounding region complementing the network. During Intensive Observation Periods (IOP) in spring and summer 2022 radiosonde releases within and outside the city during selected days allow air temperature, humidity and wind-distribution profiles in the atmospheric boundary layer to be investigated.This contribution showcases how an urban environment modifies the dynamics and convective cloud properties under varying regional-scale weather conditions. We focus on case studies for different synoptic conditions to show the extent of impact of a large city on the MLH within and beyond the urban area, including urban-rural contrasts, upwind-downwind effects, and intra-urban variability of MLH.
Field observation networks are becoming denser, more diverse, and more mobile, while being required to provide real-time results. The ERC urbisphere program is coordinating multiple field campaigns simultaneously to collect datasets on urban atmospheric and environmental conditions and processes in cities of different sizes. The datasets are used for improving climate and weather models and services, including assessing the impact of cities on the atmosphere (e.g. aerosols, greenhouse gases) as well as the exposure of urban populations in the context of atmospheric extreme events (heat waves, heavy precipitation, air pollution). For model development and evaluation, we are using meshed networks of in-situ observations with ground-based and airborne (remote-)sensing platforms. This contribution describes the urbisphere data management infrastructure and processes required to handle a variety of data streams from primarily novel modular observation systems deployed in complex urban environments.The modular observation systems consist of short-term deployed instrumentation and are separated into three thematic modules. Module A aims at characterizing urban form and function affecting urban climates. Module B quantifies the impact of urban emissions (heat, pollutants, greenhouse gases, etc.) on the urban boundary layer over and downwind of cities. Module C provides data on human exposure at street and indoor-level. The three modules are served with consistent data management, documentation and calibration. Systems deployed in Modules A, B and C include customized automatic weather stations, (Doppler) lidars and ceilometers, scintillometers, balloon radio sounding and spectral camera imaging. Systems are street-light-mounted, located on building roof-tops or indoors as well as on mobile platforms (vehicles, drones). Data ingestion processes are automated, delivering moderate data volumes in real-time to central data infrastructure through mobile phone and IOT connectivity. A meta data system helps keep track of the location and configuration of all deployed components and forms the backbone for conversion of instrument records into location-aware, conventions-aligned and quality-assured F.A.I.R. data products. Furthermore, the data management infrastructure provides services (APIs, Apps, IDEs, etc.) for data inspection and computations by scientists and students involved in the campaigns. Select datasets are integrated in near real-time into other global or local data systems such as, e.g., AERONET, the Phenocam Network, ICOS, or PANAME, for multiple uses.Besides technical aspects and design considerations, we discuss how cooperation and attribution are safeguarded when data are being accessed for immediate academic and citizen data science.
<p>During heat waves, urban dwellers are exposed to elevated temperatures, especially during night-time when urban heat island (UHI) effects are most intense. Climate change is expected to further increase heat-stress hazards. There are only few studies that have investigated how UHI effects interfere with heat waves. Here, we present results from a sensitivity study in which we analyse non-linear effects of elevated meso-scale temperature forcing on micro-scale atmospheric processes. The study employs the large eddy simulation model PALM-4U. The &#8216;Tempelhofer Feld&#8217; in Berlin, Germany, the largest park within the city, was used as study area. Starting point was a 24 h (plus 6 h spin-up) control simulation followed by a scenario simulation in which all temperature variables, not only air temperature, were increased by 1 K. The control simulation was configured to represent a real weather situation in an idealized form. Grid spacing was set to 10 m horizontally and 2 m vertically to resolve buildings and trees. A residential area to the east of the airport was simulated with a higher horizontal grid resolution of 2 m to investigate micro-scale atmospheric processes in more detail. The results show that the micro-scale response of near-surface air temperature to elevated meso-scale temperature forcing is not constant throughout the day with lower values during day-time and higher values during night-time, particularly in the early evening. In both simulations, the night-time inversion over the park continues into the settlement above the roof level. The study shows that there are weak non-linear effects leading to an amplification of the UHI during night-time. However, as linear effects dominate, adaptation measures with regard to heat stress may be planned on the basis of current weather and climate conditions, additionally documented by observational data, and subsequently evaluated by urban climate monitoring.</p>
 Dieter Scherer合作论文数Chair Climatol, Tech Univ Berlin34
 Daniel Fenner合作论文数Chair Environm Meteorol, Univ Freiburg27
 Marco Otto合作论文数11
 Achim Holtmann合作论文数11
 Andreas Christen合作论文数university of british columbia11
 britta janicke合作论文数, Braunschweig, Germany.8
 Matthias J. Zeeman合作论文数Institute of Plant Sciences;ETH Zurich8
 Stenka Vulova合作论文数Geoinformat Environm Planning Lab, Tech Univ Berlin7
 Nektarios Chrysoulakis合作论文数Inst Appl & Computat Math, Fdn Res & Technol Hellas FORTH7
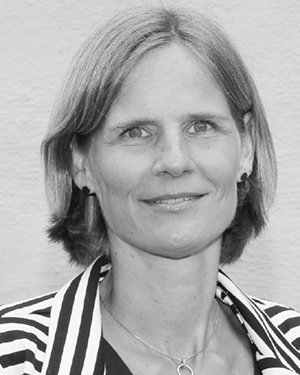 Birgit Kleinschmit合作论文数Technical University of Berlin;Institute of Landscape Architectur and Environmental Planning;Institute of Landscape Architectur and Environmental Planning, Technical University of Berlin7
 Sue Grimmond合作论文数Department of Meteorology, School of Mathematical & Physical Sciences, University of Reading7Alby Duarte Rocha合作论文数6
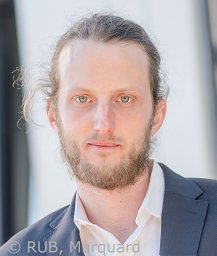 Benjamin Bechtel合作论文数Institute of Geography;Physical Geography, Section;University of Hamburg;Institute of Geography, University of Hamburg6
 U. Fehrenbach合作论文数6Tom Grassmann合作论文数5
 Hamideh Nouri合作论文数Department of Crop Sciences, University of Göttingen5
 Simone Kotthaus合作论文数Laboratoire de Météorologie Dynamique, École Polytechnique5
 Stephan Weber合作论文数Department of Immunology, Max-Planck-Institute for Infection Biology5
 Erika von Schneidemesser合作论文数Chemistry Department, University of Leicester5William J. Morrison合作论文数The Neuroimmunology Research Laboratory, Veterans Administration Medical Center;and the Departments of Pharmacology, Neurology, and Microbiology/Immunology, Oregon Health Sciences University;Veterans Administration Medical Center, Oregon Health Sciences University5Guillermo Villena合作论文数of Chemistry and Biology;University of Santiago de Chile;Chemistry and Biology, University of Santiago de Chile5
 Dörthe Tetzlaff合作论文数Geographisches Institut, Mathematisch-Naturwissenschaftliche Fakultat,;Humboldt-Universitat zu Berlin;Department of Ecohydrology & Biogeochemistry, Leibniz-Institute of Freshwater Ecology and Inland Fisheries4
 Robert Wegener合作论文数4
 Chris Soulsby合作论文数School of Geosciences, University of Aberdeen4
 Gerard Johannes Steeneveld (Gert Jan Steeneveld)合作论文数Division of Meteorology and Air Quality, Department of Environmental Sciences, Wageningen University4
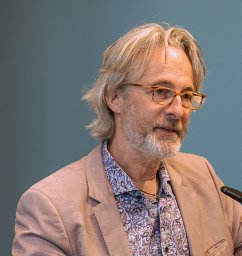 Christoph Schneider合作论文数Department of Geography;Aachen University;Department of Geography, Aachen University4Dieter Klemp合作论文数4
 Aaron Andrew Smith合作论文数3Katharina Scherber合作论文数3Ines Langer合作论文数3Alexander Krug合作论文数3
 Jonas Kittner合作论文数Urban Climatol Grp, Ruhr Univ Bochum3Lars Gerling合作论文数3Benjamin Schmidt合作论文数3
 Sean Schmitz合作论文数3
 Mikael Gillefalk合作论文数Department of Ecohydrology, Leibniz Institute of Freshwater Ecology and Inland Fisheries3
 Sebastian Schubert合作论文数Humboldt Univ, Geog Dept, Berlin, Germany3
 Reinhard Hinkelmann合作论文数Universität Hannover Institut für Strömungsmechanik und Elektronisches Rechnen3
 Sahar Sodoudi合作论文数Department of Meteorology, Free University of Berlin3
 Thomas Ruhtz合作论文数Free University of Berlin;Institute for Space Sciences;Institute for Space Sciences, Free University of Berlin3
 Swen M. Metzger合作论文数Biogeochemistry and Air Chemistry Departments, Max Planck Institute for Chemistry, Mainz, Germany3
 Janet F Barlow合作论文数Department of Meteorology;University of Reading;Department of Meteorology, University of Reading3
 Alexandre Caseiro合作论文数Institute of Chemical Technologies and Analytics, Vienna University of Technology3
 Leena Jarvi合作论文数Department of Physical Sciences;University of Helsinki3Igor Langer合作论文数2Gregor Feigel合作论文数2
 Joern Birkmann合作论文数2Björn Büter合作论文数2Christopher Holst合作论文数2




