The validation and calibration of earthquake loss models require reliable impact data, which are often unavailable or lack sufficient detail. We describe the development of an open global database of damage, loss, and ground shaking data for significant historical earthquakes, building on the earlier efforts of the U.S. Geological Survey's ShakeMap Atlas. This database advances the current availability of earthquake data by providing information about both the impact and the estimated/recorded ground shaking in the region, as well as useful models to develop earthquake scenarios in the OpenQuake-engine. The database currently includes more than 100 historical earthquakes covering information about damaged buildings, economic losses, the number of fatalities and injuries, and the population left homeless. Moreover, it provides rupture solutions and recorded ground motion parameters in the OpenQuake format to allow the generation of cross-correlated ground motion fields and the estimation of damages and losses. We discuss the observed drivers of earthquake impact and provide recommendations to improve data collection protocols. All data are available through a public repository at: https://github.com/gem/geid.
We examine responses to the U.S. Geological Survey’s “Did You Feel It?” (DYFI) survey and its companion earthquake early warning (EEW) questionnaire to assess the performance of the U.S. ShakeAlert EEW system directly from the alert recipients’ perspectives. ShakeAlert rapidly detects earthquakes and develops alert information, but as official alert delivery partners issue these alerts, it is difficult to determine how many people were alerted and when. We investigate DYFI reports for six California earthquakes that had EEW alerts and substantial responses to the DYFI EEW questionnaire. Comparisons of ShakeAlert predictions to reported intensities demonstrate that magnitude estimation accuracy is not necessarily indicative of ground-motion prediction accuracy. Perceived warning time distributions from DYFI indicate that estimating maximum-expected warning times using the S-wave arrival is reasonable for discussing public EEW performance. However, we also find many reports of shorter warning times, late alerts, and missed alerts than expected based on ShakeAlert publication times, indicating alert delivery latencies are substantial and highly variable. The novelty of our analysis is that we demonstrate that the DYFI EEW survey provides useful EEW efficacy information, independent of the specific alerting pathway, that can be used to inform our choices for conveying EEW performance.
ABSTRACT Seismic networks are fundamental to compute ground shaking in regions affected by destructive events, which can then be used for damage and loss assessment. Ground-motion data recordings can be used to estimate the event bias (or interevent residual) for one or multiple ground-motion models, as well as to condition the ground-shaking estimation process to reduce the intraevent residuals at sites near seismic stations. We evaluate how the error in the estimation of the event bias and ground shaking for a set of target sites can be reduced by incorporating an increasing number of seismic stations, using recordings from the 1999 M 7.7 Chi-Chi, Taiwan, earthquake and a large set of ground-motion fields for Taiwan using stochastic simulations. Then, we evaluate how the incorporation of data from seismic stations in the estimation of several impact metrics (i.e., economic losses, collapsed buildings, and fatalities) can reduce both the bias and the uncertainty, using the district of Lisbon (Portugal) as a case study. The results from this study indicate that the error in the estimation of the impact metrics can be reduced by one order of magnitude if at least 10 stations are considered, especially if the configuration of the seismic network considers the location of vulnerable buildings or the spatial distribution of earthquake risk.
The U.S. Geological Survey (USGS) provides rapid (within 30 min) estimates of earthquake-induced impacts and ground failure following significant events. These products are based solely on pre-event data and event-specific shaking estimates and do not include direct observations of building damage, casualties, or ground failure following an earthquake. To this end, the USGS is developing an intermediate-timeframe (within days to a week) pipeline for post-earthquake products that combines the current rapid estimation products with post-event observations to identify the most affected areas more accurately. As a vital component of this pipeline, the USGS is developing in-house capabilities to identify post-earthquake building damage and ground failure using Interferometric synthetic aperture radar (InSAR) coherence-based change detection maps (CDMs). We have previously shown that high-quality CDMs—in conjunction with accurate building footprints, prior building damage, and ground failure model estimates—improve upon a priori models of building damage and help differentiate building damage from ground failure effects. However, there is no standardized method for CDM generation, and approaches can vary substantially in computational cost and storage requirements. In this study, we evaluate the trade-offs between different CDM generation methods by assessing: (1) the number of pre-event images and coherence pairs, (2) the specific change detection method, and (3) earthquake-specific factors such as regional climate and timing relative to seasonal cycles. To quantify the accuracy of the different CDM generation methods, we compare our results with direct observations of building damage and ground failure data from three large events: the 2021 Haiti earthquake, the 2023 Morocco earthquake, and the 2023 Türkiye/Syria earthquake sequence. This work is an important step towards incorporating valuable post-event observations into near-real-time USGS earthquake products.
The 28 March 2025 moment magnitude (Mw) 7.7 earthquake in Mandalay, Burma (Myanmar), ruptured 475 kilometers of the Sagaing Fault, which was more than twice the length predicted by magnitude scaling relationships. Kinematic slip models and observation of a Rayleigh Mach wave that passed through parts of Thailand confirmed that rupture occurred at supershear velocities of greater than 5 kilometers per second. The anomalous length exposed a vast population to violent near-fault shaking. The Mandalay earthquake is a modern analog for the Mw 7.9 1906 San Francisco earthquake, another atypically long and fast rupture. Probabilistic seismic hazard analyses use scaling relations that do not account for such long ruptures at moderate magnitudes. This limitation, in conjunction with a likely increased population and infrastructure exposure for atypically long ruptures, contributes to a potential mischaracterization of seismic risk.
On February 6, 2023, a major earthquake of 7.8 magnitude and its aftershocks caused widespread destruction in Turkey and Syria, causing more than 55,000 deaths, displacing 3 million people in Turkey and 2.9 million in Syria, and destroying or damaging at least 230,000 buildings. Our research presents detailed city-scale maps of landslides, liquefaction, and building damage from this earthquake, utilizing a novel variational causal Bayesian network. This network integrates InSAR-derived change detection with new empirical ground failure models and building footprints, enabling us to (1) rapidly estimate large-scale building damage, landslides, and liquefaction from remote sensing data, (2) jointly attribute building damage to landslides, liquefaction, and shaking, (3) improve regional landslide and liquefaction predictions impacting infrastructure, and (4) simultaneously identify damage degrees in thousands of buildings. For city-scale, building-by-building damage assessments, we use building footprints and satellite imagery with a spatial resolution of approximately 30 meters. This allows us to achieve a high resolution in damage assessment, both in timeliness and scale, enabling damage classification at the individual building level within days of the earthquake. Our findings detail the extent of building damage, including collapses, in Hatay, Osmaniye, Ad & imath;yaman, Gaziantep, and Kahramanmaras. We classified building damages into five categories: no damage, slight, moderate, partial collapse, and collapse. We evaluated damage estimates against preliminary ground-truth data reported by the civil authorities. Our results demonstrate the accuracy of our classification system, as evidenced by the area under the curve (AUC) scores on the receiver operating characteristic (ROC) curve, which ranged from 0.9588 to 0.9931 across different damage categories and regions. Specifically, our model achieved an AUC of 0.9931 for collapsed buildings in the Hatay/Osmaniye area, indicating a 99.31% probability that the model will rank a randomly chosen collapsed building higher than a randomly chosen non-collapsed building. These accurate, building-specific damage estimates, with greater than 95% classification accuracy across all categories, are crucial for disaster response and can aid agencies in effectively allocating resources and coordinating efforts during disaster recovery.
Accurate damage estimation after earthquakes is crucial for effective post-disaster response and recovery. However, earthquakes often trigger various additional hazards, such as landslides and liquefaction, making accurate building damage estimation even more challenging. To date, despite significant research efforts, automated, accurate building-specific damage estimation has not been achieved. Our study tackles this challenge. We integrate multi-sourced global building footprints and InSAR coherence-based Change Detection Maps (CDMs) generated by the U.S. Geological Survey (USGS) within a variational causal Bayesian network, providing intricate maps of landslides, liquefaction, and building damage. Our key innovations include: 1) a novel masking strategy for the CDMs, derived from low pre-event mean coherence value and high pre-event coherence standard deviation to eliminate noisy signals in InSAR products induced by irrelevant noise sources (steep slopes, soil moisture and vegetation change, open water, etc.), and 2) variational inference to differentiate potential causes of the changes in InSAR coherence signals, specifically landslides, liquefaction, building damage, and non-hazard changes. Our strategy is critical for enhancing the accuracy of building damage and ground failure assessments, as noise from environmental or human-induced changes can obscure true damage signals. We provide reliable damage identification with attribution to specific causes by focusing on accurate building footprints and improving regional ground failure predictions using the 2023 M6.8 Morocco earthquake to validate our methodology. Our approach enables thorough damage analysis across numerous buildings, with the potential for significantly aiding disaster management and marking a substantial advancement of post-earthquake building damage assessment methods.
When a damaging earthquake occurs, immediate information about casualties is critical for time-sensitive decision-making by emergency response and aid agencies in the first hours and days. Systems such as Prompt Assessment of Global Earthquakes for Response (PAGER) by the U.S. Geological Survey (USGS) were developed to provide a forecast within about 30 minutes of any significant earthquake globally. Traditional systems for estimating human loss in disasters often depend on manually collected early casualty reports from global media, a process that's labor-intensive and slow with notable time delays. Recently, some systems have employed keyword matching and topic modeling to extract relevant information from social media. However, these methods struggle with the complex semantics in multilingual texts and the challenge of interpreting ever-changing, often conflicting reports of death and injury numbers from various unverified sources on social media platforms. In this work, we introduce an end-to-end framework to significantly improve the timeliness and accuracy of global earthquake-induced human loss forecasting using multi-lingual, crowdsourced social media. Our framework integrates (1) a hierarchical casualty extraction model built upon large language models, prompt design, and few-shot learning to retrieve quantitative human loss claims from social media, (2) a physical constraint-aware, dynamic-truth discovery model that discovers the truthful human loss from massive noisy and potentially conflicting human loss claims, and (3) a Bayesian updating loss projection model that dynamically updates the final loss estimation using discovered truths. We test the framework in real-time on a series of global earthquake events in 2021 and 2022 and show that our framework streamlines casualty data retrieval, achieving speed and accuracy comparable to manual methods by USGS.
Archival earthquake studies often focus on event and source characteristics for use in earthquake catalogs, seismotectonic understanding, and ground-motion studies—many of these targeting better constraints for probabilistic seismic-hazard analyses. The ShakeMap Atlas, in contrast, focuses on spatial distribution of shaking for the historical events, providing the best constraints at all locations that experienced significant shaking for each event, facilitating analyses of human experience, damage, and induced hazards (ground failure). The aim of the Atlas is to gain a general understanding and depiction of the shaking distribution for a suite of canonical earthquakes, and, coupled with loss data for each event, to provide a basis for earthquake loss model calibration, among other uses. Although the initial motivation for developing the ShakeMap Atlas was calibrating the U.S. Geological Survey (USGS) Prompt Assessment of Global Earthquakes for Response system, over time, the Atlas has proved to be a useful tool for its users, and, as such, its scope has been vastly expanded in this newest version. The fourth version of the USGS ShakeMap Atlas is an openly available compilation of over 14,000 ShakeMaps of significant global earthquakes between 1900 and 2020. This revision includes: (1) the latest version of the ShakeMap software that provides refined uncertainty estimations and improved methods to combine macroseismic observations with updated ground-motion models; (2) an updated earthquake source catalog; (3) a refined strategy to select suites of prediction and conversion equations based on a new seismotectonic regionalization scheme; and (4) expanded macroseismic intensity and ground-motion datasets. We also tabulate reported economic losses and fatalities for Atlas events where such data are openly available. These changes make the new ShakeMap Atlas a self-consistent, calibrated catalog invaluable for investigating near-source ground motions, as well as seismic hazard, scenario, risk, and loss-model development and testing.
A magnitude 5.1 earthquake in California rarely generates more than momentary notice—a headline in local newspapers and a mention with footage on the evening news—then fades into obscurity for most people. But this earthquake, which occurred near the city of Ojai, is important for seismologists, social scientists, emergency managers, policymakers, and others who are engaged in implementing and improving earthquake early warning (EEW) technology and in assessing its value in public warnings. In this earthquake, ShakeAlert, the EEW system for the West Coast of the United States operated by the U.S. Geological Survey (USGS), was publicly activated and, for the first time, a substantial number of those who received alerts provided feedback on various aspects of the alerts they received. To capture data related to public attitudes and assessments regarding this and future alerts, a supplemental questionnaire was developed and associated with the “Did You Feel It?” (DYFI) earthquake reporting system, also operated by the USGS. The DYFI system received over 14,000 felt reports; 2490 of these were by people who received or expected to receive an alert before the onset of earthquake motion at their locations. This article analyzes the aggregate results of these EEW user reports, touching on the respondent’s situation upon receiving the alert, characteristics of the alert received, and, perhaps, most importantly, how the alert recipient responded if received before feeling earthquake motion. The new DYFI EEW supplemental questionnaire also inquired about respondent views of alert usefulness and preferences in future alerts. Our report provides a first glimpse of a range of behaviors, attitudes, and assessments by users of the recently implemented EEW system for the U.S. West Coast.
The 17 January 1994 Northridge, California, earthquake was a watershed event with far-reaching societal and scientific impacts. The earthquake, which occurred in the early days of both broadband seismic networks and the Internet, spurred advances in seismic monitoring, real-time systems, and development of data products. Motivated by the 30th anniversary of the earthquake, we present a brief retrospective of the earthquake and its impact, and reconsider both ground motions and the aftershock distribution using modern tools and the best-available data. With improvements in instrumentation and analysis methodology, recent earthquakes continue to reveal the increasing complexity of ground motions, fault systems, and earthquake ruptures. Even in the absence of data from state-of-the-art instrumentation, a retrospective consideration of ground-motion data from the Northridge earthquake reveals complexities beyond what could be characterized (and modeled) 30 yr ago. Aftershock relocations for both the 1971 Sylmar and 1994 Northridge earthquakes also reveal an updated view of fault complexity. Our study does provide a cautionary tale regarding legacy data sets and research results that are not easily accessible, which can result in discrepancies between catalog data and products from the best available science. We also briefly describe outreach products produced as a part of the anniversary commemoration.
Modern research often involves the collection or analysis of data and the use of specialized computer algorithms. Traditional text articles thus provide only partial documentation of a research study. Readers have limited ability to reproduce or utilize work if the source data are not available or if it relies on an algorithm that is described, but code is not provided. Fortunately, a wide variety of tools are now available to support the publication of research data and code. The effort required to publish data is now relatively small, and the benefits can be immense. This opinion article discusses trends toward increased sharing in academic publishing. It describes opportunities and resources to support data and code sharing and describes the benefits for both authors and readers. Finally, it discusses how Earthquake Spectra is providing resources and enhancing its policies to establish the sharing of data as the default procedure when publishing in the journal, and encourage the sharing of code and other resources.
Reliable and rapid impact assessment for large earthquakes is a challenge because it is difficult to rapidly determine the fault geometry and thus the spatial distribution of shaking intensities. In this retrospective study of the M 7.8 Kahramanmara & scedil;- Pazarc & imath; k, T & uuml;rkiye, earthquake, we evaluate how eyewitness observations crowdsourced through the LastQuake system can improve such assessments. These data consist of felt reports describing the local level of shaking or damage and manually validated geolocated imagery. In the first part of this study, the methods used to derive macroseismic intensity values from felt reports, particularly for high values, are validated by comparison with independently determined intensities. This comparison confirms that the maximum intensity that can be derived from felt reports does not generally exceed VIII. A fatality estimate of 3000 could be made within a few hours by evaluating the number of people exposed to high intensities using the felt reports and assuming a point source. However, this estimate was known to be an underestimate because of the point-source approximation; this underestimate was also confirmed by the geolocated imagery showing high levels of damage at epicentral distances well beyond those predicted by circular isoseismals. However, improved estimates could have been derived from the event 's ShakeMaps using the U.S. Geological Survey Prompt Assessment of Global Earthquakes for Response (PAGER) fatality loss-modeling system, either by incorporating the felt reports into the ShakeMaps computation or using, in addition, a finite-source (here line-source) model derived from the felt reports using the Finite-fault rupture Detector software. The inclusion of fault geometry would have resulted in a fatality estimate with data collected within 10 min of the origin determination, which was consistent with the final PAGER alert level and the reported death toll that were both only known days later. Although more work would be helpful to assess the reliability of the derived fault geometry, in regions where they are collected in large numbers, felt reports collected within 10 min of the earthquake can be used to substantially improve current fatality estimates.
Sudden-onset hazards like earthquakes often induce cascading secondary hazards (e.g., landslides, liquefaction, debris flows, etc.) and subsequent impacts (e.g., building and infrastructure damage) that cause catastrophic human and economic losses. Rapid and accurate estimates of these hazards and impacts are critical for timely and effective post-disaster responses. Emerging remote sensing techniques provide pre- and post-event satellite images for rapid hazard estimation. However, hazards and damage often co-occur or colocate with underlying complex cascading geophysical processes, making it challenging to directly differentiate multiple hazards and impacts from satellite imagery using existing single-hazard models. We introduce DisasterNet, a novel family of causal Bayesian networks to model processes that a major hazard triggers cascading hazards and impacts and further jointly induces signal changes in remotely sensed observations. We integrate normalizing flows to effectively model the highly complex causal dependencies in this cascading process. A triplet loss is further designed to leverage prior geophysical knowledge to enhance the identifiability of our highly expressive Bayesian networks. Moreover, a novel stochastic variational inference with normalizing flows is derived to jointly approximate posteriors of multiple unobserved hazards and impacts from noisy remote sensing observations. Integrating with the USGS Prompt Assessment of Global Earthquakes for Response (PAGER) system, our framework is evaluated in recent global earthquake events. Evaluation results show that DisasterNet significantly improves multiple hazard and impact estimation compared to existing USGS products.
When a notable earthquake occurs in the United States, a range of familiar real- and near-real-time products are produced by the U.S. Geological Survey (USGS) Advanced National Seismic System (ANSS), and made available via the ANSS Comprehensive Earthquake Catalog. For historical and early instrumental earthquakes, similar results and products are developed depending on data availability and event significance, drawing from published later studies. The year 2023 marked the ninetieth anniversary of the 11 March 1933 Long Beach, California, earthquake. This anniversary provided the impetus to update ANSS products, drawing on archived and published data. Here, we describe the updated ShakeMap, shaking recordings and intensities, and retrospective aftershock forecast for the Long Beach, California, earthquake. In effect we have developed standard, modern ANSS products for an earthquake that occurred 90 yr ago. Our results show that the distributions of both the ground motions, anchored by three strong-motion recordings, and aftershock magnitudes are consistent with expectations for an M 6.4 mainshock in Southern California. We show that, notwithstanding possible limitations, instrumentally recorded accelerations from the closest station are consistent with predicted shaking and directly estimated macroseismic intensities. Updated data products have been added to the USGS event page, where they are available for download. Public-facing products were also created for the anniversary and are freely available on the USGS website.
Abstract The primary ingredients on the hazard side of the equation include the rapid characterization of the earthquake source and quantifying the spatial distribution of the shaking, plus any secondary hazards an earthquake may have triggered. On the earthquake impact side, loss calculations require the aforementioned hazard assessments—and their uncertainties—as input, plus the quantification of the exposure and vulnerability of structures, infrastructure, and the affected inhabitants. Lastly, effectively communicating uncertain estimates of the resulting impacts on society requires careful consideration of its function and form. All these aspects of rapid earthquake information delivery entailed wide‐ranging collaborative research and development among seismologists, earthquake engineers, geographers, social scientists, Information Technology professionals, and communication experts, leveraging diverse components and ingredients not achievable without extensive collaboration. I was very fortunate to be able to work on interesting and useful projects with many colleagues who got involved with them. Advances in content, its rapid delivery, and our ability to better communicate uncertain loss estimates greatly expanded the range of users and critical decision‐makers who could directly benefit from rapid post‐earthquake information. Moreover, in the critical user–developer feedback loop, we have intently followed requests from users to develop new ways of delivering the most‐requested post‐earthquake information within the limitations of the science and technology. Such new avenues and tools then motivated and prioritized additional research directions and developments.
Research Article| September 13, 2023 Introduction to the Special Section for the Centennial of the Great 1923 Kanto, Japan, Earthquake Hiroe Miyake; Hiroe Miyake * 1Earthquake Research Institute, The University of Tokyo, Tokyo, Japan *Corresponding author: hiroe@eri.u-tokyo.ac.jp https://orcid.org/0000-0002-8354-6281 Search for other works by this author on: GSW Google Scholar James J. Mori; James J. Mori 2Disaster Prevention Research Institute, Kyoto University, Kyoto, Japan Search for other works by this author on: GSW Google Scholar David J. Wald; David J. Wald 3U.S. Geological Survey, Golden, Colorado, U.S.A. https://orcid.org/0000-0002-1454-4514 Search for other works by this author on: GSW Google Scholar Hiroshi Kawase; Hiroshi Kawase 2Disaster Prevention Research Institute, Kyoto University, Kyoto, Japan Search for other works by this author on: GSW Google Scholar Shinji Toda; Shinji Toda 4International Research Institute of Disaster Science, Tohoku University, Miyagi, Japan Search for other works by this author on: GSW Google Scholar P. Martin Mai P. Martin Mai 5Division of Physical Sciences and Engineering, King Abdullah University of Science and Technology, Thuwal, Saudi Arabia https://orcid.org/0000-0002-9744-4964 Search for other works by this author on: GSW Google Scholar Author and Article Information Hiroe Miyake https://orcid.org/0000-0002-8354-6281 * 1Earthquake Research Institute, The University of Tokyo, Tokyo, Japan James J. Mori 2Disaster Prevention Research Institute, Kyoto University, Kyoto, Japan David J. Wald https://orcid.org/0000-0002-1454-4514 3U.S. Geological Survey, Golden, Colorado, U.S.A. Hiroshi Kawase 2Disaster Prevention Research Institute, Kyoto University, Kyoto, Japan Shinji Toda 4International Research Institute of Disaster Science, Tohoku University, Miyagi, Japan P. Martin Mai https://orcid.org/0000-0002-9744-4964 5Division of Physical Sciences and Engineering, King Abdullah University of Science and Technology, Thuwal, Saudi Arabia *Corresponding author: hiroe@eri.u-tokyo.ac.jp Publisher: Seismological Society of America First Online: 13 Sep 2023 Online ISSN: 1943-3573 Print ISSN: 0037-1106 © Seismological Society of America Bulletin of the Seismological Society of America (2023) 113 (5): 1821–1825. https://doi.org/10.1785/0120230200 Article history First Online: 13 Sep 2023 Cite View This Citation Add to Citation Manager Share Icon Share Facebook Twitter LinkedIn Email Permissions Search Site Citation Hiroe Miyake, James J. Mori, David J. Wald, Hiroshi Kawase, Shinji Toda, P. Martin Mai; Introduction to the Special Section for the Centennial of the Great 1923 Kanto, Japan, Earthquake. Bulletin of the Seismological Society of America 2023;; 113 (5): 1821–1825. doi: https://doi.org/10.1785/0120230200 Download citation file: Ris (Zotero) Refmanager EasyBib Bookends Mendeley Papers EndNote RefWorks BibTex toolbar search Search Dropdown Menu toolbar search search input Search input auto suggest filter your search All ContentBy SocietyBulletin of the Seismological Society of America Search Advanced Search The 1 September 1923 Mw 7.9 Great Kanto earthquake was an extremely disastrous event well known to seismologists and the public, especially in Japan (e.g., Midorikawa, 2002; Moroi and Takemura, 2002). Although the source area and magnitude are smaller than a number of other great earthquakes in Japan, including the 2011 Mw 9.0 Tohoku–Oki, the 1944 Mw 8.1 Toankai, and the 1946 Mw 8.2 Nankai earthquakes, the proximity to Tokyo and Yokohama caused much more damage and killed many more people (nearly 105,000; Takemura, 2003; Moroi and Takemura, 2004) than other earthquakes... You do not have access to this content, please speak to your institutional administrator if you feel you should have access.
Onsite disasters like earthquakes can trigger cascading hazards and impacts, such as landslides and infrastructure damage, leading to catastrophic losses; thus, rapid and accurate estimates are crucial for timely and effective post-disaster responses. Interferometric Synthetic aperture radar (InSAR) data is important in providing high-resolution onsite information for rapid hazard estimation. Most recent methods using InSAR imagery signals predict a single type of hazard and thus often suffer low accuracy due to noisy and complex signals induced by co-located hazards, impacts, and irrelevant environmental changes (e.g., vegetation changes, human activities). We introduce a novel stochastic variational inference with normalizing flows derived to jointly approximate posteriors of multiple unobserved hazards and impacts from noisy InSAR imagery.
The 6 February 2023 Mw 7.8 Pazarc & imath;k and subsequent Mw 7.5 Elbistan earthquakes generated strong ground shaking that resulted in catastrophic human and economic loss across south-central T & uuml;rkiye and northwest Syria. The rapid characterization of the earthquakes, including their location, size, fault geometries, and slip kinematics, is critical to estimate the impact of significant seismic events. The U.S. Geological Survey National Earthquake Information Center (NEIC) provides real-time monitoring of earthquakes globally, including rapid source characterization and impact estimates. Here, we describe the seismic characterization products generated and made available by the NEIC over the two weeks following the start of the earthquake sequence in southeast T & uuml;rkiye, their evolution, and how they inform our understanding of regional seismotectonics and hazards. The kinematics of rupture for the two earthquakes was complex, involving multiple fault segments. Therefore, incorporating observations from rupture mapping was critical for characterizing these events. Dense local datasets facilitated robust source characterization and impact assessment once these observations were obtained and converted to NEIC product input formats. We discuss how we may improve the timeliness of NEIC products for rapid assessment of future seismic hazards, particularly in the case of complex ruptures.
Earthquake early warning (EEW) systems are relatively new technologies having first emerged as regional systems in the 1990s. Japan was the first nation to develop and implement a nationwide system in October 2007, and in the United States, ShakeAlert® became available on the entire length of the US West Coast in May 2021. Assessing how EEW is perceived and utilized by alert recipients is considered essential. Such assessments are necessary to evaluate whether alert recipients are taking advantage of alert messages to initiate protective actions upon receipt of an alert, how they regard the usefulness of alerts, desirable thresholds for issuing alerts, and other aspects of these systems. Having information from users will also facilitate assessments of the success of earthquake preparedness educational programs such as the ShakeOut and whether annual drills which include information on EEW systems are resulting in behavioral response consistent with the content of these programs. Finally, information on EEW utilization will provide data useful to social scientists who study hazards to advance our understanding of behavioral response to warnings. Survey research in the aftermath of a significant earthquake in which an EEW has been issued is one obvious method of achieving these objectives and there already exist a number of survey instruments for this purpose. A related strategy and the goal of the present research is to develop a brief questionnaire, consistent with those already developed, as a supplement to the United States Geological Survey’s “Did You Feel It?” questionnaire that has provided earthquake intensities and information on behavioral response in earthquakes, both domestic and international, since 2004. Having the intensity level at each respondent’s location is essential for relating their perspectives and actions to the shaking they experienced.
 Kishor Jaiswal合作论文数Department of Civil Engineering;Indian Institute of Technology Bombay;Department of Civil Engineering, Indian Institute of Technology Bombay50
 Paul S. Earle合作论文数U. S. Geological Survey;National Earthquake Information Center;U. S. Geological Survey, National Earthquake Information Center43
 Bruce Worden合作论文数U. S. Geological Survey;National Earthquake Information Center;U. S. Geological Survey, National Earthquake Information Center38Kuo-Wan Lin合作论文数37v r quitoriano合作论文数US Geol Survey, Natl Earthquake Informat Ctr34
 Eric M Thompson合作论文数Sars International Centre for Marine Molecular Biology;Bergen High Technology Centre;Max Planck Institute for Molecular Genetics;Max Planck Institute for Molecular Genetics, Bergen High Technology Centre29Gavin P. Hayes合作论文数Geologic Hazards Science Center, Synergetics Inc.25Michael Hearne合作论文数17James W. Dewey合作论文数16
 Thomas H. Heaton (Thomas Heaton)合作论文数Division of Geological and Planetary Sciences, California Institute of Technology16Trevor I. Allen合作论文数15
 Donald V. Helmberger合作论文数Seismological Laboratory, Division of Geological and Planetary Sciences, California Institute of Technology15Loren L. Turner合作论文数15Kristin D. Marano合作论文数14Lisa A. Wald合作论文数14
 Chen Ji合作论文数13Harley M. Benz合作论文数12
 Kate Allstadt合作论文数Geol Hazards Sci Ctr, US Geol Survey11
 Hiroo Kanamori合作论文数Division of Geological and Planetary Sciences, California Institute of Technology10
 Nicolas Luco合作论文数Geologic Hazards Science Center, U.S. Geological Survey10
 Randall W. Jibson (Randall Jibson)合作论文数United States Geological Survey10Robert W. Graves合作论文数10
 Susu Xu合作论文数8
 Jonathan W. Godt合作论文数U. S. Geological Survey;Denver Federal Center;U. S. Geological Survey, Denver Federal Center8
 William Yeck合作论文数US Geol Survey, Natl Earthquake Informat Ctr8
 Keith Porter合作论文数Department of Civil, Environmental and Architectural Engineering, College of Engineering and Applied Science, University of Colorado Boulder8
 Richard W. Briggs合作论文数Center for Neotectonic Studies;University of Nevada;Center for Neotectonic Studies, University of Nevada8d garcia合作论文数7Margaret G Hopper合作论文数7Keith L. Knudsen合作论文数6
 William Barnhart合作论文数Department of Radiology, University of Iowa Hospitals and Clinics6
 Mark D. Petersen合作论文数U.S. Geological Survey6Xuechun Li合作论文数5Daniel Slosky合作论文数5Jing Zhu合作论文数Dept Civil & Environm Engn, Tufts Univ5
 James D. Goltz合作论文数5
 Hakan Tanyas合作论文数Faculty of Geo-Information Science and Earth Observation (ITC),, University of Twente5
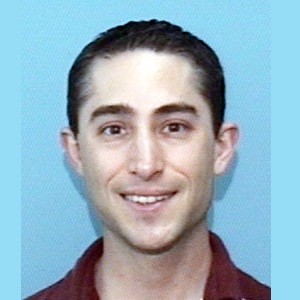 Aron Jeffrey Meltzner合作论文数Asian School of the Environment, Nanyang Technological University5
 Hae Young Noh合作论文数Department of Civil and Environmental Engineering, School of Engineering, Stanford University;Doerr School of Sustainability, Stanford University5
 Kenneth W. Hudnut合作论文数US Geol Survey5scott haefner合作论文数4D. Bausch合作论文数4K. A. Porter合作论文数4
 Willy Aspinall合作论文数4
 Egill Hauksson合作论文数Geophysics, Division of Geological and Planetary Sciences, California Institute of Technology4
 David Shelly合作论文数Geologic Hazards Science Center, U.S. Geological Survey4
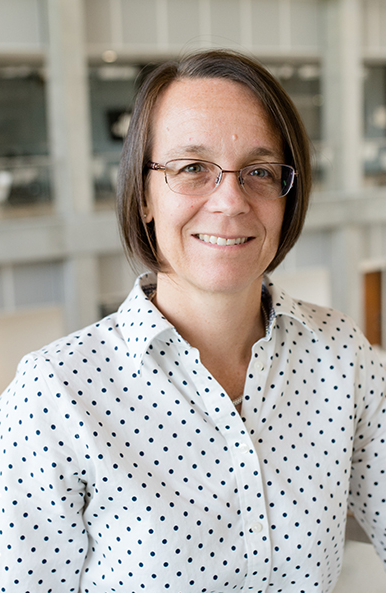 Ellen M. Rathje合作论文数Maseeh Department of Civil, Architectural and Environmental Engineering, Cockrell School of Engineering, The University of Texas at Austin4
 Paul Somerville合作论文数4




