Importance The increasing burden due to cancer and other noncommunicable diseases poses a threat to human development, which has resulted in global political commitments reflected in the Sustainable Development Goals as well as the World Health Organization (WHO) Global Action Plan on Non-Communicable Diseases. To determine if these commitments have resulted in improved cancer control, quantitative assessments of the cancer burden are required. Objective To assess the burden for 29 cancer groups over time to provide a framework for policy discussion, resource allocation, and research focus. Evidence Review Cancer incidence, mortality, years lived with disability, years of life lost, and disability-adjusted life-years (DALYs) were evaluated for 195 countries and territories by age and sex using the Global Burden of Disease study estimation methods. Levels and trends were analyzed over time, as well as by the Sociodemographic Index (SDI). Changes in incident cases were categorized by changes due to epidemiological vs demographic transition. Findings In 2016, there were 17.2 million cancer cases worldwide and 8.9 million deaths. Cancer cases increased by 28% between 2006 and 2016. The smallest increase was seen in high SDI countries. Globally, population aging contributed 17%; population growth, 12%; and changes in age-specific rates, −1% to this change. The most common incident cancer globally for men was prostate cancer (1.4 million cases). The leading cause of cancer deaths and DALYs was tracheal, bronchus, and lung cancer (1.2 million deaths and 25.4 million DALYs). For women, the most common incident cancer and the leading cause of cancer deaths and DALYs was breast cancer (1.7 million incident cases, 535 000 deaths, and 14.9 million DALYs). In 2016, cancer caused 213.2 million DALYs globally for both sexes combined. Between 2006 and 2016, the average annual age-standardized incidence rates for all cancers combined increased in 130 of 195 countries or territories, and the average annual age-standardized death rates decreased within that timeframe in 143 of 195 countries or territories. Conclusions and Relevance Large disparities exist between countries in cancer incidence, deaths, and associated disability. Scaling up cancer prevention and ensuring universal access to cancer care are required for health equity and to fulfill the global commitments for noncommunicable disease and cancer control.
Importance Comprehensive and timely monitoring of disease burden in all age groups, including children and adolescents, is essential for improving population health. Objective To quantify and describe levels and trends of mortality and nonfatal health outcomes among children and adolescents from 1990 to 2015 to provide a framework for policy discussion. Evidence Review Cause-specific mortality and nonfatal health outcomes were analyzed for 195 countries and territories by age group, sex, and year from 1990 to 2015 using standardized approaches for data processing and statistical modeling, with subsequent analysis of the findings to describe levels and trends across geography and time among children and adolescents 19 years or younger. A composite indicator of income, education, and fertility was developed (Socio-demographic Index [SDI]) for each geographic unit and year, which evaluates the historical association between SDI and health loss. Findings Global child and adolescent mortality decreased from 14.18 million (95% uncertainty interval [UI], 14.09 million to 14.28 million) deaths in 1990 to 7.26 million (95% UI, 7.14 million to 7.39 million) deaths in 2015, but progress has been unevenly distributed. Countries with a lower SDI had a larger proportion of mortality burden (75%) in 2015 than was the case in 1990 (61%). Most deaths in 2015 occurred in South Asia and sub-Saharan Africa. Global trends were driven by reductions in mortality owing to infectious, nutritional, and neonatal disorders, which in the aggregate led to a relative increase in the importance of noncommunicable diseases and injuries in explaining global disease burden. The absolute burden of disability in children and adolescents increased 4.3% (95% UI, 3.1%-5.6%) from 1990 to 2015, with much of the increase owing to population growth and improved survival for children and adolescents to older ages. Other than infectious conditions, many top causes of disability are associated with long-term sequelae of conditions present at birth (eg, neonatal disorders, congenital birth defects, and hemoglobinopathies) and complications of a variety of infections and nutritional deficiencies. Anemia, developmental intellectual disability, hearing loss, epilepsy, and vision loss are important contributors to childhood disability that can arise from multiple causes. Maternal and reproductive health remains a key cause of disease burden in adolescent females, especially in lower-SDI countries. In low-SDI countries, mortality is the primary driver of health loss for children and adolescents, whereas disability predominates in higher-SDI locations; the specific pattern of epidemiological transition varies across diseases and injuries. Conclusions and Relevance Consistent international attention and investment have led to sustained improvements in causes of health loss among children and adolescents in many countries, although progress has been uneven. The persistence of infectious diseases in some countries, coupled with ongoing epidemiologic transition to injuries and noncommunicable diseases, require all countries to carefully evaluate and implement appropriate strategies to maximize the health of their children and adolescents and for the international community to carefully consider which elements of child and adolescent health should be monitored.
Importance Liver cancer is among the leading causes of cancer deaths globally. The most common causes for liver cancer include hepatitis B virus (HBV) and hepatitis C virus (HCV) infection and alcohol use. Objective To report results of the Global Burden of Disease (GBD) 2015 study on primary liver cancer incidence, mortality, and disability-adjusted life-years (DALYs) for 195 countries or territories from 1990 to 2015, and present global, regional, and national estimates on the burden of liver cancer attributable to HBV, HCV, alcohol, and an “other” group that encompasses residual causes. Design, Settings, and Participants Mortality was estimated using vital registration and cancer registry data in an ensemble modeling approach. Single-cause mortality estimates were adjusted for all-cause mortality. Incidence was derived from mortality estimates and the mortality-to-incidence ratio. Through a systematic literature review, data on the proportions of liver cancer due to HBV, HCV, alcohol, and other causes were identified. Years of life lost were calculated by multiplying each death by a standard life expectancy. Prevalence was estimated using mortality-to-incidence ratio as surrogate for survival. Total prevalence was divided into 4 sequelae that were multiplied by disability weights to derive years lived with disability (YLDs). DALYs were the sum of years of life lost and YLDs. Main Outcomes and Measures Liver cancer mortality, incidence, YLDs, years of life lost, DALYs by etiology, age, sex, country, and year. Results There were 854 000 incident cases of liver cancer and 810 000 deaths globally in 2015, contributing to 20 578 000 DALYs. Cases of incident liver cancer increased by 75% between 1990 and 2015, of which 47% can be explained by changing population age structures, 35% by population growth, and −8% to changing age-specific incidence rates. The male-to-female ratio for age-standardized liver cancer mortality was 2.8. Globally, HBV accounted for 265 000 liver cancer deaths (33%), alcohol for 245 000 (30%), HCV for 167 000 (21%), and other causes for 133 000 (16%) deaths, with substantial variation between countries in the underlying etiologies. Conclusions and Relevance Liver cancer is among the leading causes of cancer deaths in many countries. Causes of liver cancer differ widely among populations. Our results show that most cases of liver cancer can be prevented through vaccination, antiviral treatment, safe blood transfusion and injection practices, as well as interventions to reduce excessive alcohol use. In line with the Sustainable Development Goals, the identification and elimination of risk factors for liver cancer will be required to achieve a sustained reduction in liver cancer burden. The GBD study can be used to guide these prevention efforts.
Importance:Comprehensive and timely monitoring of disease burden in all age groups, including children and adolescents, is essential for improving population health.Objective:To quantify and describe levels and trends of mortality and nonfatal health outcomes among children and adolescents from 1990 to 2015 to provide a framework for policy discussion.Evidence Review:Cause-specific mortality and nonfatal health outcomes were analyzed for 195 countries and territories by age group, sex, and year from 1990 to 2015 using standardized approaches for data processing and statistical modeling, with subsequent analysis of the findings to describe levels and trends across geography and time among children and adolescents 19 years or younger. A composite indicator of income, education, and fertility was developed (Socio-demographic Index [SDI]) for each geographic unit and year, which evaluates the historical association between SDI and health loss.Findings:Global child and adolescent mortality decreased from 14.18 million (95% uncertainty interval [UI], 14.09 million to 14.28 million) deaths in 1990 to 7.26 million (95% UI, 7.14 million to 7.39 million) deaths in 2015, but progress has been unevenly distributed. Countries with a lower SDI had a larger proportion of mortality burden (75%) in 2015 than was the case in 1990 (61%). Most deaths in 2015 occurred in South Asia and sub-Saharan Africa. Global trends were driven by reductions in mortality owing to infectious, nutritional, and neonatal disorders, which in the aggregate led to a relative increase in the importance of noncommunicable diseases and injuries in explaining global disease burden. The absolute burden of disability in children and adolescents increased 4.3% (95% UI, 3.1%-5.6%) from 1990 to 2015, with much of the increase owing to population growth and improved survival for children and adolescents to older ages. Other than infectious conditions, many top causes of disability are associated with long-term sequelae of conditions present at birth (eg, neonatal disorders, congenital birth defects, and hemoglobinopathies) and complications of a variety of infections and nutritional deficiencies. Anemia, developmental intellectual disability, hearing loss, epilepsy, and vision loss are important contributors to childhood disability that can arise from multiple causes. Maternal and reproductive health remains a key cause of disease burden in adolescent females, especially in lower-SDI countries. In low-SDI countries, mortality is the primary driver of health loss for children and adolescents, whereas disability predominates in higher-SDI locations; the specific pattern of epidemiological transition varies across diseases and injuries.Conclusions and Relevance:Consistent international attention and investment have led to sustained improvements in causes of health loss among children and adolescents in many countries, although progress has been uneven. The persistence of infectious diseases in some countries, coupled with ongoing epidemiologic transition to injuries and noncommunicable diseases, require all countries to carefully evaluate and implement appropriate strategies to maximize the health of their children and adolescents and for the international community to carefully consider which elements of child and adolescent health should be monitored.
Importance The increasing burden due to cancer and other noncommunicable diseases poses a threat to human development, which has resulted in global political commitments reflected in the Sustainable Development Goals as well as the World Health Organization (WHO) Global Action Plan on Non-Communicable Diseases. To determine if these commitments have resulted in improved cancer control, quantitative assessments of the cancer burden are required. Objective To assess the burden for 29 cancer groups over time to provide a framework for policy discussion, resource allocation, and research focus. Evidence Review Cancer incidence, mortality, years lived with disability, years of life lost, and disability-adjusted life-years (DALYs) were evaluated for 195 countries and territories by age and sex using the Global Burden of Disease study estimation methods. Levels and trends were analyzed over time, as well as by the Sociodemographic Index (SDI). Changes in incident cases were categorized by changes due to epidemiological vs demographic transition. Findings In 2016, there were 17.2 million cancer cases worldwide and 8.9 million deaths. Cancer cases increased by 28% between 2006 and 2016. The smallest increase was seen in high SDI countries. Globally, population aging contributed 17%; population growth, 12%; and changes in age-specific rates, −1% to this change. The most common incident cancer globally for men was prostate cancer (1.4 million cases). The leading cause of cancer deaths and DALYs was tracheal, bronchus, and lung cancer (1.2 million deaths and 25.4 million DALYs). For women, the most common incident cancer and the leading cause of cancer deaths and DALYs was breast cancer (1.7 million incident cases, 535 000 deaths, and 14.9 million DALYs). In 2016, cancer caused 213.2 million DALYs globally for both sexes combined. Between 2006 and 2016, the average annual age-standardized incidence rates for all cancers combined increased in 130 of 195 countries or territories, and the average annual age-standardized death rates decreased within that timeframe in 143 of 195 countries or territories. Conclusions and Relevance Large disparities exist between countries in cancer incidence, deaths, and associated disability. Scaling up cancer prevention and ensuring universal access to cancer care are required for health equity and to fulfill the global commitments for noncommunicable disease and cancer control.
BackgroundImproving survival and extending the longevity of life for all populations requires timely, robust evidence on local mortality levels and trends. The Global Burden of Disease 2015 Study (GBD 2015) provides a comprehensive assessment of all-cause and cause-specific mortality for 249 causes in 195 countries and territories from 1980 to 2015. These results informed an in-depth investigation of observed and expected mortality patterns based on sociodemographic measures.MethodsWe estimated all-cause mortality by age, sex, geography, and year using an improved analytical approach originally developed for GBD 2013 and GBD 2010. Improvements included refinements to the estimation of child and adult mortality and corresponding uncertainty, parameter selection for under-5 mortality synthesis by spatiotemporal Gaussian process regression, and sibling history data processing. We also expanded …
BackgroundThe Global Burden of Diseases, Injuries, and Risk Factors Study 2015 provides an up-to-date synthesis of the evidence for risk factor exposure and the attributable burden of disease. By providing national and subnational assessments spanning the past 25 years, this study can inform debates on the importance of addressing risks in context.MethodsWe used the comparative risk assessment framework developed for previous iterations of the Global Burden of Disease Study to estimate attributable deaths, disability-adjusted life-years (DALYs), and trends in exposure by age group, sex, year, and geography for 79 behavioural, environmental and occupational, and metabolic risks or clusters of risks from 1990 to 2015. This study included 388 risk-outcome pairs that met World Cancer Research Fund-defined criteria for convincing or probable evidence. We extracted relative risk and exposure estimates …
BackgroundIn transitioning from the Millennium Development Goal to the Sustainable Development Goal era, it is imperative to comprehensively assess progress toward reducing maternal mortality to identify areas of success, remaining challenges, and frame policy discussions. We aimed to quantify maternal mortality throughout the world by underlying cause and age from 1990 to 2015.MethodsWe estimated maternal mortality at the global, regional, and national levels from 1990 to 2015 for ages 10–54 years by systematically compiling and processing all available data sources from 186 of 195 countries and territories, 11 of which were analysed at the subnational level. We quantified eight underlying causes of maternal death and four timing categories, improving estimation methods since GBD 2013 for adult all-cause mortality, HIV-related maternal mortality, and late maternal death. Secondary analyses then …
ImportanceUS health care spending has continued to increase, and now accounts for more than 17% of the US economy. Despite the size and growth of this spending, little is known about how spending on each condition varies by age and across time.ObjectiveTo systematically and comprehensively estimate US spending on personal health care and public health, according to condition, age and sex group, and type of care.Design and SettingGovernment budgets, insurance claims, facility surveys, household surveys, and official US records from 1996 through 2013 were collected and combined. In total, 183 sources of data were used to estimate spending for 155 conditions (including cancer, which was disaggregated into 29 conditions). For each record, spending was extracted, along with the age and sex of the patient, and the type of care. Spending was adjusted to reflect the health condition treated, rather than the primary diagnosis.ExposuresEncounter with US health care system.Main Outcomes and MeasuresNational spending estimates stratified by condition, age and sex group, and type of care.ResultsFrom 1996 through 2013, $30.1 trillion of personal health care spending was disaggregated by 155 conditions, age and sex group, and type of care. Among these 155 conditions, diabetes had the highest health care spending in 2013, with an estimated $101.4 billion (uncertainty interval [UI], $96.7 billion-$106.5 billion) in spending, including 57.6% (UI, 53.8%-62.1%) spent on pharmaceuticals and 23.5% (UI, 21.7%-25.7%) spent on ambulatory care. Ischemic heart disease accounted for the second-highest amount of health care spending in 2013, with estimated spending of $88.1 billion (UI, $82.7 billion-$92.9 billion), and low back and neck pain accounted for the third-highest amount, with estimated health care spending of $87.6 billion (UI, $67.5 billion-$94.1 billion). The conditions with the highest spending levels varied by age, sex, type of care, and year. Personal health care spending increased for 143 of the 155 conditions from 1996 through 2013. Spending on low back and neck pain and on diabetes increased the most over the 18 years, by an estimated $57.2 billion (UI, $47.4 billion-$64.4 billion) and $64.4 billion (UI, $57.8 billion-$70.7 billion), respectively. From 1996 through 2013, spending on emergency care and retail pharmaceuticals increased at the fastest rates (6.4% [UI, 6.4%-6.4%] and 5.6% [UI, 5.6%-5.6%] annual growth rate, respectively), which were higher than annual rates for spending on inpatient care (2.8% [UI, 2.8%-2.8%] and nursing facility care (2.5% [UI, 2.5%-2.5%]).Conclusions and RelevanceModeled estimates of US spending on personal health care and public health showed substantial increases from 1996 through 2013; with spending on diabetes, ischemic heart disease, and low back and neck pain accounting for the highest amounts of spending by disease category. The rate of change in annual spending varied considerably among different conditions and types of care. This information may have implications for efforts to control US health care spending.
BackgroundHealthy life expectancy (HALE) and disability-adjusted life-years (DALYs) provide summary measures of health across geographies and time that can inform assessments of epidemiological patterns and health system performance, help to prioritise investments in research and development, and monitor progress toward the Sustainable Development Goals (SDGs). We aimed to provide updated HALE and DALYs for geographies worldwide and evaluate how disease burden changes with development.MethodsWe used results from the Global Burden of Diseases, Injuries, and Risk Factors Study 2015 (GBD 2015) for all-cause mortality, cause-specific mortality, and non-fatal disease burden to derive HALE and DALYs by sex for 195 countries and territories from 1990 to 2015. We calculated DALYs by summing years of life lost (YLLs) and years of life lived with disability (YLDs) for each geography, age …
Background In transitioning from the Millennium Development Goal to the Sustainable Development Goal era, it is imperative to comprehensively assess progress toward reducing maternal mortality to identify areas of success, remaining challenges, and frame policy discussions.We aimed to quantify maternal mortality throughout the world by underlying cause and age from 1990 to 2015. MethodsWe estimated maternal mortality at the global, regional, and national levels from 1990 to 2015 for ages 10-54 years by systematically compiling and processing all available data sources from 186 of 195 countries and territories, 11 of which were analysed at the subnational level.We quantifi ed eight underlying causes of maternal death and four timing categories, improving estimation methods since GBD 2013 for adult all-cause mortality, HIVrelated maternal mortality, and late maternal death.Secondary analyses then allowed systematic examination of drivers of trends, including the relation between maternal mortality and coverage of specifi c reproductive health-care services as well as assessment of observed versus expected maternal mortality as a function of Socio-demographic Index (SDI), a summary indicator derived from measures of income per capita, educational attainment, and fertility.Findings Only ten countries achieved MDG 5, but 122 of 195 countries have already met SDG 3.1.Geographical disparities widened between 1990 and 2015 and, in 2015, 24 countries still had a maternal mortality ratio greater than 400.The proportion of all maternal deaths occurring in the bottom two SDI quintiles, where haemorrhage is the dominant cause of maternal death, increased from roughly 68% in 1990 to more than 80% in 2015.The middle SDI quintile improved the most from 1990 to 2015, but also has the most complicated causal profi le.Maternal mortality in the highest SDI quintile is mostly due to other direct maternal disorders, indirect maternal disorders, and abortion, ectopic pregnancy, and/or miscarriage.Historical patterns suggest achievement of SDG 3.1 will require 91% coverage of one antenatal care visit, 78% of four antenatal care visits, 81% of in-facility delivery, and 87% of skilled birth attendance.Interpretation Several challenges to improving reproductive health lie ahead in the SDG era.Countries should establish or renew systems for collection and timely dissemination of health data; expand coverage and improve quality of family planning services, including access to contraception and safe abortion to address high adolescent fertility; invest in improving health system capacity, including coverage of routine reproductive health care and of more advanced obstetric care-including EmOC; adapt health systems and data collection systems to monitor and reverse the increase in indirect, other direct, and late maternal deaths, especially in high SDI locations; and examine their own performance with respect to their SDI level, using that information to formulate strategies to improve performance and ensure optimum reproductive health of their population.
BackgroundHealthy life expectancy (HALE) and disability-adjusted life-years (DALYs) provide summary measures of health across geographies and time that can inform assessments of epidemiological patterns and health system performance, help to prioritise investments in research and development, and monitor progress toward the Sustainable Development Goals (SDGs). We aimed to provide updated HALE and DALYs for geographies worldwide and evaluate how disease burden changes with development.MethodsWe used results from the Global Burden of Diseases, Injuries, and Risk Factors Study 2015 (GBD 2015) for all-cause mortality, cause-specific mortality, and non-fatal disease burden to derive HALE and DALYs by sex for 195 countries and territories from 1990 to 2015. We calculated DALYs by summing years of life lost (YLLs) and years of life lived with disability (YLDs) for each geography, age …
Importance - Cancer is the second leading cause of death worldwide. Current estimates on the burden of cancer are needed for cancer control planning. Objective - To estimate mortality, incidence, years lived with disability (YLDs), years of life lost (YLLs), and disability-adjusted life-years (DALYs) for 32 cancers in 195 countries and territories from 1990 to 2015. Evidence Review - Cancer mortality was estimated using vital registration system data, cancer registry incidence data (transformed to mortality estimates using separately estimated mortality to incidence [MI] ratios), and verbal autopsy data. Cancer incidence was calculated by dividing mortality estimates through the modeled MI ratios. To calculate cancer prevalence, MI ratios were used to model survival. To calculate YLDs, prevalence estimates were multiplied by disability weights. The YLLs were estimated by multiplying age-specific cancer deaths by the reference life expectancy. DALYs were estimated as the sum of YLDs and YLLs. A sociodemographic index (SDI) was created for each location based on income per capita, educational attainment, and fertility. Countries were categorized by SDI quintiles to summarize results. Findings - In 2015, there were 17.5 million cancer cases worldwide and 8.7 million deaths. Between 2005 and 2015, cancer cases increased by 33%, with population aging contributing 16%, population growth 13%, and changes in age-specific rates contributing 4%. For men, the most common cancer globally was prostate cancer (1.6 million cases). Tracheal, bronchus, and lung cancer was the leading cause of cancer deaths and DALYs in men (1.2 million deaths and 25.9 million DALYs). For women, the most common cancer was breast cancer (2.4 million cases). Breast cancer was also the leading cause of cancer deaths and DALYs for women (523 000 deaths and 15.1 million DALYs). Overall, cancer caused 208.3 million DALYs worldwide in 2015 for both sexes combined.Between 2005 and 2015, age-standardized incidence rates for all cancers combined increased in 174 of 195 countries or territories. Age-standardized death rates (ASDRs) for all cancers combined decreased within that timeframe in 140 of 195 countries or territories. Countries with an increase in the ASDR due to all cancers were largely located on the African continent.Of all cancers, deaths between 2005 and 2015 decreased significantly for Hodgkin lymphoma (−6.1% [95% uncertainty interval (UI), −10.6% to −1.3%]). The number of deaths also decreased for esophageal cancer, stomach cancer, and chronic myeloid leukemia, although these results were not statistically significant. Conclusion and Relevance - As part of the epidemiological transition, cancer incidence is expected to increase in the future, further straining limited health care resources. Appropriate allocation of resources for cancer prevention, early diagnosis, and curative and palliative care requires detailed knowledge of the local burden of cancer. The GBD 2015 study results demonstrate that progress is possible in the war against cancer. However, the major findings also highlight an unmet need for cancer prevention efforts, including tobacco control, vaccination, and the promotion of physical activity and a healthy diet.
BackgroundNon-fatal outcomes of disease and injury increasingly detract from the ability of the world's population to live in full health, a trend largely attributable to an epidemiological transition in many countries from causes affecting children, to non-communicable diseases (NCDs) more common in adults. For the Global Burden of Diseases, Injuries, and Risk Factors Study 2015 (GBD 2015), we estimated the incidence, prevalence, and years lived with disability for diseases and injuries at the global, regional, and national scale over the period of 1990 to 2015.MethodsWe estimated incidence and prevalence by age, sex, cause, year, and geography with a wide range of updated and standardised analytical procedures. Improvements from GBD 2013 included the addition of new data sources, updates to literature reviews for 85 causes, and the identification and inclusion of additional studies published up to …
BACKGROUND:The Global Burden of Disease Study 2013 (GBD 2013) aims to bring together all available epidemiological data using a coherent measurement framework, standardised estimation methods, and transparent data sources to enable comparisons of health loss over time and across causes, age-sex groups, and countries. The GBD can be used to generate summary measures such as disability-adjusted life-years (DALYs) and healthy life expectancy (HALE) that make possible comparative assessments of broad epidemiological patterns across countries and time. These summary measures can also be used to quantify the component of variation in epidemiology that is related to sociodemographic development. METHODS:We used the published GBD 2013 data for age-specific mortality, years of life lost due to premature mortality (YLLs), and years lived with disability (YLDs) to calculate DALYs and HALE for 1990, 1995, 2000, 2005, 2010, and 2013 for 188 countries. We calculated HALE using the Sullivan method; 95% uncertainty intervals (UIs) represent uncertainty in age-specific death rates and YLDs per person for each country, age, sex, and year. We estimated DALYs for 306 causes for each country as the sum of YLLs and YLDs; 95% UIs represent uncertainty in YLL and YLD rates. We quantified patterns of the epidemiological transition with a composite indicator of sociodemographic status, which we constructed from income per person, average years of schooling after age 15 years, and the total fertility rate and mean age of the population. We applied hierarchical regression to DALY rates by cause across countries to decompose variance related to the sociodemographic status variable, country, and time. FINDINGS:Worldwide, from 1990 to 2013, life expectancy at birth rose by 6·2 years (95% UI 5·6-6·6), from 65·3 years (65·0-65·6) in 1990 to 71·5 years (71·0-71·9) in 2013, HALE at birth rose by 5·4 years (4·9-5·8), from 56·9 years (54·5-59·1) to 62·3 years (59·7-64·8), total DALYs fell by 3·6% (0·3-7·4), and age-standardised DALY rates per 100 000 people fell by 26·7% (24·6-29·1). For communicable, maternal, neonatal, and nutritional disorders, global DALY numbers, crude rates, and age-standardised rates have all declined between 1990 and 2013, whereas for non-communicable diseases, global DALYs have been increasing, DALY rates have remained nearly constant, and age-standardised DALY rates declined during the same period. From 2005 to 2013, the number of DALYs increased for most specific non-communicable diseases, including cardiovascular diseases and neoplasms, in addition to dengue, food-borne trematodes, and leishmaniasis; DALYs decreased for nearly all other causes. By 2013, the five leading causes of DALYs were ischaemic heart disease, lower respiratory infections, cerebrovascular disease, low back and neck pain, and road injuries. Sociodemographic status explained more than 50% of the variance between countries and over time for diarrhoea, lower respiratory infections, and other common infectious diseases; maternal disorders; neonatal disorders; nutritional deficiencies; other communicable, maternal, neonatal, and nutritional diseases; musculoskeletal disorders; and other non-communicable diseases. However, sociodemographic status explained less than 10% of the variance in DALY rates for cardiovascular diseases; chronic respiratory diseases; cirrhosis; diabetes, urogenital, blood, and endocrine diseases; unintentional injuries; and self-harm and interpersonal violence. Predictably, increased sociodemographic status was associated with a shift in burden from YLLs to YLDs, driven by declines in YLLs and increases in YLDs from musculoskeletal disorders, neurological disorders, and mental and substance use disorders. In most country-specific estimates, the increase in life expectancy was greater than that in HALE. Leading causes of DALYs are highly variable across countries. INTERPRETATION:Global health is improving. Population growth and ageing have driven up numbers of DALYs, but crude rates have remained relatively constant, showing that progress in health does not mean fewer demands on health systems. The notion of an epidemiological transition--in which increasing sociodemographic status brings structured change in disease burden--is useful, but there is tremendous variation in burden of disease that is not associated with sociodemographic status. This further underscores the need for country-specific assessments of DALYs and HALE to appropriately inform health policy decisions and attendant actions. FUNDING:Bill & Melinda Gates Foundation.
IMPORTANCE:Cancer is among the leading causes of death worldwide. Current estimates of cancer burden in individual countries and regions are necessary to inform local cancer control strategies.OBJECTIVE:To estimate mortality, incidence, years lived with disability (YLDs), years of life lost (YLLs), and disability-adjusted life-years (DALYs) for 28 cancers in 188 countries by sex from 1990 to 2013.EVIDENCE REVIEW:The general methodology of the Global Burden of Disease (GBD) 2013 study was used. Cancer registries were the source for cancer incidence data as well as mortality incidence (MI) ratios. Sources for cause of death data include vital registration system data, verbal autopsy studies, and other sources. The MI ratios were used to transform incidence data to mortality estimates and cause of death estimates to incidence estimates. Cancer prevalence was estimated using MI ratios as surrogates for survival data; YLDs were calculated by multiplying prevalence estimates with disability weights, which were derived from population-based surveys; YLLs were computed by multiplying the number of estimated cancer deaths at each age with a reference life expectancy; and DALYs were calculated as the sum of YLDs and YLLs.FINDINGS:In 2013 there were 14.9 million incident cancer cases, 8.2 million deaths, and 196.3 million DALYs. Prostate cancer was the leading cause for cancer incidence (1.4 million) for men and breast cancer for women (1.8 million). Tracheal, bronchus, and lung (TBL) cancer was the leading cause for cancer death in men and women, with 1.6 million deaths. For men, TBL cancer was the leading cause of DALYs (24.9 million). For women, breast cancer was the leading cause of DALYs (13.1 million). Age-standardized incidence rates (ASIRs) per 100 000 and age-standardized death rates (ASDRs) per 100 000 for both sexes in 2013 were higher in developing vs developed countries for stomach cancer (ASIR, 17 vs 14; ASDR, 15 vs 11), liver cancer (ASIR, 15 vs 7; ASDR, 16 vs 7), esophageal cancer (ASIR, 9 vs 4; ASDR, 9 vs 4), cervical cancer (ASIR, 8 vs 5; ASDR, 4 vs 2), lip and oral cavity cancer (ASIR, 7 vs 6; ASDR, 2 vs 2), and nasopharyngeal cancer (ASIR, 1.5 vs 0.4; ASDR, 1.2 vs 0.3). Between 1990 and 2013, ASIRs for all cancers combined (except nonmelanoma skin cancer and Kaposi sarcoma) increased by more than 10% in 113 countries and decreased by more than 10% in 12 of 188 countries.CONCLUSIONS AND RELEVANCE:Cancer poses a major threat to public health worldwide, and incidence rates have increased in most countries since 1990. The trend is a particular threat to developing nations with health systems that are ill-equipped to deal with complex and expensive cancer treatments. The annual update on the Global Burden of Cancer will provide all stakeholders with timely estimates to guide policy efforts in cancer prevention, screening, treatment, and palliation.
 Mohsen Naghavi合作论文数Department of Health Metrics Sciences, University of Washington;Institute for Health Metrics and Evaluation, University of Washington35
 Theo Vos合作论文数Department of Health Metrics Sciences, University of Washington;Institute for Health Metrics and Evaluation, University of Washington29
 Christopher J.L. Murray合作论文数School of Public Health, University of Washington;Department of Health Metrics Sciences, School of Medicine, University of Washington;Institute for Health Metrics and Evaluation, University of Washington23
 Mohammad H Forouzanfar合作论文数Novelna21
 Ali Mokdad合作论文数Department of Epidemiology, School of Public Health, University of Washington21
 Eduardo Bernabé合作论文数Faculty of Dentistry, Oral & Craniofacial Sciences, King’s College London21
 Ryan Barber合作论文数Institute for Health Metrics and Evaluation, University of Washington20
 Ali Raghib合作论文数University of Oxford20
 Haidong Wang合作论文数World Health Organization20
 Lalit Dandona合作论文数Department of Health Metrics Sciences, University of Washington;Institute for Health Metrics and Evaluation, University of Washington19
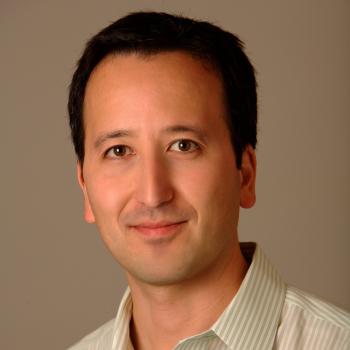 Joshua Salomon合作论文数Freeman Spogli Institute for International Studies, Stanford University;Department of Health Policy, School of Medicine, Stanford University19
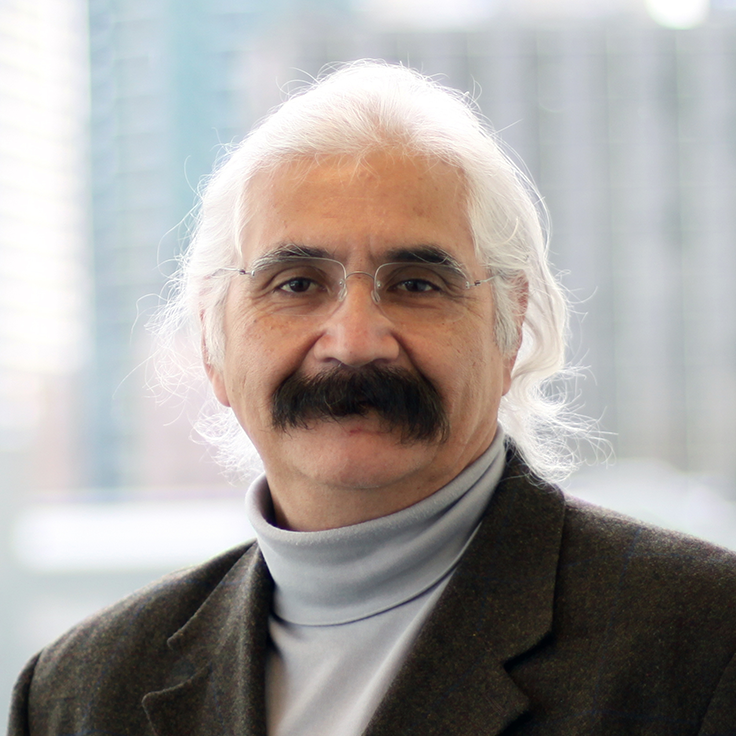 Rafael Lozano合作论文数Department of Health Metrics Sciences, University of Washington;Institute for Health Metrics and Evaluation, University of Washington19
 Amare Azmeraw T合作论文数Discipline Psychiat, Univ Adelaide18
 Alan D. Lopez合作论文数School of Population Health, University of Queensland;Institute for Health Metrics and Evaluation, University of Washington18
 Zulfiqar Bhutta合作论文数Department of Nutritional Sciences, Temerty Faculty of Medicine, University of Toronto;Dalla School of Public Health, University of Toronto;Centre for Global Child Health, Hospital for Sick Children;Institute of Global Health and Development, Aga Khan University;Centre of Excellence in Women and Child Health, Aga Khan University18
 Stephen Lim合作论文数Department of Health Metrics Sciences, University of Washington;Institute for Health Metrics and Evaluation, University of Washington18
 Farshad Pourmalek合作论文数University of British Columbia17
 Xiaofeng Liang (梁晓峰)合作论文数Chinese Center for Disease Control and Prevention17
 Matthew M. Coates合作论文数16Al Artaman合作论文数16
 Simon I. Hay合作论文数Department of Health Metrics Sciences, School of Medicine, University of Washington;Institute for Health Metrics and Evaluation16
 Fitzmaurice Christina合作论文数Department of Health Metrics Sciences, University of Washington16
 Jeffrey Stanaway合作论文数Institute for Health Metrics and Evaluation, University of Washington;Department of Global Health, University of Washington16
 Foad Abd-Allah合作论文数15Wagner Marcenes合作论文数15
 Antonio Carl Abelardo T合作论文数College of Public Health, University of the Philippines Manila15Steiner Caitlyn合作论文数Institute for Health Metrics and Evaluation, Seattle, WA, USA.15
 Rakhi Dandona合作论文数Department of Health Metrics Sciences, University of Washington;Institute for Health Metrics and Evaluation, University of Washington;Public Health Foundation of India15Isabela M. Bensenor合作论文数15Nelson Alvis-Guzman合作论文数14
 Amitava Banerjee合作论文数Institute of Health Informatics, University College London;University College London Hospitals14
 Sadaf G. Sepanlou合作论文数Digestive Diseases Research Institute, Tehran University of Medical Sciences14
 Aleksandra M Barac合作论文数14Alsharif Ubai合作论文数Charité Universitätsmedizin Berlin14
 Ibrahim I Abubakar合作论文数Faculty of Population Health Sciences, University College London14
 Johan Ärnlöv合作论文数Department of Neurobiology, Care Sciences and Society, Karolinska Institute14
 Eric L. Ding合作论文数World Health Organization;New England Complex Systems Institute;World Health Network14
 Kyle Foreman合作论文数Institute for Health Metrics and Evaluation, 2301 Fifth Ave, Suite 600, 98121 Seattle, WA, USA14David M. Pereira合作论文数Faculty of Pharmacy, Porto University14
 Derrick Bennett合作论文数Nuffield Department of Population Health, Medical Sciences Division, University of Oxford14
 G Anil Kumar合作论文数Health Studies Area, Centre for Human Development, Administrative Staff College of India, Hyderabad, India14
 Young-Ho Khang合作论文数Department of Health Policy and Management, College of Medicine, Seoul National University13
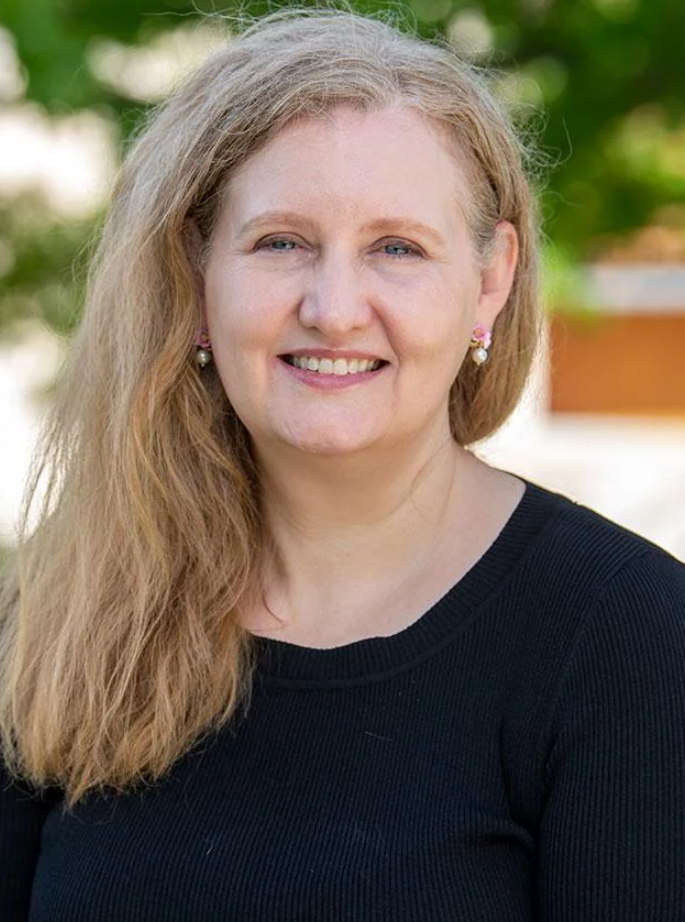 Michelle L. Bell合作论文数School of The Environmental, Yale University;School of Engineering & Applied Science, Yale University13
 H. Dean Hosgood合作论文数Albert Einstein College of Medicine, Montefiore Einstein13
 Awasthi Ashish合作论文数13Shiue Ivy合作论文数13Catalá-López F合作论文数13Kassebaum Nicholas J合作论文数Inst Hlth Metr & Evaluat, Univ Washington13
 Asayesh Hamid合作论文数Department of Medical Emergencies, Qom University of Medical Sciences13




