Precision medicine has led to a paradigm shift allowing the development of targeted drugs that are agnostic to the tumor location. In this context, basket trials aim to identify which tumor types - or baskets - would benefit from the targeted therapy among patients with the same molecular marker or mutation. We propose the implementation of continuous monitoring for basket trials to increase the likelihood of early identification of non-promising baskets. Although the current Bayesian trial designs available in the literature can incorporate more than one interim analysis, most of them have high computational cost, and none of them handle delayed outcomes that are expected for targeted treatments such as immunotherapies. We leverage the Bayesian empirical approach proposed by Fujiwara et al., which has low computational cost. We also extend ideas of Cai et al to address the practical challenge of performing interim analysis with delayed outcomes using multiple imputation. Operating characteristics of four different strategies to handle delayed outcomes in basket trials are compared in an extensive simulation study with the benchmark strategy where trial accrual is put on hold until complete data is observed to make a decision. The optimal handling of missing data at interim analyses is trial-dependent. With slow accrual, missingness is minimal even with continuous monitoring, favoring simpler approaches over computationally intensive methods. Although individual sample-size savings are small, multiple imputation becomes more appealing when sample size savings scale with the number of baskets and agents tested.
e12689 Background: Previous observational studies evaluating the role of MRI in the management of breast cancer patients have shown alterations in management in 14-18% of cases due to detection of more extensive disease, and higher yield in younger women with dense breasts. However, a randomized controlled trial evaluating the clinical efficacy of MRI in women with primary breast cancer showed that the addition of MRI has no benefit on reduction of reoperation rate. We aim to assess the utilization and impact on management of MRI in breast cancer patients age 70 and older. Methods: A retrospective chart review was conducted of 1200 patients age 70 and older diagnosed with breast cancer between 2018-2023 who either received preoperative MRI or did not. Data was analyzed for correlation between MRI use, additional biopsy after MRI, result of additional biopsy, and type of surgery performed. Results: Of 1200 patients, 473 (39%) underwent MRI whereas 727 (61%) did not. Patients in the 70-79 age group were more likely to undergo MRI compared to those 80+; 396/924 (43%) vs. 77/276 (28%) (OR 0.52, 95% CI 0.38-0.69; p< 0.001). Patients with high breast density (C/D) were more likely to receive an MRI compared to those with low breast density (A/B); 168/349 (48%) vs. 171/501 (34%) (OR 1.79, 95% CI 1.35-2.37; p< 0.001). Of 345 patients who had MRI, 88 (26%) had an additional biopsy recommended. See Table for biopsy results. The likelihood of having an additional biopsy was similar in patients across both age brackets, as was the overall yield of cancer, both ipsilateral and contralateral. Conclusions: Breast cancer patients aged 80 and above are less likely to undergo preoperative MRI. However, when they do have an MRI, they are just as likely to undergo an additional biopsy with a similar ipsilateral and contralateral breast cancer yield compared to patients aged 70-79. Therefore, MRI remains clinically useful in a select subset of older patients, particularly those with higher breast density. Utilization and diagnostic yield of MRI. Outcome All Patientsn/N (%) Age 70-79n/N (%) Age ≥ 80n/N (%) Odds Ratio [95% CI] p-value MRI utilization 473/1200 (39.4) 396/924 (42.9) 77/276 (27.9) 0.52 [0.38–0.69] <0.001 Additional biopsy recommended 88/345 (25.5) 74/293 (25.3) 14/52 (26.9) 1.09 [0.56–2.12] 0.799 Biopsy yield for cancer 49/88 (55.7) 41/74 (55.4) 8/14 (57.1) 1.07 [0.34–3.40] 0.904 Biopsy yield for contralateral cancer 19/88 (21.6) 17/74 (23.0) 2/14 (14.3) 0.56 [0.11–2.75] 0.474 Odds Ratio compares the odds of the outcome in Age ≥ 80 to the odds in Age 70-79. OR < 1 indicates lower odds in ≥ 80; OR > 1 indicates higher odds.
SUPPLEMENTARY FIGURE 1: Output of Cox Proportional Hazards Model for Multivariate PFS1 Analysis in HDM-ASCT Recipients with MM (Combined Cohort)
SUPPLEMENTARY FIGURE 3: PFS1 and OS in PGV-B/C carriers vs non-carriers (combined cohort)
SUPPLEMENTARY TABLE 6: Comparative Per-gene PGV-B Burden Analysis in Multiple Myeloma Cohorts versus Non-Cancer gnomAD Control Populations
SUPPLEMENTARY TABLE 9: Matching Study Identifiers for MM patients included in the Discovery cohort to Publicly Available MMRF CoMMpass Ids
Daratumumab is an anti-CD38 monoclonal antibody that has shown clinical benefit in both relapsed/refractory as well as newly diagnosed multiple myeloma (MM). Although daratumumab is very well-tolerated, randomized clinical trial data have consistently demonstrated an increased risk of infection, particularly along the respiratory tract, in patients receiving daratumumab. CD38 is present on healthy plasma cells, and their destruction can lead to hypogammaglobulinemia (HGG). In this study, we retrospectively reviewed all patients with MM treated with daratumumab and intravenous immunoglobulin (IVIG) at our institution from 2015-2019. The primary endpoints were the incidence rate ratios (IRR) of all-grade infections and grade 3-4 infections per patient-year during IVIG versus observation. In addition, a separate reference group of MM patients who were treated with daratumumab but never received IVIG was identified to establish baseline infection rates and to identify differences in baseline characteristics among patients who were selected to receive IVIG. A total of 43 patients received daratumumab and IVIG, primarily in the relapsed/refractory setting. All patients had HGG during treatment with daratumumab, with most (81%) experiencing moderate HGG (IgG
SUPPLEMENTARY TABLE 8: Assessment of Loss of Heterozygosity (LOH) in Carriers of PGVs in BRCA1 and BRCA2
SUPPLEMENTARY TABLE 5: Comparative Per-gene PGV-A Burden Analysis in Multiple Myeloma Cohorts versus Non-Cancer gnomAD Control Populations
SUPPLEMENTARY FIGURE 4: Concordance of Genetically-Determined Ancestry and Self-Reported Race in a subset of patients from the Discovery Cohort (MMRF CoMMpass dataset)
SUPPLEMENTARY TABLE 7: Comparative Per-variant PGV-C Burden Analysis in Multiple Myeloma Cohorts versus Non-Cancer gnomAD Control Populations
SUPPLEMENTARY TABLE 4: Comprehensive characterization of PGV-B/C carriers with multiple myeloma
Figure S4. (A) Time to sustained myeloid recovery stratified by CH-R alone, with medians and hazard ratio (HR) with 95% confidence interval (CI) shown. (B) Time to sustained myeloid recovery, stratified by low (<300 ng/mL) or high (≥300 ng/mL) baseline ferritin (ferr.) and by CH-R, with medians and adjusted hazard ratios (aHR) with 95% CI after multivariable model also including age, prior lines of therapy, and high-risk cytogenetic abnormalities. CH-R is clonal hematopoiesis restricted only to mutations in DNMT3A, TET2, ASXL1, or PPM1D.
T cell engagers (TCEs), particularly those targeting B-cell maturation antigen (BCMA) and G-protein coupled receptor class C group 5 member D (GPRC5D), have transformed the treatment landscape of relapsed/refractory multiple myeloma (RRMM), achieving unprecedented response rates. Despite these advances, many patients either relapse early or exhibit only transient responses, highlighting the urgent need for reliable predictors of treatment outcomes. To address this, we developed a predictive model that estimates the risk of progression at the time of TCE initiation: Predictive Relapse Indicators for Myeloma T cell Engagers (PRIME). The model will be accessible as an online calculator, allowing clinicians to deliver personalized risk assessments and tailor treatment strategies accordingly. We retrospectively identified 325 RRMM patients treated with BCMA and GPRC5D-targeting TCEs within the Mount Sinai Health System to evaluate the prognostic impact of all available clinical variables. To ensure accuracy of the model, we only included 231 patients with minimal missing clinical data. We developed and internally validated a multivariable Cox model to predict progression-free survival (PFS) following TCE therapy in 231 patients. Thirteen pre-specified clinical and laboratory predictors (21 degrees of freedom) were modeled using restricted cubic splines and categorical contrasts. The cohort experienced 125 PFS events, with a median PFS of 17.6 months [95% CI: 12.4, 24.3] and median follow-up of 23.8 months [95% CI: 21.2, 27.6]. To mitigate overfitting, parameter-wise shrinkage was applied post-estimation using Riley's shrinkage methodology. The final global model demonstrated an optimism-adjusted C-index of 0.659 [95% CI: 0.629, 0.749], and the nomogram derived from this model provides individualized 6-, 12-, 24- and 48-month PFS estimates. Continuous predictors were modeled flexibly using restricted cubic splines; hazard ratios (HRs) for these variables represent contrasts between clinically relevant values (e.g., LDH 600 vs 200) and not categorical thresholds. In this cohort, the median age was 67.6 years, 42.4% had high-risk cytogenetics and 22.1% had extramedullary disease (EMD). Around 20% of patients received a chimeric antigen receptor (CAR) T cell therapy prior to the TCE and nearly 60% of the cohort had received ≥5 prior lines of therapy with 85.3% being triple class refractory and 39.8% being penta-drug refractory. Around 55% of patients received a BCMA-targeting TCE and 10% of all patients received a TCE in combination with daratumumab and/or IMiDs. At baseline, 69% of patients had adequate renal function and the cohort had a median ferritin level of 507.4 ng/mL, C-reactive protein (CRP) of 11.97 mg/dL, absolute lymphocyte count (ALC) of 1.05x10³/uL, absolute neutrophil count (ANC) of 3.67x10³/uL, hemoglobin of 10.59 g/dL, platelet count of 168x109/uL, and lactate dehydrogenase (LDH) of 289.1 IU/L. In the shrinkage-adjusted global model, five predictors showed meaningful associations with PFS: ALC, high-risk cytogenetics, EMD, ferritin and LDH. Patients with ALC ≥0.9 vs. <0.9 x10³/uL had a 38% lower risk of progression or death (HR = 0.62 [0.43, 0.90], p=0.011) while those with high-risk cytogenetics had a 59% higher risk of progression or death compared to those without (HR = 1.59 [1.10, 2.30], p=0.015). Patients with EMD had a 54% increased hazard compared to those without (HR = 1.54 [1.02, 2.33], p=0.041). For continuous markers modeled with restricted cubic splines, the HR comparing LDH 600 vs 200 U/L was 1.39 [1.06, 1.81], p=0.015, while a ferritin level of 1,000 ng/mL vs 100 ng/mL was associated with a 54% increased hazard (HR = 1.54 [1.01, 2.34], p=0.045). We developed and internally validated PRIME, a clinically applicable model that integrates key clinical and laboratory parameters to predict PFS in RRMM patients treated with BCMA- or GPRC5D-targeting TCEs. PRIME demonstrated moderate discrimination and provides individualized 6-, 12-, 24- and 48-month PFS estimates through an accessible online calculator. Finally, we are planning to validate this model with external cohorts from other centers.
 Richter Joshua合作论文数45
 Samir Parekh合作论文数44
 Sundar Jagannath合作论文数Center of Excellence for Multiple Myeloma, Tisch Cancer Institute, Icahn School of Medicine at Mount Sinai;Center of Excellence for Multiple Myeloma, Tisch Cancer Center, Icahn School of Medicine at Mount Sinai43Hearn Jay Cho合作论文数41
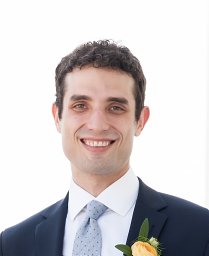 Santiago Thibaud合作论文数Tisch Cancer Institute, Icahn School of Medicine at Mount Sinai37Ajai Chari合作论文数35James G. Wetmur合作论文数33Cesar Rodriguez合作论文数Nueva Granada Military University30Larysa Sanchez合作论文数29Rossi Adriana C合作论文数28
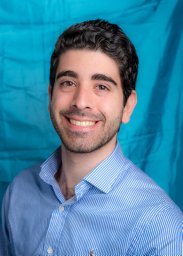 Tarek Hassaan Mouhieddine合作论文数Abu Haidar Neuroscience Institute, American University of Beirut Medical Center28Shambavi Richard合作论文数27
 Douglas Tremblay合作论文数25
 John Mascarenhas合作论文数Icahn School of Medicine, Mount Sinai;Center of Excellence for Blood Cancers and Myeloid Disorders, Mount Sinai;Tisch Cancer Institute, Mount Sinai24
 Matthew Galsky合作论文数The Tisch Cancer Institute, Icahn School of Medicine at Mount Sinai;Graduate School of Biomedical Sciences, Icahn School of Medicine at Mount Sinai23Meng Ru合作论文数22
 William Oh合作论文数Ruttenberg Treatment Center, Icahn School of Medicine, Mount Sinai Clinical21
 James H Godbold合作论文数21Michal Schnaider Beeri合作论文数Mount Sinai School of Medicine19
 Alessandro Laganà合作论文数Bioinformatica, Università di Catania18Amy Tiersten合作论文数18
 David Melnekoff合作论文数Department of Genetics and Genomic Sciences, Icahn School of Medicine at Mount Sinai17
 Oliver Van Oekelen合作论文数Department of Genetics and Genomic Sciences, Icahn School of Medicine at Mount Sinai16
 Guru P. Sonpavde合作论文数Department of Medical Oncology, Dana-Farber/Harvard Cancer Center, Dana-Farber Cancer Institute16William Genthe合作论文数15Saoirse Bodnar合作论文数15Meghana Ram合作论文数15Ryan Subaran合作论文数15
 Jane Houldsworth合作论文数15Tehilla E. Brander合作论文数15Onel Kenan合作论文数15
 Soens Zachry T合作论文数15
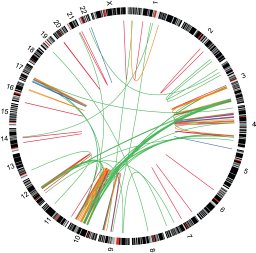 Scott Newman合作论文数Hutchison-MRC Research Centre and Department of Pathology, University of Cambridge15
 Nicole Zubizarreta合作论文数14
 Brittney Zimmerman合作论文数13Ramit Ravona-Springer合作论文数13
 Joanne Stone合作论文数Raquel and Jaime Gilinski Department of Obstetrics, Gynecology and Reproductive Science, Icahn School of Medicine at Mount Sinai;Mount Sinai-Rainbow Clinic13
 Adolfo Aleman合作论文数12
 Natalie F. Berger合作论文数12Anthony D. Heymann合作论文数12Gurbakhash Kaur合作论文数11
 Jeremy M Silverman合作论文数Department of Psychiatry, Icahn School of Medicine at Mount Sinai;Graduate School of Biomedical Sciences, Icahn School of Medicine at Mount Sinai;James J. Peters Veterans Affairs Medical Center11Ronald Hoffman合作论文数11Krystal P Cascetta合作论文数10
 Juan Wisnivesky合作论文数Division of General Internal Medicine, Icahn School of Medicine at Mount Sinai;Graduate School of Biomedical Sciences, Icahn School of Medicine at Mount Sinai10
 Che-Kai Tsao合作论文数10
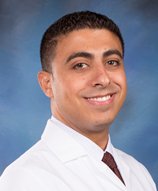 Christian Salib合作论文数10
 Elisa R Port合作论文数Dubin Breast Center, Tisch Cancer Institute, The Icahn School of Medicine, Mount Sinai;Center of Excellence for Breast Cancer, Tisch Cancer Institute, The Icahn School of Medicine, Mount Sinai10
 James Schmeidler合作论文数Department of Psychiatry, Mount Sinai School of Medicine, New York, NY 10029, USA10




