Rational spatial zoning is fundamental to effective territorial governance. However, inconsistencies in grading and weighting methods across existing studies compromise the accuracy and comparability of zoning schemes. To quantify the impact of methodological choices, this study, taking Lingbao County in Henan Province as a case, developed an evaluation index system. Twelve zoning schemes were derived by combined three grading methods (natural breakpoint, threshold, service value accumulation) and four weighting approaches (analytic hierarchy process, entropy weight, Delphi, equal weight). This study then compared the spatial discrepancies among the schemes and employed random forest regression with partial dependence plots to identify driving mechanisms underlying these variations. Results show that grading methods induced spatial inconsistencies up to 316.89 km2, with natural breaks favoring ecological spaces and threshold methods identifying more agricultural and urban spaces. Weighting methods caused 232.02 km2 of variation, where analytic hierarchy process method favoring ecological and urban spaces. Combining grading and weight distribution methods amplifies discrepancies to 509.77 km2 (13.94 % of the total area). The slope is identified as the most critical factor influencing zoning differences. This study equips researchers and planners with actionable insights to calibrate zoning methods, enhancing objectivity in China's territorial spatial planning.
The scientific cognition and methods for territorial space are fundamental to digital territorial governance. This study proposed a bottom-up territorial space cognition system through classifying dominant types, grading principal purposes, zoning major functions, and delineating spatial patterns. At the practical level, this study developed a grid-based method for detecting territorial spatial patterns, with Lingbao city in Henan province as a case study. The method first integrates multi-source heterogeneous datasets to classify single and mixed land use. And the land use functions were evaluated and graded into different levels. A multi-tiered iterative determination process was then devised to find the optimal scale for major functional areas. Multiple attributes of major functional areas were analyzed. The territorial spatial patterns were ultimately delineated by combining major functional areas, natural resource endowments, and projection data. The result showed that mixed land uses were located primarily along main roads or form an outer belt surrounding residential areas. There was a significant difference in the grade of land use functions in both urban and rural areas. The major functional areas demonstrated significant north-south differentiation characteristics, with ecological function areas in the south and agricultural production function areas in the north. The territorial spatial patterns are "one barrier, one corridor, and two areas, one center, three deputies, and four development axes". The theoretical and empirical analysis offered a new perspective on territorial spatial digital governance.
The dramatic expansion of agricultural greenhouses (AGs) in China has raised concerns about its environmental impacts. But our knowledge in this area is still limited, especially the temporal and scale impacts of AGs. To fill this gap, we utilized multiple remote sensing data, time-series segmentation algorithm, and the Mann-Kendall test to analyze the spatiotemporal evolution patterns of AGs in Shandong Province, China from 2001 to 2018. We then explored the impact of AGs on albedo, land surface temperature (LST), and Enhanced vegetation index (EVI) from annual and seasonal analysis perspectives. Results indicated that the total area and number of patches of AGs in Shandong initially grew, then declined, and subsequently grew again. Smaller AGs areas showed lower spatial aggregation and survival rates. Additionally, this study found that AGs have a significant impact on the environment. Increased spatial concentration and longer durations of AGs were linked to more significant reductions in albedo and EVI, along with more pronounced increases in LST. In summer and spring, AGs significantly boosted LST, while in autumn and winter, they significantly reduced albedo. AGs play a crucial role in supporting crop growth during autumn and winter. Moreover, the paper proposed several sustainable AGs management strategies to address these challenges. This study provides observational evidence of the environmental impacts of AGs for promoting sustainable agriculture.
An integrated territorial space analysis framework is critical for advancing spatial governance, yet current approaches face two key challenges: multi-source heterogeneous data integration bottlenecks and limited conventional zoning paradigms. To address these gaps, this study develops a systematic "classification-evaluationzoning" framework for territorial space governance, exemplified by a case study in Lingbao City, Henan Province. The framework first integrates building footprints with POI data, employing K-Dimensional Tree algorithms to achieve fine-scale land use classification. An economic-social-ecological evaluation system was then developed to characterize land use function. Finally, adopting hybrid grids as basic units, the framework integrates kernel density estimation and land use structure to delineate main functional areas (MFAs) and analyze their multidimensional features combined with functional evaluation. The result show forest increased by 173.68 km2 under ecological protection, while 96.98 % of new built-up land originated from farmland conversion. Residential land constitutes 73.30 % and 95.44 % of urban and rural single buildings. Urban and rural mixed land use types increased 2.12-fold and 2.93-fold. Enhanced economic and ecological functions accompanied by social restructuring, which involved a population decline of 16,571 (69.39 % rural outmigration) and a 284 % POI growth. Furthermore, urban commercial and service MFAs surged from 35.62 % to 64.42 % with enhanced diversity-economic intensity synergy. Rural MFAs maintained residential predominance (68.83 %), transitioning towards commercial and service with low-speed economic expansion. This framework integrates fine-grained land use information, multi-dimensional functional evaluation, and grid-based spatial zoning, effectively supporting the complex governance of territorial space. It provides a replicable digital governance paradigm for refined territorial space management globally.
北方农牧交错区地处半湿润/半干旱生态脆弱过渡带,干旱是影响该区植被生产力的关键因素之一.探究干旱对植被总初级生产力的影响,对深刻理解气候变化下生态系统生产力变化响应特征及优化区域碳水循环具有重要意义.为了更好地了解水分限制区不同干旱特征对GPP影响,本研究以北方农牧交错区为例,基于长时间序列的标准化降水蒸散发指数(SPEI3,1900-2020年)和植被总初级生产力(GPP,1982-2018年)等数据,首先采用小波分析明确SPEI3与GPP强相关周期,在此基础上利用游程理论识别干旱特征,进而分析了北方农牧交错区干旱特征与GPP的变化趋势,最后厘定了不同干旱特征对GPP的影响.结果表明:①1982-2018年北方农牧交错区SPEI3与GPP在半年周期和年周期存在显著相关关系,滞后效应随时间变化而变化;年际分析能够减弱滞后效应对SPEI3与GPP相关性的影响;②1900-2020年北方农牧交错区干旱历时、干旱烈度和烈度峰值均呈现显著增加趋势,干旱烈度随着干旱历时和烈度峰值的增加而加剧,干旱特征高值区往往具有更强的增加趋势;③1982-2018年北方农牧交错区GPP总体呈现增加趋势,GPP高值区表现出更强的增加趋势;④不同干旱特征对GPP变化的影响不同,贡献率绝对值表现为干旱烈度>干旱历时>烈度峰值;整体来看,干旱特征共同解释了 GPP变化面积的18.1%,干旱历时和干旱烈度显著抑制GPP增加;⑤不同的土地利用上植被GPP变化对干旱特征响应不同,乔木和灌木GPP下降主要来自干旱历时的负贡献,草地和耕地GPP下降则由干旱烈度的负贡献主导.
目前干旱与植被关系的研究主要集中于气候因子与植被时空变化的相关性分析以及植被对气候变化的响应,能够适用于大尺度的植物抗逆性监测方法还较为欠缺.本文基于归一化植被指数(NDVI)、总初级生产力(GPP)、修正花青素含量指数(mACI)、短波红外水分胁迫指数(SIWSI)监测干旱胁迫下的植被变化,综合考虑植物抗逆过程,建立滞后时间、抗逆时差、响应程度与恢复能力4个植物抗逆性监测指标,构建了一种能够适用于大尺度的植物抗逆性综合监测方法.利用各省份作物抗逆性综合评分与绝收比例进行相关性分析,两者呈显著负相关.利用该方法对干旱胁迫下我国不同类型植被的抗逆性进行评估,结果表明:①从全国整体水平来看,不同季节植物抗逆性差异较大,其中夏季植物抗逆性最弱,冬季最强.我国植物抗逆性空间异质性显著,春季植物抗逆性综合评分低于70分的区域主要位于山西、陕西北部,综合评分高于90分的区域主要集中在内蒙古东北部以及云南的南部地区;②不同类型植被的抗逆性有明显差异,夏季落叶针叶林抗逆性最强,类内差异最小,春秋两季草地抗逆性最强但抗逆性类内差异最大.本文提出的植物抗逆性综合监测方法有助于探索干旱胁迫下植物抗逆性规律,对帮助降低灾害风险具有借鉴意义.
The information on land surface phenology (LSP) was extracted from remote sensing data in many studies. However, few studies have evaluated the impacts of satellite products with different spatial resolutions on LSP extraction over regions with a heterogeneous topography. To bridge this knowledge gap, this study took the Loess Plateau as an example region and employed four types of satellite data with different spatial resolutions (250, 500, and 1000 m MODIS NDVI during the period 2001–2020 and ~10 km GIMMS3g during the period 1982–2015) to investigate the LSP changes that took place. We used the correlation coefficient (r) and root mean square error (RMSE) to evaluate the performances of various satellite products and further analyzed the applicability of the four satellite products. Our results showed that the MODIS-based start of the growing season (SOS) and end of the growing season (EOS) were highly correlated with the ground-observed data with r values of 0.82 and 0.79, respectively (p < 0.01), while the GIMMS3g-based phenology signal performed badly (r < 0.50 and p > 0.05). Spatially, the LSP that was derived from the MODIS products produced more reasonable spatial distributions. The inter-annual averaged MODIS SOS and EOS presented overall advanced and delayed trends during the period 2001–2020, respectively. More than two-thirds of the SOS advances and EOS delays occurred in grasslands, which determined the overall phenological changes across the entire Loess Plateau. However, both inter-annual trends of SOS and EOS derived from the GIMMS3g data were opposite to those seen in the MODIS results. There were no significant differences among the three MODIS datasets (250, 500, and 1000 m) with regard to a bias lower than 2 days, RMSE lower than 1 day, and correlation coefficient greater than 0.95 (p < 0.01). Furthermore, it was found that the phenology that was derived from the data with a 1000 m spatial resolution in the heterogeneous topography regions was feasible. Yet, in forest ecosystems and areas with an accumulated temperature ≥10 °C, the differences in phenological phase between the MODIS products could be amplified.
Greening represents a significant increase in vegetation activity. Accurate quantification of global greening in peak growth is vital for quantifying changes in terrestrial productivity. Normalized Difference Vegetation Index (NDVI) is the remote sensing indicator most commonly applied for this purpose. However, there is limited knowledge about how the applications of other improved or newly available products can impact global greening assessments. This study reports the first systematic investigation of the impact of vegetation indicator selection on global greening in peak growth. It examines the period from 2003 to 2017 using six indicators with a spatial resolution of 500 m: Near Infrared Reflectance of terrestrial vegetation (NIRv) and the coupled diagnostic biophysical modeled Gross Primary Production (PML-GPP), together with NDVI, Enhanced Vegetation Index with two bands (EVI2), Leaf Area Index (LAI) and Moderate Resolution Imaging Spectroradiometer (MODIS) GPP (MOD-GPP) calculated based on MODIS images. Vegetation trends were estimated using the Mann-Kendall test, the unanimous trends by six vegetation indicators were derived, and the concordance ratio in estimated trends by each pair of indicators was investigated among different biomes and their sensitivity to changes in climate were investigated. We found that the estimated greening and browning varied between 12-23% and 2-13% of the vegetated areas, respectively. There was more net greening estimated from NDVI and MOD-GPP (around 19%) compared to the other indicators (8-11%). The concordance ratio between EVI2 and NIRv was much higher (>94%) than other combinations (61-76%) at the global scale. The concordance ratio between one specific indicator and the other indicators gradually increased with its change magnitude. Unanimous results from these six indicators were exhibited in less than two-fifths (38.71%) of vegetated areas. Apart from the EVI2 and NIRv, the concordance ratio varied among different biomes: high in cropland (67-81%), but low in deciduous needle-leaf forest (51-62%) and very low in evergreen broadleaf forest between PML-GPP and others (37-49%). The diverse sensitivity to changes in climate contributed to the discrepancies: greening was more pronounced during warming conditions for the GPP products when compared with the greenness indices. At the global scale, the concordance ratio was higher during cooling conditions among all the indicators except between PML-GPP. Datasets supporing these findings are available online at https://github.com/FuzhouSIRC/Greening_6indicators.2
[目的]研究"镰刀弯"政策影响下全国玉米变化规律,对优化农业种植结构至关重要.[方法]采用综合考虑植被物候和叶片水分变化的玉米制图方法,结合海拔、 坡度、 积温和降雨等不同环境因子分析"镰刀弯"地区玉米的时空变化特征.[结果]通过2767个调研点位验证,总体精度达90.82%,Kappa系数为0.86.[结论]2015—2018年全国玉米种植面积持续下降,减少约279.48万hm2,比例下降6.4%,其中80%以上减少玉米集中在"镰刀弯"地区.4年来"镰刀弯"地区玉米减小面积近90%发生在东北冷凉区与北方农牧交错区.东北冷凉区玉米面积先减小后微弱增加,面积整体下降约11.7%,玉米减少主要发生在玉米种植面积大且较为密集的地区,而在海拔较高、 积温低和降雨少等自然环境较差区域玉米相对减少比例更大,更易受政策影响.北方农牧交错区玉米种植面积持续下降,面积减少约13.5%,与其他环境因素相比,降雨不足对玉米种植变化的影响更大.综合考虑实地的自然环境因素,对"镰刀弯"政策的实施会更加有效.
 Yansui Liu (刘彦随)合作论文数Institute of Geographic Sciences and Natural Resources Research, Chinese Academy of Sciences;Key Laboratory of Regional Sustainable Development Modeling, Chinese Academy of Sciences;University of Chinese Academy of Sciences3
 Bingwen Qiu合作论文数3
 Yingze Huang合作论文数2ZHONG Huimin (钟会民)合作论文数2
 Yurui Li (李裕瑞)合作论文数Department of Agricultural Geography and Rural Development, Institute of Geographic Sciences and Natural Resources Research, Chinese Academy of Sciences;University of Chinese Academy of Sciences2
 Zhengjia Liu (刘正佳)合作论文数Institute of Geographic Sciences and Natural Resources Research, Chinese Academy of Sciences;University of Chinese Academy of Sciences2
 Joe Berry合作论文数1Chao Yan合作论文数1Fanchen Jiang合作论文数1Xiongfei Yan (燕雄飞)合作论文数1LIN Yizhen (林艺真)合作论文数1
 Bowen Niu合作论文数College of Land Science and Technology, China Agricultural University1
 Sisi Wang合作论文数1HUANG Wenqing (黄稳清)合作论文数1Weiming Xu合作论文数1YAN Chao (闫超)合作论文数1
 Zhiyuan Zhao合作论文数Wuhan Univ, State Key Lab Informat Engn Surveying Mapping & R, Wuhan 430079, Peoples R China1
 Cong Ou (欧聪)合作论文数1Yu Li (李宇)合作论文数1YuHua He (何玉花)合作论文数1ShiLin Zou (邹时林)合作论文数1
 Zuoqi Chen合作论文数Key Laboratory of Geographic Information Science, East China Normal University;c;Key Laboratory of Geographic Information Science, East China Normal University1
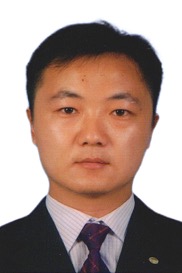 Xiaochuang Yao (姚晓闯)合作论文数College of Land Science and Technology, China Agricultural University1
 Zhenghong Tang (唐正宏)合作论文数Shanghai Astronomical Observatory, Chinese Academy of Sciences1
 Wenbin Wu (吴文斌)合作论文数Institute of Agricultural Resources and Regional Planning, Chinese Academy of Agricultural Sciences1
 Chongcheng Chen (陈崇成)合作论文数Key Lab of Spatial Data Mining & Information Sharing, Ministry of Education, Fuzhou University1




