Statistical Parametric Mapping (SPM) is an integrated set of methods for testing hypotheses about the brain's structure and function, using data from imaging devices. These methods are implemented in an open source software package, SPM, which has been in continuous development for more than 30 years by an international community of developers. This paper reports the release of SPM 25.01, a major new version of the software that incorporates novel analysis methods, optimisations of existing methods, as well as improved practices for open science and software development.
Neuroimaging data analysis often requires purpose-built software, which can be challenging to install and may produce different results across computing environments. Beyond being a roadblock to neuroscientists, these issues of accessibility and portability can hamper the reproducibility of neuroimaging data analysis pipelines. Here, we introduce the Neurodesk platform, which harnesses software containers to support a comprehensive and growing suite of neuroimaging software (https://www.neurodesk.org/). Neurodesk includes a browser-accessible virtual desktop environment and a command line interface, mediating access to containerized neuroimaging software libraries on various computing platforms, including personal and high-performance computers, cloud computing and Jupyter Notebooks. This community-oriented, open-source platform enables a paradigm shift for neuroimaging data analysis, allowing for accessible, flexible, fully reproducible, and portable data analysis pipelines.
The Brain Imaging Data Structure (BIDS) is a community-driven standard for the organization of data and metadata from a growing range of neuroscience modalities. This paper is meant as a history of how the standard has developed and grown over time. We outline the principles behind the project, the mechanisms by which it has been extended, and some of the challenges being addressed as it evolves. We also discuss the lessons learned through the project, with the aim of enabling researchers in other domains to learn from the success of BIDS.
This technical report describes the dynamic causal modelling of mitigated epidemiological outcomes during the COVID-9 coronavirus outbreak in 2020. Dynamic causal modelling is a form of complex system modelling, which uses 'real world' timeseries to estimate the parameters of an underlying state space model using variational Bayesian procedures. Its key contribution-in an epidemiological setting-is to embed conventional models within a larger model of sociobehavioural responses-in a way that allows for (relatively assumption-free) forecasting. One advantage of using variational Bayes is that one can progressively optimise the model via Bayesian model selection: generally, the most likely models become more expressive as more data becomes available. This report summarises the model (on 6-Nov-20), eight months after the inception of dynamic causal modelling for COVID-19. This model-and its subsequent updates-is used to provide nowcasts and forecasts of latent behavioural and epidemiological variables as an open science resource. The current report describes the underlying model structure and the rationale for the variational procedures that underwrite Bayesian model selection.
This report describes a dynamic causal model that could be used to address questions about the rollout and efficacy of vaccines in the United Kingdom. For example, is suppression of community transmission a realistic aspiration? And, if not, what kind of endemic equilibrium might be achieved? What percentage of the population needs to be vaccinated? And over what timescale? It focuses on the synergies among (i) vaccination, (ii) the supported isolation of contacts of confirmed cases and (iii) restrictions on contact rates (i.e., lockdown and social distancing). To model these mitigations, we used a dynamic causal model that embeds an epidemiological model into agent-based behavioural model. The model structure and parameters were optimised to best explain responses to the first and subsequent waves enabling predictions over the forthcoming year under counterfactual scenarios. Illustrative analyses suggest that the full potential of vaccination is realised by increasing the efficacy of contact tracing: for example, under idealised (best case) assumptions of an effective vaccine and efficient isolation of infected pre-symptomatic cases suppression of community transmission would require 50% herd immunity by vaccinating 22% by the end of 2021; i.e., 15 million people or about 50,000 per day. With no change in the isolation of contacts, 36% would require vaccination, i.e., 25 million people. These figures should not be read as estimates of the actual number of people requiring vaccination; however, they illustrate the potential of this kind of model to quantify interactions among public health interventions. We anticipate using this model in a few months to estimate the average effectiveness of vaccines when more data become available.
We recently described a dynamic causal model of a COVID-19 outbreak within a single region. Here, we combine several instantiations of this (epidemic) model to create a (pandemic) model of viral spread among regions. Our focus is on a second wave of new cases that may result from loss of immunity—and the exchange of people between regions—and how mortality rates can be ameliorated under different strategic responses. In particular, we consider hard or soft social distancing strategies predicated on national (Federal) or regional (State) estimates of the prevalence of infection in the population. The modelling is demonstrated using timeseries of new cases and deaths from the United States to estimate the parameters of a factorial (compartmental) epidemiological model of each State and, crucially, coupling between States. Using Bayesian model reduction, we identify the effective connectivity between States that best explains the initial phases of the outbreak in the United States. Using the ensuing posterior parameter estimates, we then evaluate the likely outcomes of different policies in terms of mortality, working days lost due to lockdown and demands upon critical care. The provisional results of this modelling suggest that social distancing and loss of immunity are the two key factors that underwrite a return to endemic equilibrium.
By equipping a previously reported dynamic causal modelling of COVID-19 with an isolation state, we were able to model the effects of self-isolation consequent on testing and tracking. Specifically, we included a quarantine or isolation state occupied by people who believe they might be infected but are asymptomatic—and could only leave if they test negative. We recovered maximum posteriori estimates of the model parameters using time series of new cases, daily deaths, and tests for the UK. These parameters were used to simulate the trajectory of the outbreak in the UK over an 18-month period. Several clear-cut conclusions emerged from these simulations. For example, under plausible (graded) relaxations of social distancing, a rebound of infections is highly unlikely. The emergence of a second wave depends almost exclusively on the rate at which we lose immunity, inherited from the first wave. There exists no testing strategy that can attenuate mortality rates, other than by deferring or delaying a second wave. A testing and tracking policy—implemented at the present time—will defer any second wave beyond a time horizon of 18 months. Crucially, this deferment is within current testing capabilities (requiring an efficacy of tracing and tracking of about 20% of asymptomatic infected cases, with 50,000 tests per day). These conclusions are based upon a dynamic causal model for which we provide some construct and face validation—using a comparative analysis of the United Kingdom and Germany, supplemented with recent serological studies.
This report considers three mechanisms that might underlie the course of the secondary peak of coronavirus infections in the United Kingdom. It considers: (i) fluctuations in transmission strength; (ii) seasonal fluctuations in contact rates and (iii) fluctuations in testing. Using dynamic causal modelling, we evaluated the contribution of all combinations of these three mechanisms using Bayesian model comparison. We found overwhelming evidence for the combination of all mechanisms, when explaining 16 types of data. Quantitatively, there was clear evidence for an increase in transmission strength of 57% over the past months (e.g., due to viral mutation), in the context of increased contact rates (e.g., rebound from national lockdowns) and increased test rates (e.g., due to the inclusion of lateral flow tests). Models with fluctuating transmission strength outperformed models with fluctuating contact rates. However, the best model included all three mechanisms suggesting that the resurgence during the second peak can be explained by an increase in effective contact rate that is the product of a rebound of contact rates following a national lockdown and increased transmission risk due to viral mutation.
We recently described a dynamic causal model of a COVID-19 outbreak within a single region. Here, we combine several instantiations of this (epidemic) model to create a (pandemic) model of viral spread among regions. Our focus is on a second wave of new cases that may result from loss of immunity—and the exchange of people between regions—and how mortality rates can be ameliorated under different strategic responses. In particular, we consider hard or soft social distancing strategies predicated on national (Federal) or regional (State) estimates of the prevalence of infection in the population. The modelling is demonstrated using timeseries of new cases and deaths from the United States to estimate the parameters of a factorial (compartmental) epidemiological model of each State and, crucially, coupling between States. Using Bayesian model reduction, we identify the effective connectivity between States that best explains the initial phases of the outbreak in the United States. Using the ensuing posterior parameter estimates, we then evaluate the likely outcomes of different policies in terms of mortality, working days lost due to lockdown and demands upon critical care. The provisional results of this modelling suggest that social distancing and loss of immunity are the two key factors that underwrite a return to endemic equilibrium.
This technical report describes a dynamic causal model of the spread of coronavirus through a population. The model is based upon ensemble or population dynamics that generate outcomes, like new cases and deaths over time. The purpose of this model is to quantify the uncertainty that attends predictions of relevant outcomes. By assuming suitable conditional dependencies, one can model the effects of interventions (e.g., social distancing) and differences among populations (e.g., herd immunity) to predict what might happen in different circumstances. Technically, this model leverages state-of-the-art variational (Bayesian) model inversion and comparison procedures, originally developed to characterise the responses of neuronal ensembles to perturbations. Here, this modelling is applied to epidemiological populations to illustrate the kind of inferences that are supported and how the model per se can be optimised given timeseries data. Although the purpose of this paper is to describe a modelling protocol, the results illustrate some interesting perspectives on the current pandemic; for example, the nonlinear effects of herd immunity that speak to a self-organised mitigation process.
This technical report addresses a pressing issue in the trajectory of the coronavirus outbreak; namely, the rate at which effective immunity is lost following the first wave of the pandemic. This is a crucial epidemiological parameter that speaks to both the consequences of relaxing lockdown and the propensity for a second wave of infections. Using a dynamic causal model of reported cases and deaths from multiple countries, we evaluated the evidence models of progressively longer periods of immunity. The results speak to an effective population immunity of about three months that, under the model, defers any second wave for approximately six months in most countries. This may have implications for the window of opportunity for tracking and tracing, as well as for developing vaccination programmes, and other therapeutic interventions.
We describe a diffeomorphic registration algorithm that allows groups of images to be accurately aligned to a common space, which we intend to incorporate into the SPM software. The idea is to perform inference in a probabilistic graphical model that accounts for variability in both shape and appearance. The resulting framework is general and entirely unsupervised. The model is evaluated at inter-subject registration of 3D human brain scans. Here, the main modeling assumption is that individual anatomies can be generated by deforming a latent ‘average’ brain. The method is agnostic to imaging modality and can be applied with no prior processing. We evaluate the algorithm using freely available, manually labelled datasets. In this validation we achieve state-of-the-art results, within reasonable runtimes, against previous state-of-the-art widely used, inter-subject registration algorithms. On the unprocessed dataset, the increase in overlap score is over 17%. These results demonstrate the benefits of using informative computational anatomy frameworks for nonlinear registration.
This technical report describes a dynamic causal model of the spread of coronavirus through a population. The model is based upon ensemble or population dynamics that generate outcomes, like new cases and deaths over time. The purpose of this model is to quantify the uncertainty that attends predictions of relevant outcomes. By assuming suitable conditional dependencies, one can model the effects of interventions (e.g., social distancing) and differences among populations (e.g., herd immunity) to predict what might happen in different circumstances. Technically, this model leverages state-of-the-art variational (Bayesian) model inversion and comparison procedures, originally developed to characterise the responses of neuronal ensembles to perturbations. Here, this modelling is applied to epidemiological populations—to illustrate the kind of inferences that are supported and how the model per se can be optimised given timeseries data. Although the purpose of this paper is to describe a modelling protocol, the results illustrate some interesting perspectives on the current pandemic; for example, the nonlinear effects of herd immunity that speak to a self-organised mitigation process.
This technical report addresses a pressing issue in the trajectory of the coronavirus outbreak;namely, the rate at which effective immunity is lost following the first wave of the pandemic This is a crucial epidemiological parameter that speaks to both the consequences of relaxing lockdown and the propensity for a second wave of infections Using a dynamic causal model of reported cases and deaths from multiple countries, we evaluated the evidence models of progressively longer periods of immunity The results speak to an effective population immunity of about three months that, under the model, defers any second wave for approximately six months in most countries This may have implications for the window of opportunity for tracking and tracing, as well as for developing vaccination programmes, and other therapeutic interventions
This technical report describes the rationale and technical details for the dynamic causal modelling of mitigated epidemiological outcomes based upon a variety of timeseries data. It details the structure of the underlying convolution or generative model (at the time of writing on 6-Nov-20). This report is intended for use as a reference that accompanies the predictions in following dashboard: https://www.fil.ion.ucl.ac.uk/spm/covid-19/dashboard
The Brain Imaging Data Structure (BIDS) project is a rapidly evolving effort in the human brain imaging research community to create standards allowing researchers to readily organize and share study data within and between laboratories. Here we present an extension to BIDS for electroencephalography (EEG) data, EEG-BIDS, along with tools and references to a series of public EEG datasets organized using this new standard.
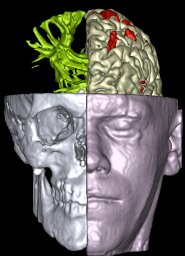
1000 ch) In 1988 the first brain activation studies, relying Positron Emission Tomography (PET) and the availability short half-life radio tracers, were reported. Back then regional differences between brain images were simply characterised over hand-drawn region of interests. The idea of producing a "statistical parametric map" (SPM), i.e. providing valid inferences about brain signals over all the voxels, was formally introduced in 1990 by Friston et al. for PET images. The SPM framework (Fig. 1) was further extended over the years to handle functional and structural MRI, along with EEG and MEG data [1]. Since its first instance in 1991, the SPM software is openly and freely available to the neuroimaging community, to promote collaboration and a common analysis scheme across laboratories. Nowadays SPM remains the most used software for the analysis of neuroimaging data [2,3]. Its openness lead to the development of a whole ecosystem where extensions (more than 60!) were developed to address other problems. Some of these constitutes toolboxes on their own, e.g. the application of machine learning techniques in neuromaging [4] or the processing of quantitative MRI [5]. other researchers could develop their own tool by using SPM's building blocks. Currently more than 60 extensions are available. Some of these constitutes toolboxes on their own, for example on the application on machine learning techniques in neuromagin (PRoNTo [4]) or the processing of quantitative MRI (hMRI [5]).
The following statement is designed to clarify the complementary nature of the Brain Imaging Data Structure (BIDS) and the NeuroImaging Data Model (NIDM). It is not designed to be a comprehensive review of either of these initiatives, but rather to highlight the synergy of the co-application of each of these emerging technologies. The context for this statement is the preservation and communication of neuroimaging data and the additional experimental data and analytics that are associated with the neuroimaging data.
We describe the steps involved in analysis of multi-modal, multi-subject human neuroimaging data using the SPM12 free and open source software (https://www.fil.ion.ucl.ac.uk/spm/) and a publically-available dataset organized according to the Brain Imaging Data Structure (BIDS) format (https://openneuro.org/datasets/ds000117/). The dataset contains electroencephalographic (EEG), magnetoencephalographic (MEG), and functional and structural magnetic resonance imaging (MRI) data from 16 subjects who undertook multiple runs of a simple task performed on a large number of famous, unfamiliar and scrambled faces. We demonstrate: (1) batching and scripting of preprocessing of multiple runs/subjects of combined MEG and EEG data, (2) creation of trial-averaged evoked responses, (3) source-reconstruction of the power (induced and evoked) across trials within a time-frequency window around the “N/M170” evoked component, using structural MRI for forward modeling and simultaneous inversion (fusion) of MEG and EEG data, (4) group-based optimisation of spatial priors during M/EEG source reconstruction using fMRI data on the same paradigm, and (5) statistical mapping across subjects of cortical source power increases for faces vs. scrambled faces.
 Karl Friston合作论文数Institute of Neurology, University College London;The National Hospital for Neurology and Neurosurgery26
 Poline Jean Baptiste合作论文数19
 Satrajit Ghosh合作论文数McGovern Institute for Brain Research, Massachusetts Institute of Technology;Department of Otolaryngology Head and Neck Surgery, Medical School, Harvard University;Harvard Division of Medical Sciences19
 Camille Maumet合作论文数Faculty of medecine, University of Rennes 117
 Krzysztof J. Gorgolewski合作论文数Department of Psychology, Stanford University17
 Thomas Nichols合作论文数Big Data Institute, Li Ka Shing Centre for Health Information and Discovery, University of Oxford16
 Vladimir Litvak合作论文数Evoked Potentials Laboratory, and16
 David Bryant Keator合作论文数Department of Psychiatry and Human Behavior, School of Medicine, University of California, Irvine;Neuroscience Imaging Center, School of Medicine, University of California, Irvine16
 B. Nolan Nichols合作论文数#N# SRI International15
 Jean Daunizeau合作论文数U494 INSERM, Paris, France13Will D. Penny合作论文数13
 Adeel Razi合作论文数Turner Institute for Brain and Mental Health, School of Psychological Sciences, Monash University12
 Ferath Kherif合作论文数University of Lausanne;Laboratoire de Recherche en Neuroimagerie, Departement des Neurosciences Cliniques, Faculté De Biologie Et De Médecine, University Hospital of Lausanne12
 Tibor Auer合作论文数Department of Neurosurgery, University of Pécs11Jean Baptiste Poline合作论文数Parietal Team, Neurospin, INRIA Saclay, France11
 Jessica Turner合作论文数Department of Psychiatry and Behavioral Health, College of Medicine, The Ohio State University;Center for Cognitive and Behavioral Brain Imaging, College of Arts and Sciences, The Ohio State University;Conjectural Systems10Karl G. Helmer合作论文数Department of Biomedical Engineering, Worcester Polytechnic Institute10
 Russ Poldrack合作论文数Department of Psychology, Stanford University10
 Yaroslav O. Halchenko合作论文数dartmouth college10
 Peter Zeidman合作论文数Wellcome Centre for Human Neuroimaging, University College London;Queen Square Institute of Neurology, University College London9
 Michael Hanke合作论文数Department of Experimental Psychology;University of Magdeburg;Department of Experimental Psychology, University of Magdeburg9
 Jason Steffener合作论文数Taub Institute for Research in Alzheimer's Disease and the Aging Brain and Gertrude H. Sergievsky Center, Columbia University9
 Rosalyn Moran合作论文数Department of Neuroimaging, School of Neuroscience, Institute of Psychiatry, Psychology & Neuroscience, King's College London;King’s Institute for Artificial Intelligence, King's College London9
 Thomas Parr合作论文数UCL, Inst Neurol, Wellcome Ctr Human Neuroimaging, London, England8Samir Das合作论文数7
 David N Kennedy合作论文数Department of Psychiatry, T.H. Chan School of Medicine, University of Massachusetts;Department of Radiology, T.H. Chan School of Medicine, University of Massachusetts;NeuroNexus Institute, T.H. Chan School of Medicine, University of Massachusetts;Department of Neuroscience, Morningside Graduate School of Biomedical Sciences, University of Massachusetts7
 Cameron Craddock合作论文数Meta;The Neuro Bureau7
 Lambert Christian合作论文数Clinical Neuroscience, St George's University of London7
 Billig Alexander J合作论文数MRC Cognition and Brain Sciences Unit, 15 Chaucer Road, Cambridge, CB2 7EF, UK.7
 Robert Oostenveld合作论文数Donders Institute for Brain, Cognition, and Behaviour, Radboud University7
 Mattout Jérémie合作论文数Lyon Neuroscience Research Center, Inserm7Christian Haselgrove合作论文数7Tristan Glatard合作论文数CNRS7
 Nikolaus Weiskopf合作论文数7
 Cathy Price合作论文数Wellcome Trust Centre for Neuroimaging, University College London7
 Rik Henson合作论文数Medical Research Council Cognition and Brain Sciences Unit, University of Cambridge;Department of Psychiatry, University of Cambridge7Richard C. Reynolds合作论文数6
 Mark Jenkinson合作论文数School of Computer and Mathematical Sciences, Faculty of Sciences, Engineering and Technology, University of Adelaide;Nuffield Department of Clinical Neurosciences, University of Oxford;South Australian Health and Medical Research Institute6
 Gareth Barnes合作论文数Institute of Neurology, University College London6
 Hulme Oliver合作论文数Centre for Functional and Diagnostic Imaging and Research, Copenhagen University Hospital Hvidovre Hvidovre5
 Gang Chen合作论文数NIH, HHS5
 John Ashburner合作论文数Functional Imaging Laboratory, Wellcome Centre for Human Neuroimaging, University College London;Institute of Neurology, University College London5
 Christophe Phillips合作论文数Cyclotron Research Center, University of Liège5
 Ray Dolan合作论文数Wellcome Trust Centre for Neuroimaging, University College London;UCL-Max Planck Centre for Computational Psychiatry and Ageing5
 Stefan J. Kiebel合作论文数max planck society5Laura Mancini合作论文数4
 Christopher J Markiewicz合作论文数Department of Psychology, Stanford University4Jean-Baptiste Poline合作论文数Department of Neurology & Neurosurgery, Faculty of Medicine and Health Sciences, McGill University4
 Rokem Ariel合作论文数4




