This study presents the results from a comparison of measurement quantification methods of methane emissions from two onshore liquefied natural gas (LNG) export terminals, comparing site-level measurements, made using an in situ airborne technique, and estimates based on emission factors (EFs) derived from measurements using a remote sensing, ground-based, differential absorption LIDAR (DIAL) technique. The methane emissions from each site were quantified at an approximately one-year interval for each of the two techniques. DIAL was used to measure emissions at the sub-site, functional element (FE) level and calculate EFs for each FE using the specific FE activity data (AD). The total site methane emissions during the airborne measurements were estimated for each site using these EFs and the AD at the time. The results show the estimated methane emissions and the airborne measurements are close to agreement when considering the average of all the flight curtains (down to a 7% difference between uncertainty limits), whilst individual curtains were potentially significantly different. These results highlight the importance of fully characterising the methodology and uncertainty of both approaches. Using up-to-date, site-specific EFs or comparing over a statistically large sample size should improve agreement by reducing unknown emission uncertainties associated with site changes affecting the emission profile. Understanding each FE emission profile across a range of AD is critical to address potential differences due to non-linearity. It is important that accurate, specific and up-to-date AD is obtained to give a reliable estimate of emissions. The potential of the concept to estimate methane emissions from the FE EFs is demonstrated.
Governments and industries worldwide are seeking methods to accurately estimate their methane inventories, particularly in the open-cut coal mining sector, where quantifying facility-level emissions remains challenging and robust verification methods are not yet widespread. Here, we compare methane emission rates estimated from two aircraft-based measurement platforms with operator-reported emissions from an open-cut coal mine in the Bowen Basin (Queensland, Australia). Coarse-resolution satellite-based data identified the mine as a significant emitter, making it ideal for case studies using airborne in situ and remote sensing platforms that provide high-resolution measurements to isolate mine-scale emissions. Using airborne in situ measurements, we estimated methane emission rates of 14.0 +/- 3.3 (+/- 2 sigma) t h-1 during May and June 2022. In September 2023, airborne in situ and remote sensing measurements yielded consistent emission rate estimates of 9.6 +/- 1.9 (+/- 2 sigma) t h-1 and 11.3 +/- 5.3 (+/- 2 sigma) t h-1, respectively. If sustained, these rates would equate to annual emissions of 1.5-4.2 Mt of CO2 equivalents (CO2-e) year-1, 3-8 times higher than operator-reported annual Scope 1 emissions (0.53-0.54 Mt of CO2-e year-1). Beyond highlighting the potential for under-reporting of emissions at this mine, our results indicate that aircraft-based technologies are valuable tools for supporting accurate reporting of facility-scale methane emissions from open-cut coal mines.
This study presents data from a large-scale Before After Control Impact (BACI) design field experiment that measured the sediment reduction achieved by remediating large alluvial gullies. The study was carried out on Bonnie Doon Creek on the lower Burdekin River, in Queensland Australia. Prior to remediation, the four large alluvial gully complexes (active area of-17ha) were conservatively estimated to be delivering 5800 +/- 1500 t of fine sediment (<20 mu m) per year (20 year average). The experiment demonstrated that the average remediation effectiveness across 10 different treatments was a 96%-99% reduction in fine sediment yield (or an annualised reduction of-5500t). High resolution lidar DEM of Difference (DoD) derived sediment yields in the unremediated gullies were found to be, on average, 58% lower than yields derived from monitored suspended sediment concentration (SSC) data, albeit with some uncertainty. These data support the notion that even high resolution (0.1m) lidar DoD yields are missing erosion driven by rainfall driven downwearing across all internal gully surfaces that is below the limit of detection (LOD) of the lidar. The results highlight that the greatest uncertainty in predicting the sediment abatement from gully remediation is associated with the determination of the baseline sediment yield of each gully. Future research effort should be focused on improving our understanding of baseline (multi-decadal) sediment yields, and monitored (annual) yields in different types of unremediated gullies. This is dependent on developing a detailed understanding of how these gullies evolve through time, and what the processes are that drive ongoing gully growth. (c) 2024 International Research and Training Center on Erosion and Sedimentation, China Water and Power Press, and China Institute of Water Resources and Hydropower Research. Publishing services by Elsevier B.V. on behalf of KeAi Communications Co. Ltd. This is an open access article under the CC BY- NC-ND license (http://creativecommons.org/licenses/by-nc-nd/4.0/).
Regional scale marine cloud brightening (MCB) has been proposed as a novel climate intervention to reduce the impact of global warming and associated marine heatwaves on the Great Barrier Reef. The concept relies on artificially generated sea spray aerosols (SSA) at the ocean surface and their transport in sufficient quantities to low-level maritime clouds. A portion of the SSA that reaches cloud height can act as additional cloud condensation nuclei and modify cloud microphysical properties, potentially reducing the amount of solar radiation reaching the sea surface. Although modelling data supports the MCB concept, field experiments demonstrating the dispersion of artificially produced SSA to clouds have not been previously reported. Here, we show that within a field of low-level trade wind cumulus-type clouds, an aerosol plume generated at the sea surface on board a research vessel was rapidly advected to cloud base height. Aircraft measurements conducted during two different sampling strategies, detected the aerosol plume from the vessel’s sea water atomisation system just below cloud bases at 700–900 m altitudes. For an estimated surface level aerosol production rate of 4 × 10 ^14 s ^−1 , aerosol concentrations at cloud base were detected with peak number concentrations of up to ∼1 × 10 ^3 cm ^−3 . Although such production rates of aerosol particles are orders of magnitude less than what is envisioned for any practical implementation of MCB, our results indicate that cloud perturbation experiments should now be possible using surface-produced SSA.
In recent years, credible atmospheric observations of methane emissions suggest that annual methane emission estimates in inventories for some Australian coal mining regions or facilities may be underestimated. A lack of well-constrained, mine-scale studies for open-cut (pit) coal mines continues to hinder discussions on emission estimates and the refinement of estimation methods for Australian open-cut coal mining facilities. Here, we present preliminary results from aircraft- and ground-based atmospheric measurements recorded in November 2024 in the Hunter Coalfield, NSW, Australia.Australia employs higher-Tier IPCC methodologies – Tier 2 (basin-specific) and Tier 3 (mine-specific, Methods 2 and 3 ) – under its National Greenhouse and Energy Reporting (NGER) Scheme to estimate open-cut coal mine emissions. These methods rely on the use of coal core gas content to estimate methane emissions from open-cut mine complexes. However, Methods 2 and 3 have never been validated using airborne or ground-based time series observations.While coarse-resolution satellites like TROPOMI can quantify coal mine emissions at regional scales (Sadavarte et al., 2021; Palmer et al., 2021), their limited spatial resolution reduces their effectiveness for verifying annual inventory reported emissions at the scale of individual mines. Additionally, the ability of point-source imaging satellites to quantify emissions from individual open-cut coal mines remains uncertain. Coal seam blasting prior to extraction can be considered a point source; however, open-cut coal mines have various continuous diffuse methane sources that also need to be quantified. The diffuse sources include, among others, emissions from beneath the pit floor, lateral diffusion along coal seams and other rock strata in the mine walls, rock waste piles, and areas of in situ biological production, such as water management ponds. Aircraft- and ground-based technologies have the potential to measure both point and diffuse sources of methane, thus providing a potential pathway for verifying greenhouse gas inventories determined using approved IPCC methodologies.During this measurement campaign in the Hunter Coalfield, a research aircraft flew instruments to collect in-situ atmospheric measurements of methane and carbon dioxide mole fractions, along with GPS and meteorological data. These data were used to make rate of methane emission estimates downwind of individual coal mine complexes. Aerosol size and particle number concentration measurements and high-resolution airborne LiDAR imagery were also acquired to aid in source attribution. These measurements were complemented by ground-based EM27/SUN solar absorption spectrometer instruments positioned upwind and downwind of the same coal mining complexes. Comparisons between emissions derived from the aircraft-base, ground station EM27/SUN observations, and operator-reported coal mine methane emissions will be presented.Palmer, P. I., Feng, L., Lunt, M. F., Parker, R. J., Bösch, H., Lan, X., Lorente, A., and Borsdorff, T.: The added value of satellite observations of methane for understanding the contemporary methane budget, Phil. Trans. R. Soc. A., 379, 20210106, https://doi.org/10.1098/rsta.2021.0106, 2021.Sadavarte, P., Pandey, S., Maasakkers, J. D., Lorente, A., Borsdorff, T., van der Gon, H. D., Houweling, S., and Aben, I.: Methane emissions from superemitting coal mines in Australia quantified using TROPOMI satellite observations, Environmental Science & Technology, 55, 16573–16580, https://doi.org/10.1021/acs.est.1c03976, 2021.
Current extremes within regional water cycles, extensive drought periods and torrential flooding, are associated in literature and media to first indicators of greenhouse gas driven climate change. Indeed, they are among major threats to be expected from climate change model results. The main obvious physical process behind such global warming water cycle extremes, is the temperature dependent water vapor content of air (Clausius Clapeyron, 1834, CC) and it’s increase by ~ 7% per degree C. Naturally the water vapor input into the atmosphere via evapotranspiration is dependent on shortwave radiation reaching the surface, a process controlled partially by fine particles, partially by clouds. Here the ultrafine, invisible, fraction of the aerosols is becoming important.Ultrafine particles (UFP) acting as cloud condensation nuclei (CCN) are the driving force behind cloud modification and changing rainfall patterns. However, the sources and budgets of anthropogenic primary and secondary particles were not well known. Based on airborne measurements we identified as a major contribution modern fossil fuel flue gas cleaning techniques to cause a doubling of global primary UFP number emissions. The subsequent enhancement of CCN numbers has several side effects. It’s changing the size of the cloud droplets and delays raindrop formation, suppressing certain types of rainfall and increasing the residence time of water vapor in the atmosphere. This additional latent energy reservoir is directly available for invigoration of rainfall extremes. Additionally it’s a further contribution to the column density of water vapor as a greenhouse gas and important for the infrared radiation budget. The localized but ubiquitous fossil fuel related UFP emissions and their role in the hydrological cycle, may thus contribute to regional or continental climate trends, such as increasing drought and flooding, observed within recent decades.We discuss the impact of the ultrafine fraction on the hydrological cycle and its historical timeline. Ultrafine particles (UFP) initially don’t interact with radiation like fine ones. However, a significant increase of the ultrafine particle burden may serve similar to CC to more water vapor molecules, respectively more latent energy in the troposphere, especially in the altitude range of convective clouds. We also discuss the origin of the majority of UFP, whether a simple dependence of ultrafine particles on the atmospheric sulphur load is a reasonable and valid assumption and what should be taken additionally into account for future UFP szenarios.Junkermann, W. & Hacker, J., 2022, Unprecedented levels of ultrafine particles, major sources, and the hydrological cycle, Nature Scientific Reports, 12:7410 https://doi.org/10.1038/s41598-022-11500-5Junkermann, W. (2022). Ultrafine particle emissions in the Mediterranean region. In F. Dulac, S. Sauvage, & E. Hamonou (Eds.), Atmospheric chemistry in the Mediterranean region (Vol. 2, From air pollutant sources to impacts). Springer, 21 pp. https://doi.org/10.5445/IR/1000154173
Abstract. Accurate and representative quantification of methane (CH4) emissions from individual oil and gas facilities is crucial to improve our knowledge of CH4 sources, improve the reliability of emissions reporting and help facilitate mitigation opportunities. Liquefied Natural Gas (LNG) terminals primarily emit carbon dioxide (CO2) but are also potentially large CH4 sources in the gas supply chain. Here, in work supported by the United Nations Environment Program International Methane Emissions Observatory (UNEP’s IMEO), we evaluate two airborne measurement approaches to quantify CH4 emissions from four LNG facilities. The first approach applies a downwind mass balance method to quantify emissions of both CH4 and CO2. Since operator-reported CO2 emissions are relatively well-established, we evaluate the method’s performance by comparing to operator-reported CO2 values. Using this approach, we show that an individual facility CO2 mass balance quantification has a mean relative difference to operator reporting of ±20 %, with no significant mean bias across all estimates. The second approach uses measured CH4:CO2 mole fraction ratios as an alternative method for estimating site-level CH4 emissions. Using this tracer correlation approach, we show that uncertainties in the ratio of CH4:CO2 from a single day can be below ±10 % at the 95 % confidence level. Due to uncertainty in the CO2 emission rate, the resulting mean 2σ uncertainty on CH4 emissions is ±30 %. CH4:CO2 ratios are found to vary with height, with larger variation at lower altitudes (<250 m). Representative sampling across both horizontal and vertical space is needed to enhance the accuracy of the tracer correlation approach for individual emission estimates. We find that when repeated over multiple days and different atmospheric conditions, ratio measurements below 250 m provide a median estimate that is within 5 % of the mass balance and multi-height ratio methods. Whilst the CO2:CH4 emission ratios derived from measurements could be applied to estimate CH4 emissions over longer timeframes, the degree of representativeness will depend on the variability of the ratio over time. Our results indicate that the tracer correlation approach using CO2 as a tracer of opportunity can be used to efficiently estimate CH4 emissions from LNG facilities with a low level of uncertainty.
Methane (CH4) is the second most important anthropogenic greenhouse gas (GHG), and its emissions reduction has been identified as an essential mitigation target to slow down climate change. According to inventories, fossil fuel production and usage account for roughly 17% of the global CH4 emissions, of which approximately 33% originate from coal mining. Accurate identification of coal mining-related CH4 sources and quantification of their annual emission rate is needed for corporate reporting requirements, national inventory verification, and the development of CH4 mitigation strategies.A previous study estimated CH4 emissions for six coal mines in the Bowen Basin in Queensland, Australia, using TROPOMI satellite measurements. It covered a sub-area of the Bowen Basin, where coal is mined at over 40 active mining locations distributed over 60,000 km2. The study showed a significant discrepancy compared to inventory estimates by a factor of 7 during 2018 and 2019.To further verify satellite estimates and improve knowledge of the distribution, persistence, and strength of emissions of this mining region, the Bowen Basin CH4 Mapping (BBCMap) Campaign was conducted in September-October 2023, funded by and performed in collaboration with UNEP's International Methane Emissions Observatory. During this campaign, two HK36 Eco-Dimona research aircraft carrying complementary sensing instrumentation were deployed. The MAMAP2D-Light (Methane Airborne MAPper 2D – Light) imaging spectrometer for estimating atmospheric CH4 and CO2 column anomalies and a lidar for topography scans were deployed on one DIMONA HK36 research aircraft, while the second identical aircraft was equipped with an in-situ payload consisting of an LGR OA-ICOS gas analyser for simultaneous measurements of atmospheric CH4, CO2, and water vapor concentrations, a turbulence probe for wind statistics, and a bag sampler for collecting multiple gas samples during each flight for later 13C isotope analyses in the laboratory. This two-aircraft strategy allowed coordinated measurements of CH4 emissions from different coal mines with both remote sensing and in-situ instruments and simultaneous wind measurements, which is essential for deriving a robust flux estimate.During the campaign, 39 flights were conducted, covering approximately 33 mines across roughly 20,000 km2, focussing on the northern part of the Bowen Basin. Preliminary MAMAP2D-Light measurements of atmospheric CH4 column anomalies and emission estimates for both open-cut and underground coal mines will be presented and discussed.
Changes and disturbances to water diversity and quality are complex and multi-scale in space and time. Although in situ methods provide detailed point information on the condition of water bodies, they are of limited use for making area-based monitoring over time, as aquatic ecosystems are extremely dynamic. Remote sensing (RS) provides methods and data for the cost-effective, comprehensive, continuous and standardised monitoring of characteristics and changes in characteristics of water diversity and water quality from local and regional scales to the scale of entire continents. In order to apply and better understand RS techniques and their derived spectral indicators in monitoring water diversity and quality, this study defines five characteristics of water diversity and quality that can be monitored using RS. These are the diversity of water traits, the diversity of water genesis, the structural diversity of water, the taxonomic diversity of water and the functional diversity of water. It is essential to record the diversity of water traits to derive the other four characteristics of water diversity from RS. Furthermore, traits are the only and most important interface between in situ and RS monitoring approaches. The monitoring of these five characteristics of water diversity and water quality using RS technologies is presented in detail and discussed using numerous examples. Finally, current and future developments are presented to advance monitoring using RS and the trait approach in modelling, prediction and assessment as a basis for successful monitoring and management strategies.
On September 20-22 September 2023, the international conference 'Microbiology 2023: from single cell to microbiome and host' convened microbiologists from across the globe for a very successful symposium, showcasing cutting-edge research in the field. Invited lecturers delivered exceptional presentations covering a wide range of topics, with a major emphasis on phages and microbiomes, on the relevant bacteria within these ecosystems, and their multifaceted roles in diverse environments. Discussions also spanned the intricate analysis of fundamental bacterial processes, such as cell division, stress resistance, and interactions with phages. Organized by four renowned Academies, the German Leopoldina, the French Académie des sciences, the Royal Society UK, and the Royal Swedish Academy of Sciences, the symposium provided a dynamic platform for experts to share insights and discoveries, leaving participants inspired and eager to integrate new knowledge into their respective projects. The success of Microbiology 2023 prompted the decision to host the next quadrennial academic meeting in Sweden. This choice underscores the commitment to fostering international collaboration and advancing the frontiers of microbiological knowledge. The transition to Sweden promises to be an exciting step in the ongoing global dialogue and specific collaborations on microbiology, a field where researchers will continue to push the boundaries of knowledge, understanding, and innovation not only in health and disease but also in ecology.
The suitability of using standard evaporative duct modeling for providing realistic refractivity profiles of the turbulent sea surface environment for interpreting X-Band wave reception observations recorded during the 2013 Tropical Air-Sea Propagation Study (TAPS13) experiment held near Lucinda, North Queensland is investigated. The TAPS13 experiment involved making meteorological parameter measurements required for refractivity profiling in coordination with operating (9, 17 and 35 GHz) transmit-receive links delivering wave reception measurements in the Australian Coral Sea. This is significant because the forecasting of radio wave propagation coverage depends upon realistic radio-refractive index profiling of the sea surface atmosphere and also on propagation models, such as the Parabolic Equation Method (PEM) models that can utilize accurate two or three dimensional refractive index information. The analysis presented here demonstrates that applying the logarithmic evaporative duct sea surface model representation to propagation modeling is insufficient in accounting for radio wave coverage duct during the intervals of study. This reality poses a challenge for radio-wave propagation forecasting schemes that depend on existing numerical weather prediction modeling for predicting refractive index structure.
A decline in coral reef surface roughness may indicate that a coral reef ecosystem is approaching functional collapse. This is because surface roughness underpins many critical ecosystem metrics, such as, live coral cover and high fish biomass. Yet, we understand very little about how surface roughness changes at ecosystem scales due to the limited spatial extents of coral reef ecological surveys. Here, we investigate the surface roughness of a coral reef across multiple spatial scales on a high-resolution Light Detection and Ranging (LiDAR) derived digital elevation model (DEM, 0.25 m cells). We found that complex features dominated regions with high roughness (e. g., spur and groove systems on the reef slope) and increased the average roughness of geomorphic zones that are otherwise flat and featureless (e.g., lagoonal patch reefs in the sandy deep lagoon). Each geomorphic zone had a unique signature with high values of roughness usually expressed over finer spatial scales and, conversely, lower values of roughness observed over broader spatial scales. We allocated each geomorphic zone into one of four roughness equivalent habitats (REHs 1-4) that share similar surface roughness properties but are not necessarily geographically contiguous regions. These results identify fine scale features and geomorphic zones that are important for providing roughness to coral reef systems, such as spur and groove systems and the fore-reef slope respectively. They also suggest that morphodynamic processes operating at broader spatial scales influence the physical structure of coral reef ecosystems. The quantification of coral reef surface roughness is becoming increasingly important due to the wider availability of high (<1 m) and hyper (<0.1 m) resolution DEMs. Our approach and findings here can be used to provide greater surface textural information for common coral reef geomorphic zones and aid future management and research efforts, such as, monitoring of coral reef ecosystem response to environmental change and reef restoration and adaptation programs.
Onshore and offshore site investigations along the dryland tide-dominated De Grey River delta (northwestern Australia) led to the unexpected discovery of the largest yet-known ma-rine ooid shoals in the Indo-Pacific region. Ooids exhibit up to 60 tangential aragonitic lami-nae that were formed around fluvial sediment grains during the late Holocene. Covering an area >1250 km2, their spatial extent rivals in size individual ooid shoals from the Bahamas. Shoals appear to be spatially linked with the De Grey River, suggesting that fluvial outputs, combined with a macrotidal range, facilitated the precipitation of the ooids. Following their formation, ooids were reworked through tidal and wave processes along the delta. As a re-sult, the delta sedimentary features, including beach ridges, mouth bars, and distributary channels, are composed of ooids. This discovery broadens the range of depositional and climatic environments in which ooids can form and demonstrates that fluvial runoff may not inhibit aragonite precipitation. Such a configuration also provides a unique analogue for ancient ooids found in association with siliciclastic grains and further indicates that the interpretation of typical siliciclastic geomorphologies from geophysical data does not preclude the presence of carbonate grains.
In mid July 2021 an 80-year-old woman received her second COVID-19 immunization with the BioNTech/Pfizer-vaccine (Comirnaty©). After 24 h she developed severe myalgia in her thighs (8/10 NRS) followed by a progressive muscle weakness. Ten days later, she presented herself to our emergency room with a proximal tetraparesis without sensory deficits. She had no fever and reported no relevant trauma or toxic exposures. She complained of general malaise and had painful thigh and deltoid muscles on palpation. She was neither able to walk nor to rise out of bed without assistance but could lift her head and showed symmetrical abdominal contractions and no scapula alata. Handgrip, speech, swallowing and ocular motor functions remained intact throughout. Her lab results revealed elevated serum Creatine Kinase (CK) (9.603 U/L, ref. <195 U/L) and myoglobin (11.162 μg/L, ref. 25 μg/L to 58 μg/L) levels while TSH, fT4 and CRP were unremarkable. She had no hyperkalemia (4.0 mmol/L) taking hydrochlorothiazide (25 mg) on a regular basis. To avoid further muscle damage we halted her long running statin therapy (80 mg simvastatin) and ensured adequate volume substitution. She developed no signs of acute kidney injury. Within the next seven days her deficits and lab results progressively improved and finally returned to normal (Figure 1). We discharged her seven days later after making a full recovery apart from minor residual muscle pain. In a follow-up over the telephone four weeks later, she indicated no lasting symptoms or deficits.
Ultrafine particles (UFP) acting as cloud condensation nuclei (CCN) are the driving force behind changing rainfall patterns. Recently observed weather extremes like floods and drought might be due to changing anthropogenic UFP emissions. However, the sources and budgets of anthropogenic primary and secondary particles are not well known. Based on airborne measurements we identified as a major contribution modern fossil fuel flue gas cleaning techniques to cause a doubling of global primary UFP number emissions. The subsequent enhancement of CCN numbers has several side effects. It's changing the size of the cloud droplets and delays raindrop formation, suppressing certain types of rainfall and increasing the residence time of water vapour in the atmosphere. This additional latent energy reservoir is directly available for invigoration of rainfall extremes. Additionally it's a further contribution to the column density of water vapour as a greenhouse gas and important for the infrared radiation budget. The localized but ubiquitous fossil fuel related UFP emissions and their role in the hydrological cycle, may thus contribute to regional or continental climate trends, such as increasing drought and flooding, observed within recent decades.
In-flight measurements of atmospheric methane (CH4(a)) and mass balance flux quantification studies can assist with verification and improvement in the UNFCCC National Inventory reported CH4 emissions. In the Surat Basin gas fields, Queensland, Australia, coal seam gas (CSG) production and cattle farming are two of the major sources of CH4 emissions into the atmosphere. Because of the rapid mixing of adjacent plumes within the convective boundary layer, spatially attributing CH4(a) mole fraction readings to one or more emission sources is difficult. The primary aims of this study were to use the CH4(a) isotopic composition (δ13CCH4(a)) of in-flight atmospheric air (IFAA) samples to assess where the bottom–up (BU) inventory developed specifically for the region was well characterised and to identify gaps in the BU inventory (missing sources or over- and underestimated source categories). Secondary aims were to investigate whether IFAA samples collected downwind of predominantly similar inventory sources were useable for characterising the isotopic signature of CH4 sources (δ13CCH4(s)) and to identify mitigation opportunities. IFAA samples were collected between 100–350 m above ground level (m a.g.l.) over a 2-week period in September 2018. For each IFAA sample the 2 h back-trajectory footprint area was determined using the NOAA HYSPLIT atmospheric trajectory modelling application. IFAA samples were gathered into sets, where the 2 h upwind BU inventory had > 50 % attributable to a single predominant CH4 source (CSG, grazing cattle, or cattle feedlots). Keeling models were globally fitted to these sets using multiple regression with shared parameters (background-air CH4(b) and δ13CCH4(b)). For IFAA samples collected from 250–350 m a.g.l. altitude, the best-fit δ13CCH4(s) signatures compare well with the ground observation: CSG δ13CCH4(s) of −55.4 ‰ (confidence interval (CI) 95 % ± 13.7 ‰) versus δ13CCH4(s) of −56.7 ‰ to −45.6 ‰; grazing cattle δ13CCH4(s) of −60.5 ‰ (CI 95 % ± 15.6 ‰) versus −61.7 ‰ to −57.5 ‰. For cattle feedlots, the derived δ13CCH4(s) (−69.6 ‰, CI 95 % ± 22.6 ‰), was isotopically lighter than the ground-based study (δ13CCH4(s) from −65.2 ‰ to −60.3 ‰) but within agreement given the large uncertainty for this source. For IFAA samples collected between 100–200 m a.g.l. the δ13CCH4(s) signature for the CSG set (−65.4 ‰, CI 95 % ± 13.3 ‰) was isotopically lighter than expected, suggesting a BU inventory knowledge gap or the need to extend the population statistics for CSG δ13CCH4(s) signatures. For the 100–200 m a.g.l. set collected over grazing cattle districts the δ13CCH4(s) signature (−53.8 ‰, CI 95 % ± 17.4 ‰) was heavier than expected from the BU inventory. An isotopically light set had a low δ13CCH4(s) signature of −80.2 ‰ (CI 95 % ± 4.7 ‰). A CH4 source with this low δ13CCH4(s) signature has not been incorporated into existing BU inventories for the region. Possible sources include termites and CSG brine ponds. If the excess emissions are from the brine ponds, they can potentially be mitigated. It is concluded that in-flight atmospheric δ13CCH4(a) measurements used in conjunction with endmember mixing modelling of CH4 sources are powerful tools for BU inventory verification.
A decline in coral reef structural complexity may indicate that a coral reef ecosystem is approaching functional collapse. This is because structural complexity underpins many critical ecosystem processes and functions, such as post-disturbance recovery, greater fish biomass, coastal protection services, and carbonate production. Yet, we understand very little about how structural complexity changes at ecosystem scales due to the limited spatial extents of coral reef ecological surveys. Here, we investigate the structural complexity of an entire coral reef by calculating surface roughness across multiple spatial scales on a high-resolution Light Detection and Ranging (LiDAR) derived digital elevation model (DEM, 0.25 m cells). We show that we can classify large areas of a coral reef into three Roughness Equivalent Habitats (REHs 1 - 3) that share similar surface roughness properties but are not necessarily geographically contiguous regions. REH-1 contained zones with high surface roughness that are typically considered regions of high primary productivity and structural complexity (e.g., fore-reef slopes). REHs 2 and 3 contain some features of high surface roughness (e.g., lagoonal patch reefs) but also include roughness magnitudes that were expressed over large spatial scales of 100s to 1000s of metres. These results suggest that there may be processes that operate on large spatial scales that are not quantified and in environments that are often overlooked when monitoring coral reefs. By applying a multi-scale measurement of roughness on a high-resolution reef scale DEM – and defining REHs – we present a new approach that can categorize and describe the structural complexity of coral reefs at ecosystem scales. The quantification of three-dimensional coral reef structure is becoming increasingly important and our approach and findings here can be used for future management and research efforts, such as monitoring of coral reef ecosystem response to environmental change and reef restoration and adaptation programs.
Remote sensing (RS) enables a cost-effective, extensive, continuous and standardized monitoring of traits and trait variations of geomorphology and its processes, from the local to the continental scale. To implement and better understand RS techniques and the spectral indicators derived from them in the monitoring of geomorphology, this paper presents a new perspective for the definition and recording of five characteristics of geomorphodiversity with RS, namely: geomorphic genesis diversity, geomorphic trait diversity, geomorphic structural diversity, geomorphic taxonomic diversity, and geomorphic functional diversity. In this respect, geomorphic trait diversity is the cornerstone and is essential for recording the other four characteristics using RS technologies. All five characteristics are discussed in detail in this paper and reinforced with numerous examples from various RS technologies. Methods for classifying the five characteristics of geomorphodiversity using RS, as well as the constraints of monitoring the diversity of geomorphology using RS, are discussed. RS-aided techniques that can be used for monitoring geomorphodiversity in regimes with changing land-use intensity are presented. Further, new approaches of geomorphic traits that enable the monitoring of geomorphodiversity through the valorisation of RS data from multiple missions are discussed as well as the ecosystem integrity approach. Likewise, the approach of monitoring the five characteristics of geomorphodiversity recording with RS is discussed, as are existing approaches for recording spectral geomorhic traits/ trait variation approach and indicators, along with approaches for assessing geomorphodiversity. It is shown that there is no comparable approach with which to define and record the five characteristics of geomorphodiversity using only RS data in the literature. Finally, the importance of the digitization process and the use of data science for research in the field of geomorphology in the 21st century is elucidated and discussed.
NASA’s Global Ecosystem Dynamics Investigation (GEDI) is collecting spaceborne full waveform lidar data with a primary science goal of producing accurate estimates of forest aboveground biomass density (AGBD). This paper presents the development of the models used to create GEDI’s footprint-level (~25 m) AGBD (GEDI04_A) product, including a description of the datasets used and the procedure for final model selection. The data used to fit our models are from a compilation of globally distributed spatially and temporally coincident field and airborne lidar datasets, whereby we simulated GEDI-like waveforms from airborne lidar to build a calibration database. We used this database to expand the geographic extent of past waveform lidar studies, and divided the globe into four broad strata by Plant Functional Type (PFT) and six geographic regions. GEDI’s waveform-to-biomass models take the form of parametric Ordinary Least Squares (OLS) models with simulated Relative Height (RH) metrics as predictor variables. From an exhaustive set of candidate models, we selected the best input predictor variables, and data transformations for each geographic stratum in the GEDI domain to produce a set of comprehensive predictive footprint-level models. We found that model selection frequently favored combinations of RH metrics at the 98th, 90th, 50th, and 10th height above ground-level percentiles (RH98, RH90, RH50, and RH10, respectively), but that inclusion of lower RH metrics (e.g. RH10) did not markedly improve model performance. Second, forced inclusion of RH98 in all models was important and did not degrade model performance, and the best performing models were parsimonious, typically having only 1-3 predictors. Third, stratification by geographic domain (PFT, geographic region) improved model performance in comparison to global models without stratification. Fourth, for the vast majority of strata, the best performing models were fit using square root transformation of field AGBD and/or height metrics. There was considerable variability in model performance across geographic strata, and areas with sparse training data and/or high AGBD values had the poorest performance. These models are used to produce global predictions of AGBD, but will be improved in the future as more and better training data become available.
Continental as well as maritime ultrafine particles as cloud condensation nuclei (CCN) are likely initially produced by gas to particle conversion starting with nucleation mode aerosol and slowly (within several hours) growing into CCN sizes. Although these birth and growing processes were well investigated since about 50 years, the source locations, where the anthropogenic fraction of these particles are preferably formed still remain uncertain as well as the strength of individual natural or anthropogenic sources.We present an analysis based on two decades of airborne studies of number and size distribution measurements across Europe, Australia, Mexico and China on nucleation and Aitken mode particles serving as CCN or their precursors. Selected flight patterns allow source apportionment for typical major sources and even a quantitative estimate of their emission rates.Contrary to current global climate model RCP assumptions with decreasing aerosol from 2005 towards the end of the century trends of ultrafine particles and CCN are no longer correlated to sulphur emissions within the last two decades. Nowadays nitrogen and ammonia chemistry is becoming increasingly important for global anthropogenic nanoparticle particle formation and number concentrations. Due to their impact on the hydrological cycle, changes like a slowdown of raindrop production, an increased latent heat flux into the lower free troposphere, an invigoration of torrential rains and a larger water vapour column density might be the consequences. Such recently observed weather patterns are well in agreement with current observations of regional UFP/CCN concentrations and their timely evolution.
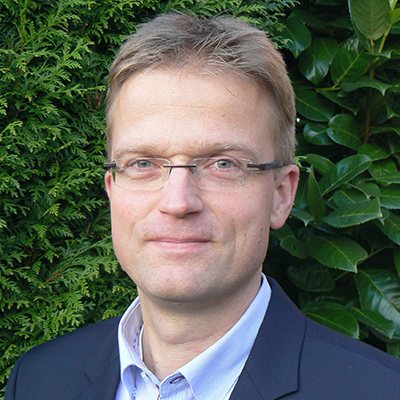 Ulrich Dobrindt合作论文数Dobrindt Lab, Institute of Hygiene, Cells in Motion Interfaculty Centre, University of Munster59
 Werner Goebel合作论文数University of Wuerzburg38
 Manfred Ott合作论文数34Michael Steinert合作论文数33
 Joachim Morschhäuser合作论文数Institut fur Molekulare Infektionsbiologie, Julius-Maximilians-Universitat Wurzburg24Gabriele Blum-Oehler合作论文数22Wilma Ziebuhr合作论文数22Knut Ohlsen合作论文数20
 Jeffrey Walker合作论文数Department of Civil Engineering, Faculty of Engineering, Monash University16
 Ute Hentschel合作论文数GEOMAR Helmholtz Centre for Ocean Research Kiel15
 Gunter Fischer合作论文数14
 Levente Emody合作论文数14
 Rocco Panciera合作论文数Department of Civil and Environmental Engineering|University of Melbourne14Reinhard Marre合作论文数13Klaus Heuner合作论文数13
 W. Junkermann合作论文数13
 Colin Hughes合作论文数Dept Pathol, Univ Cambridge12
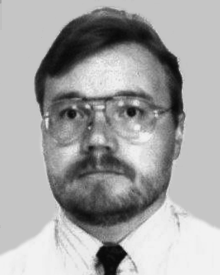 Timo Korhonen合作论文数12
 Mihai A. Tanase合作论文数University of Zaragoza12H Hof合作论文数11Birgit Ludwig合作论文数11
 Eliora Ron合作论文数George S. Wise Faculty of Life Sciences, Tel Aviv University11I Mühldorfer合作论文数10J. A. Whiteway合作论文数10
 Helge Karch合作论文数Institute of Hygiene, Faculty of Medicine, University of Munster10A. Salam Khan合作论文数10Bettina C. Brand合作论文数Institut für Molekulare Infektionsbiologie, Röntgenring 11, D-97070 Würzburg, Germany10r busen合作论文数9Ta Oelschlaeger合作论文数9T Schmoll合作论文数9
 Jetse Kalma合作论文数School of Engineering, College of Engineering, Science and Environment, The University of Newcastle9Thomas Choularton合作论文数Department of Earth and Environmental Sciences, School of Natural Sciences, Faculty of Science and Engineering, The University of Manchester9Gerhard Gottschalk合作论文数9Klaus Jann合作论文数9Tobias A. Oelschlaeger合作论文数9Keith N. Bower合作论文数9
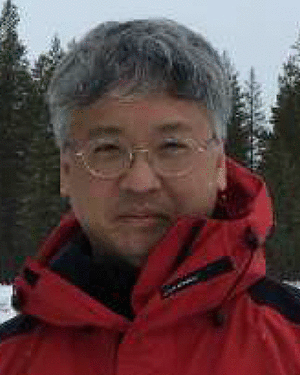 Edward J. Kim合作论文数9Bruno Neininger合作论文数8L BENDER合作论文数8E Wintermeyer合作论文数8
 Martin Gallagher合作论文数Department of Earth and Environmental Sciences, School of Natural Sciences, Faculty of Science and Engineering, The University of Manchester8M. Flynn合作论文数8
 Michael Hecker合作论文数Institute for Microbiology, Ernst-Moritz-Arndt University Greifswald;Institute of Marine Biotechnology8Michael O'Leary合作论文数School of Earth Sciences, James Cook University8
 Alastair G. Williams合作论文数ANSTO Environment;Radiation Science Division;Australian Nuclear Science and Technology;ANSTO Environment, Australian Nuclear Science and Technology8
 Shwan Rachid合作论文数Pharmaceutical Biotechnology, Saarland University8A Lischewski合作论文数7
 Stephen J. Harris合作论文数Australian Nucl Sci & Technol Org7
 Paul J. Connolly合作论文数Department of Pure and Applied Physics, The University of Manchester7




