This paper defines a computational protocol to evaluate the performance of recognizers ofsolid line entities, circle entities, arc entities, dashed line entities, dashed circle entities, dashedarc entities, and text entities in engineering drawings. The protocol handles the one-to-manyand many-to-one matching problems so that detected or groundtruth entities are not multiplycounted.Keyword: Line-drawing recognition, benchmark, performance evaluation, documentimage database.1...
This paper describes an algorithm for the determination of zone content type of a given zone within a document image. We take a statistical based approach and represent each zone with 25 dimensional feature vectors. An optimized decision tree classifier is used to classify each zone into one of nine zone content classes. A performance evaluation protocol is proposed. The training and testing data sets include a total of 24,177 zones from the University of Washington English Document Image database III. The algorithm accuracy is 98.45% with a mean false alarm rate of 0.50%.
This paper describes a protocol for systematically evaluating the performance of dashed-line detection algorithms. It includes a test image generator which creates random line patterns subject to prespecified constraints. The generator also outputs ground truth data for each line in the image. The output of the dashed line detection algorithm is then compared to these ground truths and evaluated using a set of criteria.
This paper defines a computational protocol for evaluating the performance of raster to vector conversion systems. The graphical entities handled by this protocol are continuous and dashed lines, arcs, and circles, and text regions. The protocol allows matches of the type one-to-one, one-to-many, and many-to-one between the ground truth and the recognition results.
This paper presents a benchmark for evaluating the Raster to vector conversion systems. The benchmark is designed for evaluating the performance of graphics recognition systems on images that contain straight lines (solid or dashed), circles (solid or dashed), partial arcs of circles (solid or dashed), as well as, bounding boxes of text blocks within the images. This benchmark gives a scientific comparison of vectorization software and uses practical performance evaluation methods that can be applied to complete vectorization systems. Three systems were evaluated under this benchmark and their performance results are presented in this paper. We hope that this benchmark will help assess the state of the art in graphics recognition and highlight the strengths and weaknesses of current vectorization technology and evaluation methods.
A contest on raster to vector conversion was organized at the GREC'97 workshop in Nancy, France. This report describes the methodology used in the contest and presents the results. Various ways of analyzing the performance are discussed.
This paper presents a table structure understanding algorithm designed using optimization methods. The algorithm is probability based, where the probabilities are estimated from geometric measurements made on the various entities in a large training set. The methodology includes a global parameter optimization scheme, a novel automatic table ground truth generation system and a table structure understanding performance evaluation protocol. With a document data set having 518 table and 10,934 cell entities, it performed at the 96.76% accuracy rate on the cell level and 98.32% accuracy rate on the table level.
We obtain recombination rate distribution functions for all human chromosomes using an optimal quantization method. This nonparametric method allows us to control over-/under-fitting. The piece-wise constant recombination rate distribution functions are convenient to store and retrieve. Our experimental results showed more abrupt distribution functions than two recently published results. In the previous results, the over-/under-fitting issues were not addressed explicitly. Our estimation had greater log likelihood over a previous result using Parzen window. It suggests that the optimal quantization technique might be of great advantage for estimation of other genomic feature distributions.
This paper describes an algorithm to classify each given document zone into one of nine classes and provides a protocol for its performance evaluation. The classification scheme uses an optimized binary decision tree and Viterbi algorithm for HMM to find the optimal solution. Our algorithm was trained and tested on a total of 24,177 zones within the 1600 images from UWCDROM III database. Its accuracy rate is 98.45% with a mean false alarm rate of 0.50%.
In this paper, we define the table detection problem as a probability optimization problem. We begin, as we do in our previous algorithm, finding and validating each detected table candidates. We proceed to compute a set of probability measurements for each of the table entities. The computation of the probability measurements takes into consideration tables, table text separators and table neighboring text blocks. Then, an iterative updating method is used to optimize the page segmentation probability to obtain the final result. This new algorithm shows a great improvement over our previous algorithm. The training and testing data set for the algorithm include 1, 125 document pages having 518 table entities and a total of 10, 934 cell entities. Compared with our previous work, it raised the accuracy rate to 95.67% from 90.32% and to 97.05% from 92.04%.
The algorithm described in this paper is designed to detect potential table regions in the document, to decide whether a potential table region is, in fact, a table, and, when it is, to analyze the table structure. The decision and analysis phases of the algorithm and the resulting system are based primarily on a precise definition of table, and it is such a definition that is discussed in this paper. An adequate definition need not be complete in the sense of encompassing all possible structures that might be deemed to be tables, but it should encompass most such structures, it should include essential features of tables, and it should exclude features never or very rarely possessed by tables.
A document can be divided into zones on the basis of its content. For example, a zone can be either text or non-text. Given the segmented document zones, correctly determining the zone content type is very important for the subsequent processes within any document image understanding system. This paper describes an algorithm for the determination of zone type of a given zone within an input document image. In our zone classification algorithm, zones are represented as feature vectors. Each feature vector consists of a set of 25 measurements of pre-defined properties. A probabilistic model, decision tree, is used to classify each zone on the basis of its feature vector. Two methods are used to optimize the decision tree classifier to eliminate the data over-fitting problem. To enrich our probabilistic model, we incorporate context constraints for certain zones within their neighboring zones. We also model zone class context constraints as a Hidden Markov Model and usedViterbi algorithm to obtain optimal classification results. The training, pruning and testing data set for the algorithm include 1, 600 images drawn from the UWCDROM-III document image database. With a total of 24, 177 zones within the data set, the cross-validation method was used in the performance evaluation of the classifier. The classifier is able to classify each given scientific and technical document zone into one of the nine classes, 2 text classes (of font size 4-18pt and font size 19-32 pt), math, table, halftone, map/drawing, ruling, logo, and others. A zone content classification performance evaluation protocol is proposed. Using this protocol, our algorithm accuracy is 98.45% with a mean false alarm rate of 0.50%.
In this paper, we propose EditCost Index as a goal driven, metric to evaluate the performance of graphics recognition systems. We present the motivation for this metric and show how plots of EditCost Index can be used to compare systems.
We developeda software tool to assisttableunderstanding resear ch. It can analyzeany giventable ground truth andgeneratedocumentsthat includesimilar tableelements while havemore varietyon bothtableandnon-tableparts. Basedonour novelcontentmatching ground truthing idea, thetablegroundtruth datafor thegeneratedtableelements becomeavailablewith little manual work. Thevalidity of the proposedstrategy was confirmedby our table detection algorithm development. We madethis software packagepublicly available.
Little attention has been paid to character connection problems in interpreting the engineering drawings. In this paper, three types of character connection problems are discussed and a method using area Voronoi tessellation is proposed to solve problem type II. Using area Voronoi tessellation, we can efficiently determine the contour of the characters and then detect the existence of any characters connected to graphics by hypothes is and validation. Projection analysis is used to segment and validate the characters connected to graphics. The correctness and feasibility of this method is demonstrated.
In this paper, we give a formal definition of a document image structure representation, and formulate document image structure extraction as a partitioning problem: finding an optimal solution partitioning the set of glyphs of an input document image into a hierarchical tree structure where entities within the hierarchy at each level have similar physical properties and compatible semantic labels. We present a unified methodology that is applicable to construction of document structures at different hierarchical levels. An iterative, relaxation-like method is used to find a partitioning solution that maximizes the probability of the extracted structure. All the probabilities used in the partitioning process are estimated from an extensive training set of various kinds of measurements among the entities within the hierarchy. The offline probabilities estimated in the training then drive all decisions in the online document structure extraction. We have implemented a text line extraction algorithm using this framework.
We first describe an automatic table ground truth generation system which can efficiently generate a large amount of accurate table ground truth suitable for the development of table detection algorithms. Then a novel background analysis-based, coarse-to-fine table identification algorithm and an X-Y cut table decomposition algorithm are described. We discuss an experimental protocol to evaluate the table detection algorithms. For a total of 1,125 document pages having 518 table entities and a total of 10,941 cell entities, our table detection algorithm takes line, word segmentation results as input and obtains around 90% cell correct detection rates.
This paper aims at studying the characterization of Diracstructure edges with a novel wavelet transform, and selecting the suitable wavelet functions to detect them. Three significant characteristics of the local maximum modulus of the wavelet transform with respect to the Dirac-structure edges are presented. By utilizing a novel continuous wavelet, it is proven that the local maxima modulus of such continuous wavelet transform of a Dirac-structure edge forms two new curves which are located symmetrically at the two sides of the original one and have the same direction with it and the distance between the two curves is estimated. An algorithm to detect curves in an image by utilizing the above invariants is developed. Several experiments are conducted, and positive results are obtained.
This paper presents a text word extraction algorithm that takes a set of bounding boxes of glyphs and their associated text lines of a given document and partitions the glyphs into a set of text words, using only the geometric information of the input glyphs. The algorithm is probability based. An iterative, relaxation-like method is used to find the partitioning solution that maximizes the joint probability. To evaluate the performance of our test word extraction algorithm, we used a 3-fold validation method and developed a quantitative performance measure. The algorithm was evaluated on the UW-III database of some 1600 scanned document image pages. An area-overlap measure was used to find the correspondence between the detected entities and the ground-truth. For a total of 827, 433 ground truth words, the algorithm identified and segmented 800, 149 words correctly, an accuracy of 97.43%.
 Robert M. Haralick合作论文数Computer Science Department, Graduate Center, City University of New York46
 Jisheng Liang合作论文数12
 Yalin Wang合作论文数Department of Neorology;Department of Mathematics10
 Jaekyu Ha合作论文数8S. Chen合作论文数8
 Atul K. Chhabra合作论文数5
 Tapas Kanungo合作论文数Microsoft2
 Visvanathan Ramesh合作论文数Center for Cognition and Computation, Goethe University Frankfurt;Department of Computer Science and Mathematics, Goethe University Frankfurt2
 Dov Dori合作论文数Faculty of Data and Decision Sciences, Technion Israel Institute of Technology;Enterprise Systems Modeling Laboratory, Faculty of Industrial Engineering and Management, Technion Israel Institute of Technology2Larry R. Rystrom合作论文数2
 Linda Shapiro合作论文数Department of Computer Science and Engineering, Paul G. Allen School of Computer Science and Engineering, University of Washington;Department of Electrical and Computer Engineering, Paul G. Allen School of Computer Science and Engineering, University of Washington2JK Ha合作论文数1brian j daugherty合作论文数1Steve Soos合作论文数1Larye Parkins合作论文数1Tom Miller合作论文数1Kent Loving合作论文数1Bob Lorbeski合作论文数1Larry Yang合作论文数1Yung Hsi Yao合作论文数1William Cheung合作论文数1Kenneth Cooper合作论文数1Robert Johnson合作论文数1David Ross合作论文数1
 Stéphane Boissinot合作论文数Department of Biology, College of Arts & Science, New York University1
 Yuan Yan Tang (唐遠炎)合作论文数Department of Computer and Information Science, Faculty of Science and Technology, University of Macau;Smart City Research Center, Zhuhai UM Science & Technology Research Institute;Department of Computer Science, Hong Kong Baptist University1
 Arun K Somani合作论文数Department of Electrical and Computer Engineering, College of Engineering, Iowa State University1Chen Su合作论文数1
 Xinge You (尤新革)合作论文数School of Electronic Information and Communications, Huazhong University of Science and Technology;National Anti-counterfeit Engineering Research Center, Huazhong University of Science and Technology1Su Chen合作论文数1
 Lihua Yang (杨力华)合作论文数School of Mathematics, Sun Yat-sen University1
 David Doermann合作论文数Department of Computer Science and Engineering, School of Engineering and Applied Sciences, University at Buffalo;Institute for Artificial Intelligence and Data Science, University at Buffalo1
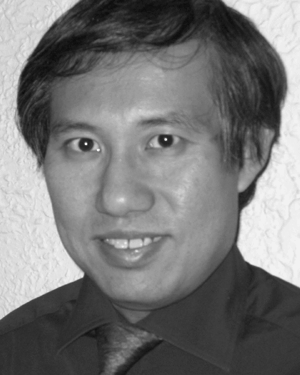 Bon Sy合作论文数1Keitaro Yukawa合作论文数1Christian K. Shin合作论文数1
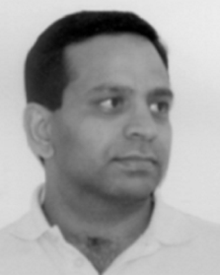 Vikram Chalana合作论文数1
 Rangachar Kasturi合作论文数Computer Vision and Pattern Recognition Group, Department of Computer Science and Engineering, College of Engineering, The University of South Florida1Arathi Prasad合作论文数1
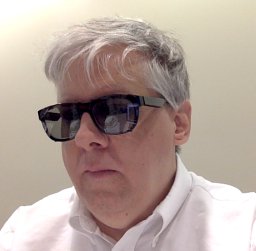 Joe Loughry合作论文数Lockheed Martin Space Systems1
 Chung-Ho Chen (陳中和)合作论文数Computer Architecture and System Laboratory, Department of Electrical Engineering, National Cheng-Kung University1
 Suresh Subramaniam合作论文数Department of Electrical and Computer Engineering, School of Engineering and Applied Science, George Washington University1Howard C. Wasserman合作论文数1
 Joe Song (宋明舟)合作论文数Department of Computer Science, New Mexico State University1Craig M. Wittenbrink合作论文数University of California at Santa Cruz;department of Computer Engineering1
 Jenq-Neng Hwang合作论文数Department of Electrical & Computer Engineering, University of Washington1Mitchell Buchman合作论文数1
 Edward R. Dougherty合作论文数Department of Electrical and Computer Engineering, Dwight Look College of Engineering, Texas A&M University;Genomic Signal Processing Laboratory, Texas A&M University1




