Ground displacement monitoring is a key aspect of assessing the impacts of underground gas storage (UGS). Conventional approaches are based on geodetic methods that, while providing high accuracy, are limited in spatial coverage and temporal resolution. This study assesses the suitability of synthetic aperture radar interferometry (InSAR) as a complement to standard ground displacement monitoring and identifies a method with sufficient accuracy to assess ground displacement conditions and facility safety. A comparative analysis was conducted using European Ground Motion Service (EGMS) data and independently derived Sentinel-1-based time series generated with the small baseline subset (SBAS) and persistent scatterer InSAR (PSI) methods. The analysis of a cavern UGS facility located in northern Poland spanned a five-year period from 2019 to 2023 and included error analysis and significance testing of differences between the methods. Observed displacement rates across the study area ranged from −4.3 mm/year for the SBAS method to −0.4 mm/year for PSI. Although the absolute values of the estimated velocities differed among the methods, the differences between the modeled deformation rates were statistically insignificant. The results confirm that InSAR can supplement geodetic monitoring and help investigate seasonal ground deformations associated with gas injection and withdrawal cycles as well as environmental processes, capturing patterns that discrete geodetic measurements may miss.
Mining activities lead to significant transformations of the original terrain, resulting in development of new post-mining landscape. The objective of this study was to assess the land transformations in the result of prolonged, underground and open-pit mining of shallow brown coal deposits in glaciotectonic structure of Muskau-Arch on the Polish-German border in the context of the geoheritage of this area. With this purpose, a geodatabase of thematic datasets representing progress of mining was developed in a geographic information system (GIS) based on topographical maps, mining plans, photographs, and digital elevation models (DEMs). The following timescales: 1903, 1911, 1937, 1955, 1972 and present-day were digitally reconstructed and quantitatively analysed using spatial processing functions including feature layer overlay and DEM differencing. The original, transitional and present-day landscapes were compared and visualised on five thematic maps and tables describing the spatio-temporal transformation of the natural landscape caused by underground and open-pit mining. Approximately 36.85% of the study area has been transformed, giving rise to the landscape of the present-day Geopark. The results provide insight into the genesis of its geoheritage. The adopted methodology, based on the historical GIS (HGIS) approach, can be applied to other post-mining sites, providing relevant documentation is available.
Ground displacement monitoring is a key aspect of assessing the impacts of underground gas storage (UGS). Conventional approaches are based on geo-detic methods that, while providing high accuracy, are limited in spatial cov-erage and temporal resolution. This study assesses the suitability of synthetic aperture radar interferometry (InSAR) as a complement to standard ground displacement monitoring and identifies a method with sufficient accuracy to assess ground displacement conditions and facility safety. A comparative anal-ysis was conducted using European Ground Motion Service (EGMS) data and independently derived Sentinel-1-based time series generated with the small baseline subset (SBAS) and persistent scatterer InSAR (PSI) methods. The anal-ysis of a cavern UGS facility located in northern Poland spanned a five-year period from 2019 to 2023 and included error analysis and significance testing of differences between the methods. Observed displacement rates across the study area ranged from-4.3 mm/year for the SBAS method to-0.4 mm/year for PSI. Although the absolute values of the estimated velocities differed among the methods, the differences between the modeled deformation rates were sta-tistically insignificant. The results confirm that InSAR can supplement geodetic monitoring and help investigate seasonal ground deformations associated with gas injection and withdrawal cycles as well as environmental processes, captur-ing patterns that discrete geodetic measurements may miss.
Continuous environmental monitoring of post-mining areas is essential, even years after the end of mining activity. Olkusz-Pomorzany mine closure in 2020 included shutting down the water pumps (2022), which resulted in the restoration of the underground water table and subsequent water appearing on the surface. The aim of this study is to analyse spatio-temporal water and vegetation changes in the post-mining and adjacent areas in Olkusz region, Poland, using remote sensing techniques on open-access satellite imagery data. The study uses nine Sentinel-2 images (2022-2024) and spectral indices (Modified Normalized Difference Water Index, Normalized Difference Vegetation Index) to identify and calculate the area of surface water and vegetation condition changes. Indices revealed a total water area of almost 400,000 m2 and a substantial vegetation cover decrease. Using selected indices on open-access data allows the detection of surface water bodies and can provide preliminary results of spatio-temporal analysis of environmental changes in selected post-mining area.
Geological storage is an integral element of the green energy transition. Geological formations, such as aquifers, depleted reservoirs, and hard rock caverns, are used mainly for the storage of hydrocarbons, carbon dioxide and increasingly hydrogen. However, potential adverse effects such as ground movements, leakage, seismic activity, and environmental pollution are observed. Existing research focuses on monitoring subsurface elements of the storage, while on the surface it is limited to ground movement observations. The review was carried out based on 191 research contributions related to geological storage. It emphasizes the importance of monitoring underground gas storage (UGS) sites and their surroundings to ensure sustainable and safe operation. It details surface monitoring methods, distinguishing geodetic surveys and remote sensing techniques. Remote sensing, including active methods such as InSAR and LiDAR, and passive methods of multispectral and hyperspectral imaging, provide valuable spatiotemporal information on UGS sites on a large scale. The review covers modelling and prediction methods used to analyze the environmental impacts of UGS, with data-driven models employing geostatistical tools and machine learning algorithms. The limited number of contributions treating geological storage sites holistically opens perspectives for the development of complex approaches capable of monitoring and modelling its environmental impacts.
Nowadays, satellite remote sensing produces vast amounts of Earth observation data, but without appropriate processing, visualization and interpretation, they are of limited use for a regular user. Web map applications are one of the approaches to share the data online. They allow not only for visualization, but also for analysis and interaction with geographic data. Such web services are used for a variety of purposes, fulfilling informational and educational roles. The SARforMINE is a geoportal service for monitoring, analysis and visualisations of predictive modelling of environmental impacts above underground gas storage facilities. The designed web map application represents information on selected environmental components, ground movements and vegetation condition derived from open-access satellite imagery, SAR and optical respectively. Additionally, historical data are analysed using machine learning for the purpose of predictive modelling of the potential future changes. The proposed approach outlines how web GIS services can augment traditional monitoring of underground gas storage sites.
Underground gas storage (UGS) facilities may cause ground displacements as a result of the cavern convergence or regular gas injection (alternate ground uplift and subsidence). The occurrence and scale of displacements are strongly dependent on the storage time and cavern capacity. At an early stage of facility operation, displacements can be difficult to detect in the presence of wetlands. The main objective of this study was to describe the global and local relationships between vertical ground displacements observed over a small and relatively new Kosakowo UGS facility (Poland) from 2014 to 2024 (dependent variable) and selected topographic, hydrological, and mining factors (independent variables). The dependent variable was determined through SBAS-InSAR analysis of Sentinel-1 SAR data, while the independent variables were developed using passive Sentinel-2 imagery and open geospatial data. The global relationships between variables were described using Ordinary Least Squares (OLS) and Generalized Linear Regression (GLR) models, while the Geographically Weighted Regression (GWR) model was utilized to analyze local relations. The results obtained indicate that ground displacements were characterized by seasonal fluctuations between 4 mm and 10 mm. The factors that had, both globally and locally, the strongest influence were soil moisture, vegetation water content, and the flora condition, indicating that the environmental hydrogeology had the greatest impact on the phenomenon under study. None of the considered models identified underground gas storage as a significant contributing factor to the observed ground displacements. The results confirm that the presence of wetlands can be a significant obstacle to an accurate description of the impact of gas storage on the ground movements, especially in UGS areas at an early stage of operation.
Geological formations are used worldwide for storage of energy sources and carriers such as natural gas and hydrogen, but also carbon dioxide. Caverns in rock salt are a specific type as due to the properties of salt, they are particularly suitable for long term safe and stable storage of various materials. However, the operation interacts with the environment in several ways, with ground movements being the most observed. The purpose of this study was to analyse land cover changes in the vicinity of underground gas storage based on a case study area of Kosakowo, Poland. The region is mainly agricultural with a neglected drainage system, located close to the sea, at low altitude, making it prone to waterlogging. The condition and changes in land surface, with vegetation and surface water monitoring in particular, were analysed using spectral indices derived from the ESA Copernicus Sentinel-2 data. In the study, it was tested and validated whether and if open multispectral satellite data in connection with spatial statistics can be effectively used for monitoring land cover changes in such regions.
Ground deformations in post-mining areas, such as subsidence and uplift, can occur for many decades after the end of mining. This article presents the findings of a5-year monitoring and analysis of ground movement in the post-mining area of the "Babina" mine, situated within the glacitectonic Muskau Arch. The study was aimed at analyzing continuous ground deformations observed using precision levelling. The measurement data were statistically processed and visualized using maps and graphs. The results indicate significant ground movements that vary seasonally and between different parts of the complex post-mining area. This points to additional research questions on the causes of these movements that could be attributed to groundwater table variation that should be further analysed. The article draws attention to the need of continuous monitoring of post-mining sites and integration of measurement results with additional data to gain a more comprehensive understanding of the processes taking place in post-mining areas.
Climate change and intensive urbanisation contribute to an increase in groundwater temperatures, leading to the development of the subsurface urban heat island (SubUHI) and Groundwater Urban Heat Island (GUHI) phenomenon. This article presents the results of comparative studies conducted in Wrocław (Poland) in two measurement campaigns in 2004–2005 and 2022–2024. The study aimed to assess long-term thermal changes in groundwater in relation to air temperature using statistical and spatial analyses. The data were processed using descriptive methods, interpolation (ordinary kriging), map algebra, and correlation analysis (Pearson). The results indicate a clear warming of groundwater, especially in the winter season, where the average temperature increase ranged from 2 to 4 °C compared to the first measurement period. The most substantial changes were observed in shallow Quaternary aquifers, showing a strong correlation with air temperature (r ≈ 0.8). Spatial analyses revealed the major groundwater temperature (GWT) increases in the city centre and densely built-up districts, confirming the intensification of the GUHI effect. In addition, a decrease in the seasonal amplitude of GWT and a local lowering of the water table were observed.
Mining has a lasting impact on the environment, not only during the active mining process but also long after operations cease. The anthropogenic landforms that remain after mining require monitoring due to the instability of the land, which may pose a threat to the local environment. This paper presents bathymetric data acquired as part of the monitoring process for postmining lakes, collected using an unmanned surface vehicle (USV). The data were gathered with a Satlab SLD-200 single-beam echosounder and a Trimble R6 GNSS receiver to measure the lakebed elevation. By comparing data from two different periods, a high-accuracy 3D representation of the lakebed was produced, enabling the detection of changes in lake depth over time. The observed elevation change suggests that the area may still be affected by mining activities that occurred decades ago. This open dataset provides valuable insights for further research on the impact of underground and open-pit mining on the environment and its degradation.
Muskau Arch is a moraine structure formed as a result of the multistage impact of the Scandinavian ice sheet. Between 1920 and 1972 intensive lignite underground and open-cast mining operations took place there. In addition to brown coal, glass sand and ceramic clay deposits were exploited, causing extensive and varied anthropogenic transformations in the entire region. Although mining activities ended approximately 50 years ago, secondary ground deformations and other post-mining processes (e.g. waste dump erosion) continue to this day. Based on the rich geological, mining and cultural heritage a Muskau Arch Geopark that belongs to the UNESCO Global Geopark Network has been established there.The primary purpose of the landscape transformation map is to document and illustrate the extent and types of anthropogenic transformations within the “Pustków” field of the old "Babina" lignite mine located in the Muskau Arch. The map was developed using free and open-source GIS software QGIS that allows for the integration of various geospatial data thematic layers and provides tools for effective analysis and geo visualization. Open data and data acquired within the NCN financed research projects were used to prepare the landscape transformation map.The concept of the graphical presentation is based on the main map and three subsidiary, insert, maps. The content of the main map includes thematic layers representing: the extent of glaciotectonic transformations, location and types of open-cast and underground mining objects, e.g.: external and internal waste dumps, abandoned pits, anthropogenic lakes, remains of mining infrastructure on the surface such as: railway tracks, shafts, extent of continuous and discontinuous ground deformations from underground mining. In addition, present day land development (built-up area, road network, stream network) against the background of terrain elevation in the form of isolines. Finally, new tourist development of the reclaimed post-mining land is presented. The insert maps illustrate: the location of the area of interest in the geographical context, perspective view of the anthropogenically transformed post-mining area based on present-day digital elevation model derived from aerial laser scanning data, 3D visualization of underground workings.The compiled material is a valuable contribution to the documentation and understanding of the evolution of the post-mining landscape in the Muskau Arch area. The map can be used for educational purposes and to effectively manage the area, as it contains information on the location of mining infrastructure. The map not only shows the mining history of the region, but can help in making decisions about further reclamation of the area and promoting the sustainable development of the Geopark.The research has been financed from the OPUS National Science Centre projects grant no. 2019/33/B/ST10/02975 and grant no 2021/43/B/ST10/02157.
Mining affects groundwater and surface water both during an active mining operation and after its termination. Continuous monitoring and both quantitative and qualitative assessment of water dynamics are crucial for the sustainable management of the mining and post-mining environment. This paper provides an extensive overview of water in the mining industry and of remote sensing methods for surface water monitoring. Moreover, selected spectral water indices are compared to assess their performance and usefulness in surface water monitoring. The Normalized Difference Vegetation Index (NDVI), Normalized Difference Water Index (NDWI), and Modified Normalized Difference Water Index (MNDWI) are applied to different case study areas affected by mining-induced multitemporal surface water changes. All the selected indices were found useful as proxies for surface water identification; however, their effectiveness and accuracy varied in subsequent case studies.
Post-mining areas require constant monitoring due to the risk of secondary ground movements of a continuous or discontinuous nature. This study focuses on the analysis of ground movements in the post-mining area of the “Babina” mine in Western Poland. The complex nature of the “Muskau Arch” glaciotectonic area, subjected to both underground and open pit mining, further complicates the understanding and monitoring of these movements. The study site was subjected to precise levelling monitoring between 2020 and 2023, and the results of five measurement campaigns form the basis of the analysis, with the first measurement being the reference for the subsequent ones. For this purpose, a geodetic monitoring network was established to cover key locations in the “Babina” mine area. The network was made up of 99 control points set-up as concrete pillars with metal control bolts and was connected to 4 reference benchmarks of the national levelling network situated beyond the post-mining area. In addition, 7 local research networks have been established in specific study sites. The levelling measurements were carried out using geodetic precision levelling. The total length of the levelling lines was approximately 36 km. The ground movements recorded between the first (initial), carried out in May 2020, and the last measurement campaign, in September 2023, range from -5.58 mm to +4.97 mm. Ground movements in the specific dense networks range from -39.46 mm to +115.39 mm. Three interpolation methods were used to obtain continuous maps of the ground movements from discrete levelling observations: Inverse Distance Weighted, Radial Basis Function and Ordinary Kriging. The latter technique produced the smallest root-mean-square errors assessed with the cross-validation technique. In the result, we obtained 24 maps representing elevation changes between the first and the last measurement, as well as maps representing movements between consecutive measurements. The maps of ground movements were used to identify areas of statistically significant displacements and to analyse the evolution of these displacements over time and in relation to the extent of past underground and open-pit mining activities and current land use. The results indicate present-day activity of the ground in the post-mining area that varies in the magnitude and direction of movements in different parts of this complex area. The observed seasonal fluctuations may indicate relationship of benchmark movements with periodic change of ground water level and the effect of climate change. Our findings confirm the presence of ground movements in post-mining area five decades after the end of mining activity and of varied nature, as well as substantiate the need for further investigation of this activity in the study area. These should include detailed analysis of the relation between groundwater level and benchmark heights and correlation of movements with the extent of shallow underground mining. The research has been financed from the OPUS National Science Centre projects grant no. 2019/33/B/ST10/02975 and grant no 2021/43/B/ST10/02157.
The smart cities necessitate the advanced operational information and communication technology to share and improve efficiency with the nation. The datasets of high traffic roads were examined for 4 different European Countries namely Germany, Greece, Turkey, and Romania for this study. Moreover, the study involves the identifying the busy traffic time on the roads and identifies the solution of following the other routes enabling the commuter to reach the destination on time. This is carried out with deep learning techniques in GIS environment using ArcGIS to identify the different route-finding scenario. The Dijkstra’s algorithm is best suited for this routing model. This study revolves around multimodal transport planning within smart cities for smart traffic flow for smart living. A case study of Greece street roads was considered; the linear regression model was implemented for the datasets. The obtained p > |t| for average speed is Stratigou Makrigianni (0.906), Agias Annis (0.754), Mystra (0.675), and Komvos Ag.loanni Renti (0.470). The study reflects the traffic congestion on four European Countries with best roads and national highways in the world. However, the traffic in these countries seems to be heavy during the peak hours or unusual hours. With GIS, one can trace the traffic routes and also take proper decision to avoid the traffic, and move toward the destination with different paths. This approach will help the closeby places to be free from the pollution.
The goal of this study was to develop a model describing the relationship between the ground-displacement-caused tremors induced by underground mining, and mining and geological factors using the Random Forest Regression machine learning method. The Rudna mine (Poland) was selected as the research area, which is one of the largest deep copper ore mines in the world. The SAR Interferometry methods, Differential Interferometric Synthetic Aperture Radar (DInSAR) and Small Baseline Subset (SBAS), were used in the first case to detect line-of-sight (LOS) displacements, and in the second case to detect cumulative LOS displacements caused by mining tremors. The best-prediction LOS displacement model was characterized by R2 = 0.93 and RMSE = 5 mm, which proved the high effectiveness and a high degree of explanation of the variation of the dependent variable. The identified statistically significant driving variables included duration of exploitation, the area of the exploitation field, energy, goaf area, and the average depth of field exploitation. The results of the research indicate the great potential of the proposed solutions due to the availability of data (found in the resources of each mine), and the effectiveness of the methods used.
Due to an urgent need to reduce the fast-progressing climate changes, a rapid, standardized and replicable solution for the infrastructure restructuring of the heat demand coverage of buildings at the district and city levels must be developed. As more and more communities in Europe, especially in Germany, are obligated to have plans for coverage of the heat demand, city planners and energy agencies seek a tool that will help them to design the first drafts of heating network routes, which can supply whole districts and cities with renewable energy. ArcGIS Pro Tools like Least-Cost-Path Analysis (LCPA) and Closest Facility (CF) allow us to find the shortest and “cheapest” way between the heat source and heat consumers in the analyzed areas. Starting from the community level, through the district, county, voivodeship and whole-country levels, the replication of the methods for generating district heating (DH) network infrastructure can be achieved. The proposed LCPA- and CF-based methods help to design the most suitable and efficient DH networks in the analyzed areas. As only a few open-source data inputs, like street networks and building footprints, are needed, the methods can be implemented in all communities in the country of Poland. In this paper, one example of one community in Wroclaw county, called Siechnice, and its surroundings is presented.
Discontinuous deformations, such as sinkholes, pose significant challenges in post-mining areas due to their unpredictable nature and potential hazard to surface development and the safety of local communities. Therefore, monitoring the post-mining regions should be treated as a continuing task. This study addresses the ongoing problem of sinkhole formation in the former "Przyjazn Narodow- Szyb Babina" (Babina) lignite mine located in the glaciotectonic region of Muskau Arch in western Poland. The research uses airborne and terrestrial laser scanning methods to identify and monitor discontinuous deformations, focusing on a newly discovered sinkhole. The methodology involves differential analysis of Digital Elevation Models (DEMs) and their derivatives obtained from airborne laser scanning (ALS) and periodic terrestrial laser scanning (TLS) measurements. The results of ALS DEM analysis allowed the successful identification of 75 confirmed sinkholes, the largest measuring 12.8 m in diameter and 4.8 m deep. Whereas, differential DEM analysis indicated new sinkholes that developed between 2011 and 2020 in the area of shallow underground mining. Two-year TLS monitoring of the new sinkhole showed no progression in its dimensions. However, localised erosion processes associated with water transport were detected. The study shows that sinkhole formation processes are active 5 decades after the end of mining and highlights the importance of continuous monitoring of post-mining areas with advanced laser scanning methodss.
Mobile GIS allows users who work in the field to acquire, edit, update, store, display and analyse data. It combines modern technologies such as mobile devices (tablet, smartphone), software (applications in Android and iOS), location of a point / place using GNSS transmitter and providing wireless connectivity via the internet. An important step in any scientific research should be the verification of the obtained results, which can be done by using a modern tool such as mobile GIS. In this article the characteristics of mobile GIS will be presented as well as selected examples of modern research carried out at universities in Germany: Technische Hochschule Georg Agricola University (THGA), Technical University Bergakademie Freiberg (TUBAF) and Poland – Wrocław University of Science and Technology (WUST).
In Wrocław over the past 20 years, the recorded increase in the average ambient air temperature is approx. 0.5 °C. In addition, urbanisation has created a phenomenon called the Urban Heat Island (UHI). The combined effect of the UHI and climate change can influence groundwater temperature by penetrating underground. The phenomenon of elevated groundwater temperatures in urban areas is called the Subsurface Urban Heat Island (SSUHI). This study focuses on the spatial distribution of temperature in shallow aquifers in the city of Wroclaw. The spatial distribution was analysed based on groundwater temperature maps developed with various interpolation techniques. The results of measurements in a network of 65 piezometers conducted in the 2004-2005 hydrological year have been used in this study. The temperatures recorded show seasonal variation with the lowest recorded in February (1.3 °C) and the highest in August (24.5 °C) with the annual average of 13.2 °C. The data has been processed with the Inverse Distance Weighted (IDW), Radial Basis Function (RBF) and Kriging interpolation methods. Furthermore, the cokriging method based on multivariate linear regression models has been used to assess if variable such as distance from the city centre improve the interpolation performance expressed as the lowest RMS error value. It has been established that the Kriging univariate regression model based interpolation method produced the best results (RMS error equal to 1.33 °C) and that the distance from the city centre has improved the accuracy of interpolation.
 j gorniakzimroz合作论文数Fac Geoengn Min & Geol, Wroclaw Univ Sci & Technol21
 Wojciech Milczarek合作论文数Dept Geodesy & Geoinformat, Wroclaw Univ Sci & Technol20
 Katarzyna Pactwa合作论文数Fac Geoengn Min & Geol, Wroclaw Univ Sci & Technol16
 Anna Buczynska合作论文数10
 Leszek Piotr Jurdziak合作论文数Institute of Mining Eng;Wroclaw University of Technology;Institute of Mining Eng, Wroclaw University of Technology10
 Witold Kawalec合作论文数Institute of Mining Eng;Wroclaw University of Technology;Institute of Mining Eng, Wroclaw University of Technology9Stefan Cacon合作论文数8
 j koźma合作论文数Geological Institute7
 Piotr Grzempowski合作论文数Dept Geotechnol Hydro Technol & Underground & Hyd, Wroclaw Univ Technol7
 Grazyna Slusarczyk合作论文数Faculty of Physics;Astronomy and Applied Computer Science;Jagiellonian University;Faculty of Physics|Astronomy and Applied Computer Science, Jagiellonian University7j specylakskrzypecka合作论文数6
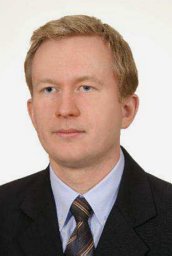 Wajs Jaroslaw合作论文数Faculty of Geoengineering, Mining and Geology, Wroclaw University of Science and Technology6Miłosz Becker合作论文数5
 Paulina Kujawa合作论文数Fac Geoengn Min & Geol, Wroclaw Univ Sci & Technol5
 Anna Nowacka合作论文数Fac Management, Czestochowa Tech Univ5
 Karolina Owczarz合作论文数5m duczmal合作论文数4Ewa Warchala合作论文数4Natalia Walerysiak合作论文数4
 Pawel Stefaniak合作论文数KGHM Cuprum Research and Development Centre Ltd.4
 Steinar L. Ellefmo合作论文数Department of Geology and Mineral Resources Engineering;Department of Mathematical Sciences;Department of Geology and Mineral Resources Engineering|Department of Mathematical Sciences4Aleksandra Dynowski合作论文数3Monika Hajnrych合作论文数3
 Natalia Bugajska-Jedraszek合作论文数3
 Paweł Trybała合作论文数Fac Geoengn Min & Geol, Wroclaw Univ Sci & Technol3
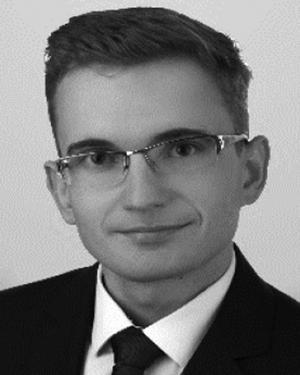 Dariusz Głabicki合作论文数Dept Geodesy & Geoinformat, Wroclaw Univ Sci & Technol3
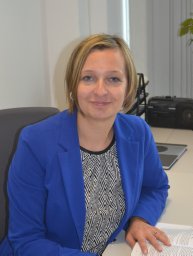 Urszula Kaźmierczak合作论文数Dept Min, Wroclaw Univ Sci & Technol3
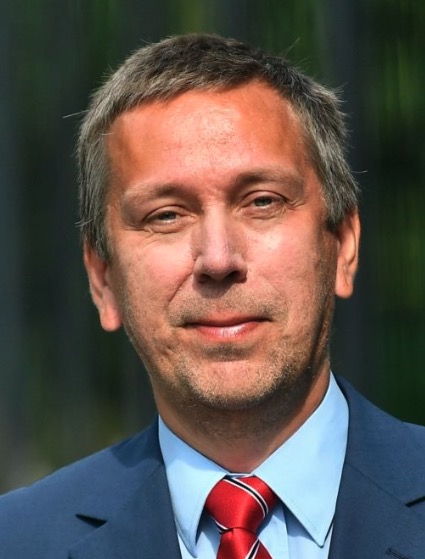 Radoslaw Zimroz合作论文数Department of Mining, Faculty of Geoengineering, Mining and Geology, Wroclaw University of Science and Technology;Machinery Systems Division, Wroclaw University of Science and Technology3a borowicz合作论文数2
 Magdalena Worsa-Kozak合作论文数Fac Geoengn Min & Geol, Wroclaw Univ Sci & Technol2
 Tadeusz Głowacki合作论文数Fac Geoengn Min & Geol, Wroclaw Univ Sci & Technol2
 Anna Kopec合作论文数Dept Geodesy & Geoinformat, Wroclaw Univ Sci & Technol2
 Jacek Wodecki合作论文数Fac Geoengn Min & Geol, Wroclaw Univ Sci & Technol2j szrek合作论文数Fac Mech Engn, Wroclaw Univ Sci & Technol2
 Tomasz Zatonski合作论文数Department of Otolaryngology, Wroclaw Medical University2Tobias Rudolph合作论文数1Bodo Bernsdorf合作论文数1pavel kadlecik合作论文数1Zagrodnik Paulina合作论文数1Natalia Bugajska-Jędraszek合作论文数1
 Marcin Pawlik合作论文数1Marcin Zając合作论文数1André John合作论文数1
 Artur Skoczylas合作论文数Faculty of Management, Wroclaw University of Economics and Business1
 Bartłomiej Ziętek合作论文数Faculty of Geoengineering, Mining and Geology, Wrocław University of Science and Technology1
 Anna Gladka合作论文数1S. Anufriiev合作论文数1Bartosz Jachnik合作论文数KGHM Cuprum Res & Dev Ctr Ltd, Gen W Sikorskiego 2-8, PL-53659 Wroclaw, Poland1
 Yaroslav Bezyk合作论文数Fac Environm Engn, Wroclaw Univ Sci & Technol1




