Radiometric measurements of precipitable water vapor were made at Porto Santo Island, Madeira, Portugal, over a one-year period. Temporal variability of the precipitable water vapor is estimated using structure functions. The power law index of the structure functions is compared to values predicted by a statistical model of water vapor fluctuations.
Measurements of precipitable water vapor, cloud liquid, and cloud-base temperature made at Porto Santo Island, Madeira Archipelago, are presented. The observations were made continuously over a 1-yr period from July 1992 to June 1993. Instrumentation consisted of a 20- and 31-GHz ground-based microwave radiometer for measurement of water vapor and cloud liquid, and a 10.7-mu m infrared radiometer for measurement of cloud-base temperature, A statistical summary of the data is presented for clear and cloudy conditions, considered both separately and combined. The mean and variance of precipitable water vapor are smaller during clear than during cloudy periods. Values of water vapor during the winter are 26% smaller than during summer months. The mean decorrelation time of precipitable water vapor is generally found to be less than 12 h.
From 6 January to 28 February 1993, the second phase of the Pilot Radiation Observation Experiment (PROBE) was conducted in Kavieng, Papua New Guinea. Routine data taken during PROBE included radiosondes released every 6 h and 915-MHz Wind Profiler-Radio Acoustic Sounding System (RASS) observations of winds and temperatures. in addition, a dual-channel Microwave Water Substance Radiometer (MWSR) at 23.87 and 31.65 GHz and a Fourier Transform Infrared Radiometer (FTIR) were operated. The FTIR operated between 500 and 2000 cm(-1) and measured some of the first high spectral resolution (1 cm(-1)) radiation data taken in the Tropics. The microwave radiometer provided continuous measurements within 30-s resolution of precipitable water vapor (PWV) and integrated cloud liquid, while the RASS measured virtual temperature profiles every 30 min. In addition, occasional lidar soundings of cloud-base heights were available. The MWSR and FTIR data taken during PROBE were compared with radiosonde data. Significant differences were noted between the MWSR and the radiosonde observations of PWV. The probability distribution of cloud liquid water was derived and is consistent with a lognormal distribution. During conditions that the MWSR did not indicate the presence of cloud liquid water, broadband long- and shortwave irradiance data were used to identify the presence of cirrus clouds or to confirm the presence of clear conditions. Comparisons are presented between measured and calculated radiance during clear conditions, using radiosonde data as input to a line-by-line Radiative Transfer Model. A case study is given of a drying event in which the PWV dropped from about 5.5 cm to a low of 3.8 cm during a 24-h period. The observations during the drying event are interpreted using PWV images obtained from data from the Defense Meteorological Satellite Program/Special Sensor Microwave/Imager and of horizontal flow measured by the wind profiler. The broadband irradiance data and the RASS soundings were also examined during the drying event.
Observations of water vapor and cloud liquid made with surface‐based microwave radiometers operating near 20, 23, 31, and 90 GHz are described. Measurements were made at several continental locations in the United States, an island and ship in the northern Atlantic Ocean, and an island and ship in the tropical western Pacific Ocean. The instrumentation and statistical inversion technique employed to retrieve vapor and liquid values from radiometric brightnesses are reviewed. Various aspects of the water vapor and cloud liquid data are compared as a function of geographic location. The diurnal and seasonal variability of water vapor, cloud liquid, cloud fraction, and infrared sky brightness temperature observed during a 1‐year period at an island in the North Atlantic Ocean are also presented.
We show a method for determining stratus cloud liquid water profiles using a microwave radiometer and cloud radar. This method is independent of the radar calibration and the cloud‐droplet size distribution provided that the sixth moment of the size distribution can be related to the square of the third moment. We have calculated these moments with a wide variety of in situ measurements and show that this is a reasonable assumption. Examples of droplet distributions that meet this requirement are the lognormal and gamma distributions.
Ice cloud microphysical parameters derived from a remote sensing method that uses ground-based measurements from the Environmental Technology Laboratory's K-a-band radar and an IR radiometer are compared to those obtained from aircraft sampling for the cirrus priority event from the FIRE-II experiment. Aircraft cloud samples were taken not only by traditional two-dimensional probes but also by using a new video sampler to account for small particles. The cloud parameter comparisons were made for time intervals when aircraft were passing approximately above ground-based instruments that were pointed vertically. Comparing characteristic particle sizes expressed in terms of median mass diameters of equal-volume spheres yielded a relative standard deviation of about 30%. The corresponding standard deviation for the cloud ice water content comparisons was about 55%. Such an agreement is considered good given uncertainties of both direct and remote approaches and several orders of magnitude in natural variability of ice cloud parameters. Values of reflectivity measured by the radar and calculated from aircraft samples also showed a reasonable agreement; however, calculated reflectivities averaged approximately 2 dB smaller than those measured. The possible reasons for this small bias are discussed. Ground-based and aircraft-derived particle characteristic sizes are compared to those available from published satellite measurements of this Parameter for the cirrus priority case from FIRE-II. Finally, simultaneous and collocated, ground-based measurements of visible (0.523 nm) and longwave IR (10-11.4 mu m) ice cloud extinction optical thickness obtained during the 1995 Arizona Program are also compared. These comparisons, performed for different cloud conditions, revealed a relative standard deviation of less than 20%; however, no systematic excess of visible extinction over LR extinction was observed in the considered experimental events.
This paper describes the use of a vertically pointing 8.6-mm-wavelength Doppler radar for measuring drop size spectra in clouds. The data used were collected in the Atlantic Stratocumulus Transition Experiment in 1992. This paper uses the full Doppler velocity spectrum from the time series of Doppler radial velocities to extract information farther into the small-drop regime than previously attempted. The amount of liquid residing in the cloud regime is compared with that found in the precipitation regime where drop fall velocities are resolvable. Total liquid is compared with that measured with a collocated three-channel microwave radiometer. Examples of number density spectra, liquid water spectra, and flux spectra are shown and compared with what is known of these quantities from various in situ measurements by aircraft in similar clouds. Error estimates and uncertainties are discussed. It is concluded that 8-mm Doppler radars have the potential for broader use in cloud and precipitation studies than generally realized.
Twelve national research organizations joined forces on a 30-day, 6800 n mi survey of the Central and Tropical Western Pacific on NOAA's Research Vessel Discoverer. The Combined Sensor Program (CSP), which began in American Samoa on 14 March 1996, visited Manus Island, Papua New Guinea, and ended in Hawaii on 13 April, used a unique combination of in situ, satellite, and remote sensors to better understand relationships between atmospheric and oceanic variables that affect radiative balance in this climatically important region. Besides continuously measuring both short-wave and longwave radiative fluxes, CSP instruments also measured most other factors affecting the radiative balance, including profiles of clouds (lidar and radar), aerosols (in situ and lidar), moisture (balloons, lidar, and radiometers), and sea surface temperature (thermometers and Fourier Transform Infrared Radiometers). Surface fluxes of heat, momentum, and moisture were also measured continuously. The Department of Energy's Atmospheric Radiation Measurement Program used the mission to validate similar measurements made at their CART site on Manus Island and to investigate the effect (if any) of large nearby landmasses on the island-based measurements.
Algorithms have been developed to calculate the vertical profiles from cloud radar reflectivity measurements and microwave radiometer measurements of integrated liquid water. In addition, the algorithms calculate the effective radius profiles, and the total number of cloud droplets. When drizzle is present, radar reflectivity, vertical velocity and the spread of the vertical velocity can be used to calculate vertical profiles of liquid water, liquid water flux, effective radius, and droplet number. When there is no drizzle, the authors can use the Doppler capability to profile various vertical velocity turbulence parameters, such as the vertical velocity spectra, variance, and skewness. All parameters are important in the development of cloud models. Data taken during ASTEX (Atlantic Stratocumulus Transition Experiment) have been used to study the behavior of stratus clouds at Porto Santo Island, Madeira, Portugal.
We present a collection of research related to radar measurements of turbulence and microphysical properties in clouds. The radars used in these studies operate at frequencies ranging from 404 MHz to 34.6 GHz, We discuss the relative contributions made by the two primary radar scattering mechanisms to the measured values of radar reflectivity at the different frequencies. The desired turbulence and microphysical information is obtained from the radar reflectivity and other elements of the Doppler velocity spectra. Methods and examples are given with emphasis on liquid water clouds associated with the marine boundary layer.
Observations from a wide variety of instruments and platforms are used to validate many different aspects of a three-dimensional mesoscale simulation of the dynamics, cloud microphysics, and radiative transfer of a cirrus cloud system observed on 26 November 1991 during the second cirrus field program of the First International Satellite Cloud Climatology Program (ISCCP) Regional Experiment (FIRE-II) located in southeastern Kansas. The simulation was made with a mesoscale dynamical model utilizing a simplified bulk water cloud scheme and a spectral model of radiative transfer. Expressions for cirrus optical properties for solar and infrared wavelength intervals as functions of ice water content and effective particle radius are modified for the midlatitude cirrus observed during FIRE II and are shown to compare favorably with explicit size-resolving calculations of the optical properties. Rawinsonde. Raman lidar, and satellite data are evaluated and combined to produce a time-height cross section of humidity at the central FIRE-II site for model verification. Due to the wide spacing of rawinsondes and their infrequent release, important moisture features go undetected and are absent in the con ventional analyses. The upper-tropospheric humidities used for the initial conditions were generally less than 50% of those inferred from satellite data, yet over the course of a 24-h simulation the model produced a distribution that closely resembles the large-scale features of the satellite analysis. The simulated distribution and concentration of ice compares favorably wi th data from radar, lidar, satellite, and aircraft. Direct comparison is made between the radiative transfer simulation and data from broadband and spectral sensors and inferred quantities such as cloud albedo, optical depth, and top-of-the atmosphere 11-mu m brightness temperature, and the 6.7-mu m brightness temperature. Comparison is also made with theoretical heating rates calculated using the rawinsonde data and measured ice water size distributions hear the central site. For this case study, and perhaps for most other mesoscale applications, the differences between the observed and simulated radiative quantities are due more to errors in the prediction of ice water content, than to errors in the optical properties or the radiative transfer solution technique.
Surface measurements of atmospheric emission at 20, 31, and 90 GHz have been compared to theoretical values calculated from simultaneous radiosonde measurements and well-known absorption models. Measurements were made at continental locations in the United States, and islands and ships in the Atlantic and tropical western Pacific oceans. Observations of clear sky emission in the tropics during 1993 showed much poorer agreement with theoretical emission than observed at continental locations. The reason for the larger discrepancy in the tropics may be due to errors in the radiosonde humidity element when operated in the extremely humid environment. In order to obtain additional insight into the cause of the discrepancy, a second set of simultaneous emission and radiosonde measurements in the tropical Pacific region was obtained during a cruise of the NOAA research vessel Discoverer from 15 March to 13 April 1996. Measurements and theoretical emission are compared for both the 1993 and 1996 data sets
Surface observations of atmospheric emission at 20, 31, and 90 GHz are compared with values predicted by theoretical models using radiosonde input data. Measurements are shown for continental locations in the United States, and shipboard- and island-based sites in the North Atlantic and tropical Pacific Oceans. Measurements are compared with commonly-used prediction models of Liebe. Differences between measurements and theory during clear conditions are shown to be caused largely by differences in the radiosonde humidity element. The impact of the observed discrepancies upon ground-based radiometric measurements of water vapor is discussed. A method to account for the differences and to reduce the water substance measurement error is presented
To improve radiative transfer calculations for inhomogeneous clouds, a consistent means of modeling inhomogeneity is needed. One current method of modeling cloud inhomogeneity is through the use of fractal parameters. This method is based on the supposition that cloud inhomogeneity over a large range of scales is related. An analysis technique named wavelet analysis provides a means of studying the multiscale nature of cloud inhomogeneity. In this paper, the authors discuss the analysis and modeling of cloud inhomogeneity through the use of wavelet analysis.Wavelet analysis as well as other windowed analysis techniques are used to study liquid water path (LWP) measurements obtained during the marine stratocumulus phase of the First ISCCP (International Satellite Cloud Climatology Project) Regional Experiment. Statistics obtained using analysis windows, which are translated to span the LWP dataset, are used to study the focal (small scale) properties of the cloud field as well as their time dependence. The LWP data are transformed onto an orthogonal wavelet basis that represents the data as a number of times series. Each of these time series lies within a frequency band and has a mean frequency that is half the frequency of the previous band. Wavelet analysis combined with translated analysis windows reveals that the local standard deviation of each frequency band is correlated with the local standard deviation of the other frequency bands. The ratio between the standard deviation of adjacent frequency bands is 0.9 and remains constant with respect to time. This ratio defined as the variance coupling parameter is applicable to ail of the frequency bands studied and appears to be related to the slope of the data's power spectrum.Similar analyses are performed on two cloud inhomogeneity models, which use fractal-based concepts to introduce inhomogeneity into a uniform cloud field. The bounded cascade model does this by iteratively redistributing LWP at each scale using the value of the local mean. This model is reformulated into a wavelet multiresolution framework, thereby presenting a number of variants of the bounded cascade model. One variant introduced in this paper is the ''variance coupled model,'' which redistributes LWP using the local standard deviation and the variance coupling parameter. While the bounded cascade model provides an elegant two-parameter model for generating cloud inhomogeneity, the multiresolution framework provides more flexibility at the expense of model complexity. Comparisons are made with the results from the LWP data analysis to demonstrate both the strengths and weaknesses of these models.
Inhomogeneous distributions of liquid water like those observed in real clouds generally reflect less solar radiation than idealized uniform distributions assumed in plane-parallel theory. Here the authors determine cloud reflectivity and the associated plane-parallel albedo bias from distributions of liquid water path derived from 28 days of microwave radiometer measurements obtained on Porto Santo Island in the Madeiras during June 1992 as part of the Atlantic Stratocumulus Transition Experiment (ASTEX). The distributions are determined for each hour of the day, both for composites of the full set of 28 days and for a subset of 8 days having a high fraction of relatively thick cloud. Both sets are compared with results obtained from California stratocumulus during FIRE [First ISCCP (International Satellite Cloud Climatology Project) Regional Experiment].In FIRE the albedo bias was dominated by the variability of the cloud optical depth, as measured by a fractal parameter, 0 less than or equal to f less than or equal to 1, while the ASTEX results are more complex. Mean cloud fraction above a 10 g m(-2) threshold is about 50% in the 28-day set, compared to 76% in the 8-day subset and 82% in FIRE, Cloud fraction is sensitive to the threshold for the 28 ASTEX days, probably due to a large fraction of thin cloud below the threshold, but this is not the case for the 8-day subset or for FIRE. Clear fractions during ASTEX are generally of shorter duration than those in FIRE, as are those in the 8-day subset. The diurnal mean fractal parameter is about 0.6 in ASTEX compared to 0.5 in FIRE, while the 8-day subset has nearly the same mean but a wider range. The diurnal cycle in cloud albedo and albedo bias is computed from the cloud parameters for both sets, assuming zero clear-sky albedo. The total absolute albedo bias rises to values above 0.3 at sunrise and sunset, but since there is little incident energy at that time, the reflected flux is more affected by the midday bias. The total albedo bias has a 1000 LST maximum of about 0.3, largely due to a cloud fraction contribution of 0.2, absent in FIRE because in that case cloud fraction remains near 100% until after 1000 LST. The albedo bias has a second maximum of about 0.2 at noon, again mainly from cloud fraction, and then drops to a minimum of about 0.1 at 1400 LST, when cloud fraction and fractal structure contribute about equally. Finally, a third maximum due to cloud fraction occurs at 1600 LST.In the 8-day subset, the 1000 LST maximum becomes dominated by the fractal structure, since the cloud fraction remains near 100% until 1000 LST, as in FIRE. The noon maximum receives roughly equal contributions, while the 1400 LST minimum bias is mainly due to fractal structure. Finally, the 1600 LST maximum and the evening limb bias are similar to those of the full 28-day set. These results show that cloud fractal and radiative properties can vary considerably from one site and time to another, and at different times within the same site, as meteorological conditions change.
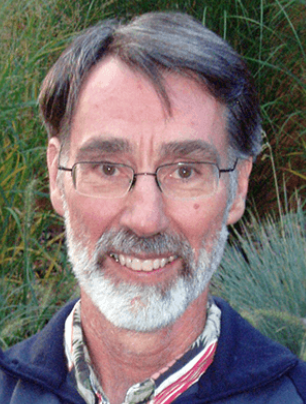 Chris Fairall合作论文数Physical Science Division, Earth Systems Research Laboratory, National Oceanic and Atmospheric Administration;Physical Sciences Laboratory, National Oceanic and Atmospheric Administration19
 Sergey Y. Matrosov (Sergey Matrosov)合作论文数Cooperative Institute for Research in Environmental Sciences, University of Colorado Boulder13
 a s frisch合作论文数12Ra Kropfli合作论文数9
 Taneil Uttal合作论文数Environmental Technology Laboratory9
 Edgeworth R. Westwater合作论文数Department of Electrical, Computer, and Energy Engineering, University of Colorado Boulder9Brooks E. Martner合作论文数8Bw Orr合作论文数7
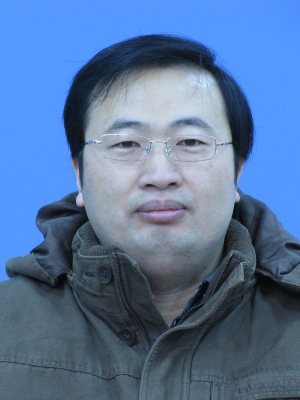 Yong Han (韩永)合作论文数School of Atmospheric Sciences, Sun Yat-sen University;Southern Marine Science and Engineering Guangdong Laboratory (Zhuhai)7
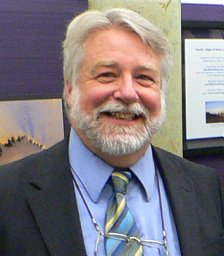 Robert F. Cahalan合作论文数Sun-Climate Research Center, Goddard Space Flight Center, NASA6
 Mark Z. Jacobson合作论文数Civil & Environmental Engineering Department, School of Engineering & Doerr School of Sustainability, Stanford University6
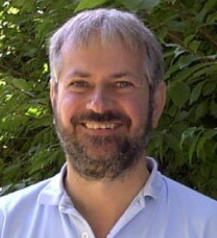 Robert M Rauber合作论文数Department of Climate, Meteorology & Atmospheric Sciences, School of Earth, Society & Environment, College of Liberal Arts & Sciences, University of Illinois at Urbana-Champaign5Ed R. Westwater合作论文数5D. C. Hogg合作论文数4Rf Reinking合作论文数4
 Joseph A. Shaw合作论文数Department of Electrical and Computer Engineering, Montana State University4
 James H. Churnside合作论文数NOAA Chemical Sciences Laboratory4
 Donald H. Lenschow (Don Lenschow)合作论文数Mesoscale and Microscale Meteorology Laboratory, National Center for Atmospheric Research4
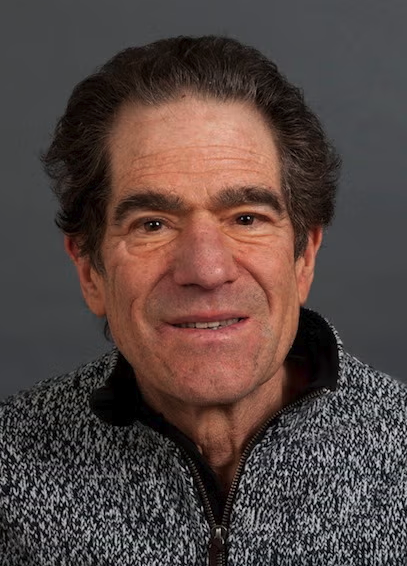 Andrew Heymsfield合作论文数Mesoscale and Microscale Meteorology Lab, National Center for Atmospheric Research, University Corporation for Atmospheric Research4S Harvey Melfi合作论文数Laboratory for Atmospheres;NASA / Goddard Space Flight Center;Laboratory for Atmospheres, Goddard Space Flight Center4Robert a Kropfli合作论文数4
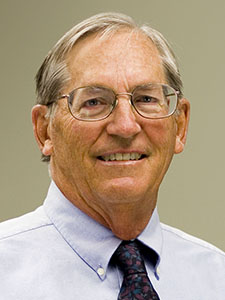 Wayne H. Schubert合作论文数Department of Atmospheric Science, Colorado State University4D. A. Hazen合作论文数4
 Allen B. White合作论文数Physical Sciences Division (PSD), NOAA Earth System Research Laboratory4Lo Grant合作论文数3
 Janet Intrieri合作论文数NOAA-Environmental Technology Laboratory3
 David F. Young合作论文数3
 Steven M Gollmer合作论文数3Wynn L. Eberhard合作论文数3Christopher M. Johnson-Pasqua合作论文数2Fo Guiraud合作论文数2j e hare合作论文数2
 Thomas Guinn合作论文数Dept Appl Aviat Sci, Embry Riddle Aeronaut Univ2Gp Byrd合作论文数2harshvardhan合作论文数2
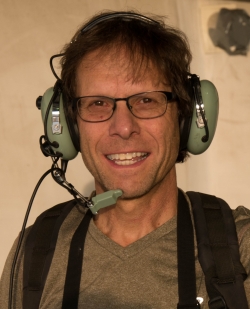 Graham Feingold合作论文数Chemical Sciences Laboratory, National Oceanic and Atmospheric Administration2
 Bruce A. Albrecht合作论文数Department of Atmospheric Sciences, Rosenstiel School of Marine, Atmospheric, and Earth Science, University of Miami2
 Richard Ferrare合作论文数NASA Langley Research Center2
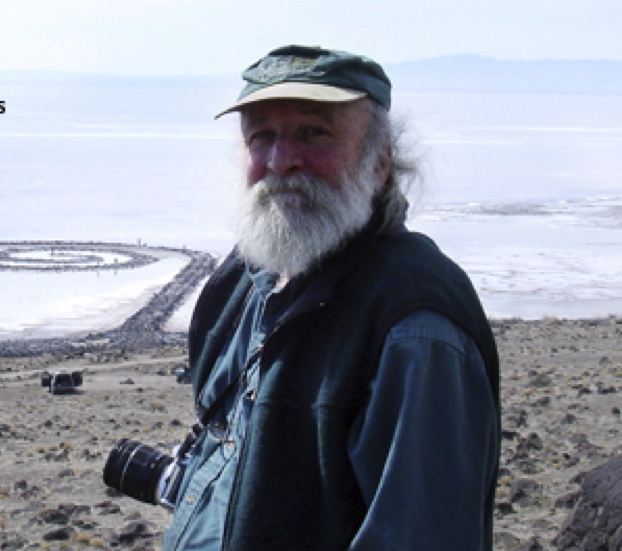 Kenneth Sassen合作论文数Department of Atmospheric Sciences, College of Natural Science and Mathematics, University of Alaska Fairbanks2
 Patrick W. Heck合作论文数2Brad W. Orr合作论文数2David P. Duda合作论文数2A. Shelby Frisch合作论文数2
 Patrick Minnis合作论文数Analytical Mechanics Associates, Inc.2
 Robert J. Zamora合作论文数2M. T. Decker合作论文数2Stephen K. Cox合作论文数2RO Knuteson合作论文数1R CAIAZZA合作论文数1




