All Supplementary Figures are provided in PDF format with the corresponding legend after each figure. Supplementary Figure 1. Genetic and clinical composition of the TRACERx Renal cohort Supplementary Figure 2. Comparison between transcriptional inter and intratumour heterogeneity Supplementary Figure 3. Representation of I-TED to measure transcriptional intratumour heterogeneity and robustness analysis Supplementary Figure 4. Transcriptional ITH is not associated with poorer outcomes in ccRCC Supplementary Figure 5. Subclonal 9p loss is the subclonal somatic copy-number alteration with the greatest association with transcriptional ITH Supplementary Figure 6. Variance in transcriptional intratumour heterogeneity explained by major clinico-genomic covariates Supplementary Figure 7. Association betweeen transcriptional distance between matched tumour-normal pairs of samples and distance from the tumour sample to the most-recent common ancestor (MRCA) Supplementary Figure 8. Schematic representation of the transcriptional and clonal distance calculation in this study. Supplementary Figure 9. Association between transcriptional and clonal distance between primary-metastasis pairs of samples Supplementary Figure 10. Similarity between primary and matched metastases for different transcriptional signatures depending on the detection of a seeding clone in the primary tumour region Supplementary Figure 11. Schematic representation of the assignment of gene expression to clones Supplementary Figure 12. Heatmap with the results of differential expression between 9p or 14q loss samples and matched 9p and 14q wild-type samples Supplementary Figure 13. Association between loss of 9p and expression of IFN I cluster genes. Supplementary Figure 14. Evaluation of changes in gene expression between 9p wild-type and 9p loss clones in published single-cell RNA-sequencing data Supplementary Figure 15. Survival in patients with high or low proliferation scores and 9p loss or 9p wild-type status Supplementary Figure 16. Validation of ENPP1 overexpression observed in RNA-Sequencing with multiplex immunofluorescence Supplementary Figure 17. Association between TME composition and expression of ENPP1 and SLC19A1 Supplementary Figure 18. Survival of ccRCC patients in TRACERx Renal and TCGA when combining aneuploidy and expression of SLC19A1 and ENPP1 Supplementary Figure 19. Association between overexpression of SLC19A1 and survival across multiple tumour types Supplementary Figure 20. Validation of TME composition inference from bulk RNA-sequencing using immunohistochemistry Supplementary Figure 21. TME ITH is pervasive and variable in the TRACERx Renal cohort but does not correlate with clinical outcomes Supplementary Figure 22. Changes in signatures associated with TME co-occurring with the acquisition of specific drivers and/or tumour evolution Supplementary Figure 23. Evaluation of changes in populations of the TME with occurrence of different driver alterations. Supplementary Figure 24. Similarity in TCR or BCR repertoire across different regions of the primary tumour does not associate with survival Supplementary Figure 25. BCR clones can be shared across distinct samples in TRACERx Renal Supplementary Figure 26. Shared TCR clones have higher clonality in tumour samples in TRACERx Renal Supplementary Figure 27. Changes in the BCR repertoire do not associate with clonal evolution in TRACERx Renal Supplementary Figure 28. Association between simimlarity of the TCR/BCR repertoire and genetic intra-tumour heterogeneity Supplementary Figure 29. UMAP representing intra and interpatient variation in HERV expression in the TRACERx Renal cohort Supplementary Figure 30. Association between HERV expression and corresponding copy-number Supplementary Figure 31. Representation of genomic coordinates for LTR elements overexpressed in VHL altered tumour samples Supplementary Figure 32. Association between HERV expression and abundance of different TME populations Supplementary Figure 33. Representation of genomic coordinates for LTR elements significantly associated with survival
Supplementary Table S17: Regression - SV count and Mutation Rates (per MB). All results are adjusted by sex, age of sampling and stage. Results with P < 0.05 are highlighted. ChRCC, chromophobe renal cell carcinoma; CN, copy number state; LoH, loss of heterozygosity; MB, megabase; pRCC, papillary renal cell carcinoma; SNV, single nucleotide variant; SV, structural variant.
Supplementary Figure S4: Tumour-normal discrepancy of telomere length between ChRCC (n = 61), further stratified by eosinophilic (n = 13) and classical (n = 48) subtypes, and pRCC (n = 103).
Supplementary Table S21: Summary of actionability of driver genes. “OncoKB Oncogenic Annotated” refers to mutations that do not meet the definitions of a “variant of unknown significance” (Supplementary Methods S1). Trials annotated in COSMIC targeting alterations in the MET gene are only mentioned for renal cell carcinoma cohorts with other cancer cohorts ignored. Trials annotated in COSMIC involving alterations in TP53 are ignored. ChRCC, chromophobe renal cell carcinoma; CN, copy number state; pRCC, papillary renal cell carcinoma; VEP, Variant Effect Predictor.
The identification of cancer drivers is a cornerstone to the delivery of precision oncology. So far, sequencing of renal cell cancer (RCC) has largely been confined to the clear cell subtype of RCC. In contrast, sequencing analyses of the less common forms of RCC, papillary RCC (pRCC) and chromophobe RCC (ChRCC), have so far been limited. We analyzed whole-genome sequencing data on 164 tumor-normal pairs from the Genomics England 100,000 Genomes Project, providing a comprehensive, high-resolution map of copy number alterations, structural variation, and key global genomic features, including mutational signatures, intratumor heterogeneity, and analysis of extrachromosomal DNA formation. Our research establishes correlations between genomic alterations and histologic diversification and the extent to which genetically-mediated immune escape contributes to the development of these RCC subtypes.Implications: We demonstrate the distinctive genetics that characterizes pRCC and ChRCC and how this information has the potential to inform patient treatment and clinical trials.
Supplementary Figure S8a-c: Structural variant (SV) hotspot regions in ChRCC (n = 61) tumours. A, Unclassified SVs at chr5:12448–1417975. B, Deletion SVs at chr6:31880903–32589555. C, Deletion SVs at chr20:2483222-15192528.
Supplementary Table 2. Changes in ssGSEA scores from normal kidney tissue to primary ccRCC tumor in normal-primary pairs.
Supplementary Table S5: Germline mutations associated with RCC risk, and somatic mutations related to tumour hypermutation. Germline mutations of cancer susceptibility genes referenced in Yngvadottir and colleagues (2022) are also stated below. ChRCC, chromophobe renal cell carcinoma; MAF, minor allele frequency; pRCC, papillary renal cell carcinoma; SNP, single nucleotide polymorphism.
Supplementary Table 7. TCR clones identified applying miXCR to bulk RNA-Sequencing data across 243 ccRCC and kidney-adjacent normal samples in TRACERx Renal.
We conducted a single-centre retrospective study to evaluate the efficacy and safety of first-line ipilimumab and nivolumab in the management of advanced melanoma in patients treated at a single, tertiary centre. We included advanced melanoma patients treated with first-line ipilimumab and nivolumab at the Royal Marsden Hospital, London between 2013 and 2024. Patient outcomes and safety profile were assessed. 332 eligible patients were identified. 58% were male. Median age was 61 (IQR: 52-70) years. Median follow up was 59.9 (95% CI: 47.0-71.2) months. Median overall survival (OS) was 33.4 (95% CI: 26.9-51.4) months with 41% and 36% of patients being alive after 5 and 10 years. Median progression-free survival (PFS) was 8.6 (95% CI: 5.72-10.9) months and median melanoma-specific survival (MSS) was 46 (95% CI: 32-not reached) months. 3-year PFS correlated with a 10-year OS and MSS of 86% and 95% respectively. More advanced Eastern Cooperative Oncology Group performance status, raised lactate dehydrogenase and presence of brain metastases were negative prognostic factors. Any-grade immune-related adverse events (irAEs) were reported in 92.8% of patients, with 48.5% experiencing grade 3/4 toxicity. 70% of patients required systemic corticosteroids and 30% required secondary immunosuppression. While the occurrence of irAEs was associated with improved survival, higher peak corticosteroid dose impacted survival outcomes negatively. This study confirms the real-world efficacy of first-line ipilimumab and nivolumab in advanced melanoma patients, including those with adverse prognostic features. Immune-mediated toxicity remains a significant challenge and the results of this study support the development of steroid-sparing irAE management algorithms to optimise patient outcomes.
Supplementary Figure S16: Percentage of COSMIC signature mutational burden contribution for ChRCC (n = 61) samples, segregated by classical (n = 48) and eosinophilic (n = 13) subtypes, and pRCC (n = 103). ID1: slippage during DNA replication of the replicated DNA strand; ID2, slippage during DNA replication of the replicated DNA strand; ID12, unknown aetiology; SBS1, spontaneous deamination of 5-methylcytosine (clock-like signature); SBS5, unknown (clock-like signature); SBS26, defective DNA mismatch repair; SBS44, defective DNA mismatch repair.
Supplementary Table S16: Clinical Correlations with age, sex, stage and grade. Patient sex uses female sex as baseline. Results with P < 0.05 are highlighted. ChRCC, chromophobe renal cell carcinoma; CN, copy number state; LoH, loss of heterozygosity; MB, megabase; pRCC, papillary renal cell carcinoma; SNV, single nucleotide variant; SV, structural variant.
Supplementary Table S6: Summary of recurrent arm level CNA alterations. Recurrent focal regions were selected based on significance threshold Q < 0.05 from GISTIC output. ChRCC, Chromophobe renal cell carcinoma; CNA, copy number alteration; pRCC, papillary renal cell carcinoma.
Supplementary Figure S9: Number of extrachromosomal DNA (ecDNA) identified by AmpliconArchitect in ChRCC (n = 61) and pRCC (n = 103) samples.
Supplementary Table 1. Variance in gene expression for 16,716 genes passing expression filtering criteria in the TRACERx Renal study
Supplementary Figure S3: Overview of structural-variant-calling pipeline. BAM, binary sequence alignment map; PCAWG, The Pan-Cancer Analysis of Whole Genomes; SV, structural variant.
 Samra Turajlic合作论文数The Francis Crick Institute187
 Paolo A. Ascierto合作论文数Melanoma, Cancer Immunotherapy and Development Therapeutics Oncology Unit, Istituto Nazionale Tumori IRCCS Fondazione “G. Pascale158
 Dirk Schadendorf合作论文数Clinic for Dermatology, University Hospital Essen;University of Duisburg-Essen;West German Tumor Center118
 Georgina Long合作论文数Faculty of Medicine and Health, The University of Sydney;Melanoma Institute Australia113
 Jean Jacques Grob合作论文数Dermatology Department, Aix-Marseille University;Hôpital De La Timone106
 Charles Swanton合作论文数Cancer Evolution and Genome Instability Laboratory, The Francis Crick Institute99
 Martin Gore合作论文数97
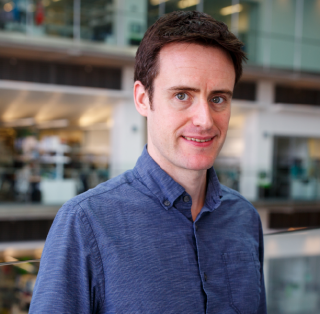 Kevin Litchfield合作论文数Department of Oncology, Cancer Institute, Faculty of Medical Sciences, University College London97Paul Lorigan合作论文数Division of Cancer Sciences, School of Medical Sciences, Faculty of Biology, Medicine and Health, The University of Manchester87
 Caroline Robert合作论文数Dermatology Unit, Gustave Roussy;Melanoma Research Unit, INSERM 981 Paris-Sud University87Lisa Pickering合作论文数86
 Reinhard Dummer合作论文数Department of Dermatology, University Hospital Zürich86
 Victoria Atkinson合作论文数PA Southside Clinical Unit, Faculty of Health, Medicine and Behavioural Sciences, University of Queensland;Clinical School of Medicine, University of Queensland;Princess Alexandra Hospital78
 Antoni Ribas合作论文数Jonsson Comprehensive Cancer Center;Parker Institute for Cancer Immunotherapy Center, University of California Los Angeles77
 Furness Andrew Js合作论文数74
 Grant Mcarthur合作论文数Peter MacCallum Cancer Centre;Victorian Comprehesive Cancer Centre;University of Melbourne72
 John Haanen合作论文数Division of Medical Oncology, The Netherlands Cancer Institute;Department Of Clinical Oncology, Leiden University Medical Center63
 Lavinia Spain合作论文数60
 Mario Mandalà合作论文数Dipartimento di Scienze Onco-Emato-Gastroenterologiche, Università degli Studi di Perugia;Department of Medicine and Surgery, Università degli Studi di Perugia55
 Jedd Wolchok合作论文数Graduate School of Medical Sciences, Weill Cornell Medicine;Meyer Cancer Center, Weill Cornell Medicine53
 Rowan Andrew J合作论文数Canc Evolut & Genome Instabil Lab, Francis Crick Inst53
 Paul Nathan合作论文数Department of Paediatrics, Temerty Faculty of Medicine, University of Toronto;Institute of Health Policy, Management and Evaluation, University of Toronto;Solid Tumor Section, Division of Haematology/Oncology, The Hospital for Sick Children52
 Matteo Carlino合作论文数Faculty of Medicine and Health, The University of Sydney;Westmead Hospital52
 Piotr Rutkowski合作论文数50
 Claus Garbe合作论文数Center for Dermatooncology, University of Tübingen;Division of Dermato-oncology, University of Tübingen;Department of Dermatology, University of Tübingen50Scott Thomas Colville Shepherd合作论文数Beatson West of Scotland Cancer Centre49
 Richard Houlston合作论文数Division of Genetics and Epidemiology, The Institute of Cancer Research49
 Michele Maio合作论文数Dipartimento di Scienze Mediche, Chirurgiche e Neuroscienze, Università degli Studi di Siena49
 Jeffrey S Weber合作论文数Grossman School of Medicine, New York University48Kim Edmonds合作论文数48
 Brigitte Dréno合作论文数Dermato-Cancérologie, CHU de Nantes;Nantes Université48Fiona Byrne合作论文数47
 Lewis Au合作论文数46
 Christian Blank合作论文数Division of Molecular Oncology and Immunology, Netherlands Cancer Institute46
 Robert J. Motzer合作论文数Memorial Sloan Kettering Cancer Center46
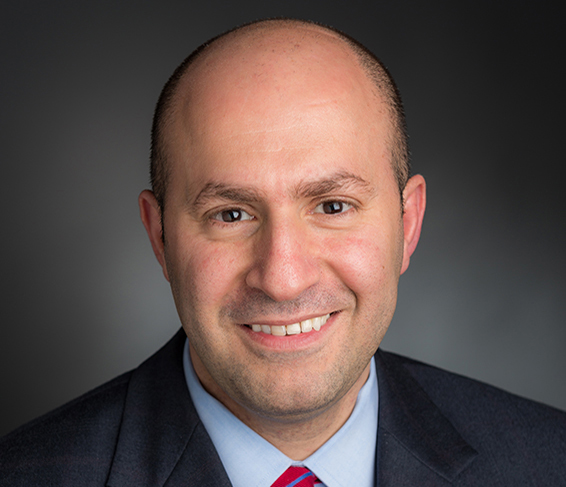 Toni Choueiri合作论文数Lank Center for Genitourinary (GU) Oncology, Dana-Farber Cancer Institute;Harvard Medical School;Brigham and Women's Hospital45
 F. Stephen Hodi Jr.合作论文数Department of Medical Oncology, Dana-Farber Cancer Institute;Center for Immuno-Oncology, Dana-Farber Brigham Cancer Center;Harvard Medical School45
 Alex J. Cornish合作论文数44
 Stéphane Dalle合作论文数Service de Dermatologie, Hôpital Lyon Sud-HCL;Université Claude Bernard Lyon 1;Cancer Research Center of Lyon44Daniel Chubb合作论文数The Taylor Laboratory, The University of Melbourne44Robert Bentham合作论文数43
 Iván Márquez Rodas合作论文数Hospital General Universitario Gregorio Marañón43
 Kate Young合作论文数43
 Ana Maria Arance合作论文数Clínic Barcelona;University of Barcelona;Oncology Department, Hospital Clinic of Barcelona43
 Kinnersley Ben合作论文数42Lisa Browning合作论文数42
 Amit Sud合作论文数41
 Laurence Albiges合作论文数Medical Oncology Department, Gustave Roussy41
 Helen Gogas合作论文数Outpatient Oncology Department, 1st Department of Medicine, Medical School, University of Athens41




