Fire refugia are unburned and low severity patches within wildfires that contribute heterogeneity that is important to retaining biodiversity and regenerating forest following fire. With increasingly intense and frequent wildfires in the Pacific Northwest, fire refugia are important for re-establishing populations sensitive to fire and maintaining resilience to future disturbances. Mapping fire refugia and delayed canopy loss is useful for understanding patterns in their distribution. The increasing abundance of satellite data and advanced analysis platforms offer the potential to map fire refugia in high detail. This study uses the Bayesian Updating of Land Cover (BULC-D) algorithm to map fire refugia and delayed canopy loss three years after fire. The algorithm compiles Normalized Burn Ratio data from Sentinel-2 and Landsat 8 and 9 and uses Bayes’ Theorem to map land cover changes. Four wildfires that occurred across Washington State in 2020 were mapped. Additionally, to consider the longevity of ‘durable’ fire refugia, the fire perimeters were analyzed to map delayed canopy loss in the years 2021–2023. The results showed that large losses in fire refugia can occur in the 1–3 years after fire due to delayed effects, but with some patches enduring.
The area burned by wildfires in Canada in 2023 is unprecedented in historical records. To help ensure the safety of communities and support the mobilization of firefighting resources, rapid detection of areas affected by wildfires is required. Satellite data are ideally suited to provide near real-time wildfire information over large areas. At the same time, clouds, smoke, and haze can obscure the collection of observations from sensors typically used for mapping purposes. Established methods using coarse spatial resolution satellites (e.g., MODIS, VIIRS) rely upon the combination of daily revisit to enable the rapid and reliable detection of large active fires, in full or in part, and the application of modeling (including spatial buffering) to infer additional, yet still obscured, areas. While timely, these initial maps of wildfire-impacted areas do not capture small fires (those smaller than 200 ha) and, importantly, are not intended to differentiate unburned areas within fire perimeters. To address these limitations, we used data from Sentinel-2A and -2B, and Landsat-8 and -9, which form a virtual constellation of four satellites to revisit and map burned area in Canada's forested ecosystems for the 2023 fire season. Availing upon the high temporal data density and using the Tracking Intra- and Inter-year Change algorithm (TIIC), an aggregate seasonal mapping of wildfires resulted in a total area affected by wildfires in 2023 of 12.74 Mha. Within this total area, 9.51 Mha of treed land cover was impacted. Shrubs and wetlands comprised most of the remaining non-treed area that was burned. Using a 2022 map of aboveground treed biomass (AGB), approximately 0.649 Pg of AGB was impacted by 2023 wildfires, representing an 11-fold increase in AGB impacts relative to a long-term annual average of treed AGB loss. Differences between the estimate of total burned area reported herein and the total burned area indicated by the Natural Resources Canada (NRCan) Fire M3 hotspot fire perimeters (18.64 Mha) were analyzed. Overall, estimates of burned area differed by 5.9 Mha, including over 1.13 Mha of water identified as burned within the NRCan perimeters. Differences in land cover and AGB impacts between the two products were also investigated and quantified. TIIC enables the near-continuous capture of areas impacted by fire through the fire season, allowing for within-year refinement of total burned area, rapid interrogation of land cover types impacted, and estimation of associated biomass consequences.
National aboveground forest biomass products enable monitoring of biomass dynamics in a consistent and repeatable manner to inform carbon accounting and sustainable forest management activities. The availability of images of the Earth's surface from a combination of Landsat and Sentinel-2A and -2B provides an opportunity and capability to track intra-year biomass dynamics availing upon a twice weekly acquisition opportunity. We developed an algorithm that leverages these spatially and spectrally compatible data sources, called Tracking Intra- and Inter-year Change (TIIC), to monitor forest change across Canada's forested ecozones (>650Mha) in near-real time. Combining the stand-replacing change information from TIIC with spatially explicit maps of aboveground biomass (AGB), we demonstrate how intra-annual and inter-annual AGB dynamics, including losses due to stand-replacing disturbances and gains from vegetation growth, can be quantified temporally and spatially. Using independent validation data, our results for the focus year 2019 indicate that TIIC, by analysing images from May 30 to September 1, can accurately detect stand-replacing disturbances across Canada's forested ecozones with an overall accuracy of 99% and correctly attribute the type of change (i.e., wildfire or mechanical removal, the latter of which includes timber harvesting) with an overall accuracy of 99%. From an initial producer's accuracy of 23% for the changed class, accuracy increases incrementally as additional images are added throughout the growing season. attaining a producer's accuracy of 98% by the end of the analysis period. Intra-year change information complements information on long-term trends derived from annual time series monitoring over several decades. Our analysis of AGB dynamics indicated that in every ecozone, widespread small positive AGB increments yielded overall AGB gains that were greater than the sum of the large, punctual AGB losses resulting from stand-replacing disturbances. Overall in 2019, forest AGB increased across Canada's forested ecozones by 2.54%. Temporally, 80% of AGB losses stemming from mechanical removal occurred over the winter and are as such concentrated at the beginning of the growing season. In contrast, AGB losses linked to fires happen more stochastically throughout the growing season and occupy a greater area. By way of disturbance type, 36% of 2019 AGB loss was attributed to mechanical removal, and 64% was attributed to wildfire. Following the approach demonstrated herein, AGB changes can be tracked at a temporal frequency informative of forest management practices and ecological processes on the landscape, thereby refining our understanding of AGB dynamics.
Water temperature and ice cover are critical characteristics of the ecological, biogeochemical, and physical functioning of a lake. Site-specific observations of temperature and ice, however, are not available for most lakes in the world. Yet this information is crucial to understanding the global role of lakes in the functioning of the bio- and hydrosphere. Here, we present the LakeTEMP dataset, referring to the similar to 1.4 million lakes globally of the HydroLAKES database with a surface area exceeding 0.1 km(2), and consisting of two subsets: (1) an observational dataset that contains lake surface water temperatures (LSWTs), derived from Landsat 8 thermal radiance observations between 2013 and 2021 extracted at the lake center points; and (2) a dataset with monthly and yearly LSWT summary statistics and predictions of average yearly ice cover durations, interpolated from the observational dataset using seasonal trendlines. All observations underwent extensive quality control and filtering, based on outlier detection, overlapping imagery removal, and the removal of observations taken from dry lake beds. Validation of the LSWT observations was carried out with in-situ data and yielded an R-2, RMSE and median of differences of 0.93, 1.71 degrees C and 0.42 degrees C, respectively. The global average yearly LSWT is 6.3 degrees C, assuming 0 degrees C during times of presumed ice cover, and 12.4 degrees C when only considering periods of open water. About 8% of all lakes never freeze, similar to 6% have short or sporadic freezing periods, and similar to 86% freeze every year, corresponding to an estimated proportion of global lake surface area of 23%, 20%, and 57%, respectively. The warmest lakes in the world (average temperatures of up to 36 degrees C) are all artificial lakes used in the power plant, mining, salt extraction, and aquaculture industries. LakeTEMP fills a crucial spatial data gap in large-scale limnological research, especially for the incorporation of small lakes and understudied geographies of remote regions. Moreover, easy linkage to other large-scale datasets that use the unique lake identifiers from HydroLAKES, most notably the LakeATLAS database (56 hydro-environmental variables for each lake including anthropogenic influences), allows to explore characteristics that may be correlated to or affected by LSWT and ice cover. The data are in an analysis-ready format and openly available at https://doi.org/10.6084/m9.figshare.23844660.
Future sea levels are expected to rise, resulting in the progressive inundation of coastal cities. Because the spatio-temporal progression of this inundation is complex, few estimates have been made of how sea level rise will impact specific features of the built environment beyond 2100. Here we provide a first-order assessment of the vulnerability of buildings to sea level rise from satellite observation in Africa, Southeast Asia, and South and Central America. We circumvent factors such as local subsidence and ice sheet dynamics by defining an inundation metric as a function of Local Sea Level Rise (LSLR), rather than time. Of the 840 million buildings in the study region, we find ~ 3.0 million at risk of inundation with 0.5m LSLR, ~ 45 million with 5m LSLR, and ~ 136 million with 20m LSLR. Our results highlight geographic variability in vulnerability and demonstrate the benefits that low-emissions pathways imply for preserving built environments.
Remote sensing can provide an alternative solution to quantify Dissolved Organic Carbon (DOC) in inland waters. Sensors embedded on Unmanned Aerial Vehicles (UAV) and satellites that can capture the DOC have already shown good relationships between DOC and the Colored Dissolved Organic Matter absorption (aCDOM.) coefficients in specific spectral regions. However, since the signal recorded by the sensors is reflectance-based, DOC estimates accuracy decreases when inverting the aCDOM. coefficients to reflectance. Thus, the main objective is to study the potential of a UAV-borne hyperspectral camera to retrieve the DOC in inland waters and to develop reflectance-based models using UAV and satellite (Landsat-8 OLI and Sentinel-2 MSI) data. Ensemble based systems (EBS) were favored in this study. The EBSUAV calibration results showed that six spectral regions (543.5, 564.5, 580.5, 609.5, 660, and 684 nm) are sensitive to DOC in waters. The EBSUAV test results showed a good concordance between measured and estimated DOC with an R-2 = Nash-criterion (NASH) = 0.86, and RMSE (Root Mean Squares Error) = 0.68 mg C/L. The EBSSAT test results also showed a strong concordance between measured and estimated DOC with R-2 = NASH = 0.92 and RMSE = 0.74 mg C/L. The spatial distribution of DOC estimates showed no dependency to other optically active elements. Nevertheless, estimates were sensitive to haze and sun glint.
Earth observation (EO) is undergoing a paradigm shift with the development of cloud-based analytical platforms supporting EO data collection and access, parallel processing, easier communication of results, and expanded accessibility. As the global community of users and the diversity of applications grow, there is a clear need for expanded educational capacity to leverage these developments and increase the impact of EO research and teaching. Drawing upon extensive conversations between educators, practitioners, and researchers, we propose three pillars that must be prioritized to prepare students, researchers, and professionals to take full advantage of the cloud-based EO paradigm and guide future growth. Plain Language Summary Earth observation (EO) data are used to understand the social, environmental, and climatic causes and consequences of changes to the Earth. Greater diversity in EO data sources and access points, the evolution of web-based and collaborative platforms for analysis and communication, and the growth of the global user community are each changing how EO science is undertaken and communicated. These advances are also changing how scientists and educators teach students. Over the past few years, a group of EO educators and researchers met and identified three central pillars for teaching today's EO students within this new paradigm. The pillars of cloud-based teaching EO science are: (a) fundamental concepts, (b) ethical considerations, and (c) engagement. These pillars can guide not only EO students but also researchers and practitioners to make valid, valuable, and engaging contributions to EO science.
State-of-the-art methodologies to monitor deforestation rely mostly on optical satellite observations. High-density optical time series can enable the detection of deforestation almost as soon as it occurs. However, deforestation monitoring in the tropics can be hindered by high cloud coverage, and thus the responsiveness of managers, enforcement agencies, and scientists. To understand the implications of cloud contamination in freely available optical data we analyzed combined time series from Landsat 7, 8, and Sentinel-2 over the tropics from 2017–2021. Datasets derived for each 30 m × 30 m of the 59.4 M km2 domain include a) number of cloud-free observations per year, b) maximum consecutive days without clear imagery within a year, and c) final date of the longest waiting period. The datasets reflect where and when data gaps in optical time series exist due to cloud contamination. Scripts to access and extend the datasets are shared and documented. The datasets can be used to prioritize areas where complementary observations, such as radar imagery, are needed for implementing effective deforestation alert systems.
Fire seasons have become increasingly variable and extreme due to changing climatological, ecological, and social conditions. Earth observation data are critical for monitoring fires and their impacts. Herein, we present a whole-system framework for identifying and synthesizing fire monitoring objectives and data needs throughout the life cycle of a fire event. The four stages of fire monitoring using Earth observation data include the following: (1) pre-fire vegetation inventories, (2) active-fire monitoring, (3) post-fire assessment, and (4) multi-scale synthesis. We identify the challenges and opportunities associated with current approaches to fire monitoring, highlighting four case studies from North American boreal, montane, and grassland ecosystems. While the case studies are localized to these ecosystems and regional contexts, they provide insights for others experiencing similar monitoring challenges worldwide. The field of remote sensing is experiencing a rapid proliferation of new data sources, providing observations that can inform all aspects of our fire monitoring framework; however, significant challenges for meeting fire monitoring objectives remain. We identify future opportunities for data sharing and rapid co-development of information products using cloud computing that benefits from open-access Earth observation and other geospatial data layers.
The ice phenology of freshwater lakes throughout the Northern Hemisphere has undergone important climateinduced shifts over the past century. In Canada's North, where freshwater lakes and wetlands cover 15 to 40% of the landscape, monitoring ice phenology is vital to understand its impacts on climate, socio-economic, ecological, and hydrological systems. The rapid and dynamic nature of ice phenology events has restricted monitoring efforts to the use of satellite sensors with frequent revisit times (e.g., MODIS, AVHRR), but their low resolution (e.g., > 500 m) limits observations to larger water bodies. However, the increased abundance of highresolution open-access satellite imagery combined with the rise of cloud-computing technologies has provided opportunities to reduce the trade-off between temporal (i.e., revisit time) and spatial (i.e., pixel size) resolution allowing for lake ice monitoring over broad scales. In this study, we present the Open Pixel-based Earth eNgine Ice (OPEN-ICE) algorithm implemented in Google Earth Engine (GEE), which classifies imagery from multiple open-access optical sensors, then combines them to construct dense annual time series of ice-water observations and estimate pixel spring breakup dates at a 30-m resolution. Using Landsat 7 ETM+, Landsat 8 OLI, and Sentinel-2 MSI scenes over lakes spanning northern latitudes, we build reference datasets to train decision trees that discriminate between ice, water, and clouds. We combine ice-water classifications from each sensor into annual time series and remove misclassifications with a temporal filter applied using a pixel-wise logistic regression. We then detect the sequence of transition from ice to water in each pixel's time series to estimate the occurrence of breakup each year. We deploy the OPEN-ICE algorithm over all freshwater pixels of Canada for the period of 2013 to 2021. Spring ice phenology events estimated by OPEN-ICE show high accuracy when compared to whole-lake breakup dates measured by the Canadian Ice Service in 105 lakes across 9 years, with mean bias errors of -1.10 and - 0.69 days for breakup start and end, respectively. We apply the OPEN-ICE algorithm to 4000 lakes across Canada and evaluate differences in breakup dates across ecozones and lake sizes. Our new OPEN-ICE tool provides accurate estimates of annual spring breakup events applicable across all boreal and arctic regions to monitor the rapid changes taking place in these vulnerable ecosystems.
AbstractAs the ability to rapidly produce classifications of satellite images grows, it will be increasingly important to have algorithms that can shift through them to separate the signal from inevitable classification noise. The purpose of this chapter is to explore how to update classification time series by blending information from multiple classifications made from a wide variety of data sources. In this lab, we will explore how to update the classification time series of the Roosevelt River found in Fortin et al. (Remote Sens Environ 238, 2020). That time series began with the 1972 launch of Landsat 1, blending evidence from 10 sensors and more than 140 images to show the evolution of the area until 2016. How has it changed since 2016? What new tools and data streams might we tap to understand the land surface through time?
Cropland expansion is expected to increase across sub-Saharan African (SSA) countries in the next thirty years to meet growing food needs across the continent. These land transformations will have cascading social and ecological impacts that can be monitored using novel Earth observation techniques that produce datasets complementary to national cropland surveys. In this study, we present a flexible Bayesian data synthesis workflow on Google Earth Engine (GEE) that can be used to fuse optical and synthetic aperture radar data and demonstrate its ability to track agricultural change at national scales. We adapted the previously developed Bayesian Updating of Land Cover (Unsupervised) algorithm (BULC-U) by integrating a shapelet and slope thresholding algorithm to identify the locations and dates of cropland expansion and implemented a tiling scheme to allow the processing of large volumes of imagery. We apply this approach to map annual cropland change from 2000 to 2015 for Zambia (750,000 km2), a country that is experiencing rapid growth in agricultural land. We applied our cropland mapping approach to a time series of unsupervised classifications developed from Landsat 5, 7, 8, Sentinel-1, and ALOS PALSAR within 1476 tiles covering Zambia. The annual cropland changes maps reveal active cropland expansion between 2000 to 2015 in Zambia, especially in the Southern, Central, and Eastern provinces. Our accuracy assessment estimates that we have identified 27.5% to 69.6% of the total cropland expansion from 2000 to 2015 in Zambia (commission errors between 6.1% to 37.6%), depending on the slope threshold. Our results demonstrate the usefulness of Bayesian data fusion and shapelet, slope-based thresholding to synthesize optical and synthetic aperture radar for monitoring agricultural changes in situations where training data are scarce. In addition, the annual cropland maps provide one of the first spatially continuous, annually incremented accounts of cropland growth in this region. Our flexible, cloud-based workflow using GEE enables multi-sensor, national-scale agricultural change monitoring at low cost for users.
As agricultural land use and climate change continue to pose increasing threats to biodiversity in sub-Saharan Africa, efforts are being made to identify areas where trade-offs between future agricultural development and terrestrial biodiversity conservation are expected to be greatest. However, little research so far has focused on freshwater biodiversity conservation in the context of agricultural development in sub-Saharan Africa. We aimed to identify lakes and lake areas where freshwater biodiversity is most likely to be affected by eutrophication and Harmful Algal Blooms (i.e., when algae multiply to the extent that they have toxic effects on people and freshwater fauna), some of the most important emerging threats to freshwater ecosystems worldwide, especially with the onset of climate change. Using novel remote-sensing techniques, we identified lakes that demonstrated high biodiversity and algal bloom levels. We calculated the richness of freshwater species and the normalized difference chlorophyll index (NDCI) to prioritize lakes in Ghana, Ethiopia, Zambia, and bordering countries, of high priority for conservation. We identified 169 priority lakes and lake areas for conservation, based on high levels of biodiversity exposed to potentially harmful algal blooms. Zambia had the most lakes identified as conservation priorities (76% of its small lakes and five 100-km2 areas in large lakes). Many of the conservation priority lakes and lake areas identified in this study were in transboundary watersheds; thus, collaborative water resource management and conservation at the watershed scale is needed. The use of remote-sensing tools to prioritize freshwater systems for conservation according to algal-bloom risk is vital in remote, undersampled world regions, especially given the increasing threat posed to freshwater biodiversity by rapidly expanding agriculture and climate change.
Knowledge of forest change type and timing is required for forest management, reporting, and science. Time series of historic satellite data (e.g. Landsat) have resulted in an invaluable record of changes in forest conditions. Natural resource management and reporting typically operate at an annual time step, yet the recent addition of data streams from compatible satellites (e.g., Sentinel-2) offer the possibility of generating frequent, management-relevant forest status assessments and maps of change. Analytical approaches that rely on a time series of observations to identify change often struggle to provide reliable estimates of change events in terminal years of the time series until subsequent, additional observations are available. Methods to meaningfully integrate observations from compatible satellite platforms can provide short-term information to augment and refine estimates of change area and type in those terminal years of the time series. In this research we fuse Landsat-8 and Sentinel-2A and -2B data streams to capture, with reduced latency, stand replacing forest change (harvest and wildfire), tagged to a temporal window of occurrence over an similar to 10,000 km(2) area of central British Columbia, Canada. We introduce a new algorithm, SLIMS (Shrinking Latency in Multiple Streams), to rapidly and reliably detect change, and then use an established Bayesian approach to meaningfully combine changes detected in the Landsat and Sentinel data streams. Our results indicate that the type and timing of stand-replacing disturbances can be identified in these forests with high accuracy. Overall, 13.9% of the study area was disturbed between the end of 2016 and the end of 2017, with the majority of disturbed area attributable to wildfire and a smaller amount attributed to forest harvesting, mostly in the winter 2016-2017 with some limited summer harvest also occurring. Overall accuracy of the change, assessed using independent validation data, was 95% +/- 2.3%. The capacity of these change results to augment a trend-based assessment of change for 2017 was also demonstrated and provides a framework for how short- and long-term change detection approaches provide complementary information that can increase the timeliness and accuracy of change area estimates in the terminal years of a time series. These findings also demonstrate the capacity to regard Landsat and Sentinel-2 sensors as elements of a virtual constellation to obtain forest change information in a timely (i.e., end of growing season) and reliable fashion over large areas.
Canada has more lakes than any other country, making comprehensive monitoring a huge challenge. As more and more satellite data become readily available, and as faster data processing systems make massive satellite data operations possible, new opportunities exist to use remote sensing to develop comprehensive assessments of water quality at very large spatial scales. In this study, we use a published empirical algorithm to estimate Secchi depth from Landsat 8 reflectance data in order to estimate water clarity in lakes across southern Canada. Combined with ancillary information on lake morphological, hydrological, and watershed geological and landuse characteristics, we were able to assess broad spatial patterns in water clarity for the first time. Ecological zones, underlying geological substrate, and lake depth had particularly strong influences on clarity across the whole country. Lakes in western mountain ecozones had significantly clearer waters than those in the prairies and plains, while lakes in sedimentary rock formations tended to have lower clarity than lakes in intrusive rock. Deep lakes were significantly clearer than shallow lakes over most of the country. Water clarity was also significantly influenced by human impact (urbanization, agriculture, and industry) in the watershed, with most lakes in high impact areas having low clarity or very low clarity. Finally, we used in situ measured data to help interpret the underlying optical water column constituents influencing clarity across Canada, and found that chlorophyll-a, total suspended solids, and color dissolved organic matter all had strong but varying underlying effects on water clarity across different ecozones. This research provides an important step towards further research on the relationship between water column optical properties and the health and vulnerability status of lakes across the country.
Disturbances such as fire play a critical role in forest ecosystems. However, anthropogenic fires can profoundly impact forests to the point of destabilizing ecosystems. In addition, fires have legacy effects on environments which may be observed in forests for decades after the fire is extinguished. Thus, understanding the extent of historic fires in a landscape is vital to understanding current forest structure and ecological processes (e.g., carbon sequestration capacity and provision of habitat) and, therefore, essential for informing land-management decisions. However, little work has been done to map forest fires pre 1980s due to the challenges of interpreting imagery from the 1970s-era Landsat Multispectral Scanner (MSS) platform. MSS imagery is distinguished from recent satellite missions through lower temporal, spatial, and spectral resolutions. Recent advances in image processing have brought the goal of high-quality MSS classifications within reach. In this study, we use deep learning, specifically UNet (a fully convolutional neural network (CNN)), to detect historic forest fires in MSS imagery for the forest-dominated regions of Quebec, Canada. While other studies have applied deep learning to present-day satellite data for land cover classification, hardly any work has specifically applied deep learning to MSS data for fire detection. We trained our UNet model on 206 MSS images that were labelled by applying thresholds to the Burned Area Index inside polygons drawn by the authors around burned areas. We then used the trained model to label burns in 5104 MSS images that were compiled to generate annual burned area maps. Our results identified (with a 95% confidence interval) 3503.95 ± 484.90 km2 of burns not previously reported in any database; this represents a 35.30 ± 3.94% increase in the total known burned area across the forest-dominated regions of Quebec between 1973 and 1982.
Coloured dissolved organic matter (CDOM) is an important water property for lake management. Remote sensing using empirical algorithms has been used to estimate CDOM, with previous studies relying on coordinated field campaigns that coincided with satellite overpass. However, this requirement reduces the maximum possible sample size for model calibration. New satellites and advances in cloud computing platforms offer opportunities to revisit assumptions about methods used for empirical algorithm calibration. Here, we explore the opportunities and limits of using median values of Landsat 8 satellite images across southern Canada to estimate CDOM. We compare models created using an expansive view of satellite image availability with those emphasizing a tight timing between the date of field sampling and the date of satellite overpass. Models trained on median band values from across multiple summer seasons performed better (adjusted R2 = 0.70, N = 233) than models for which imagery was constrained to a 30-day time window (adjusted R2 = 0.45). Model fit improved rapidly when incorporating more images, producing a model at a national scale that performed comparably to others found in more limited spatial extents. This research indicated that dense satellite imagery holds new promise for understanding relationships between in situ CDOM and satellite reflectance data across large areas.
 Morgan A. Crowley合作论文数Department of Natural Resource Sciences, McGill University20
 Mike Wulder合作论文数Canadian Forest Service, Natural Resources Canada16
 Joanne White合作论文数Canadian Forest Service, Natural Resources Canada14
 Monica Turner合作论文数Ecosystem and Landscape Ecology Lab, Department of Integrative Biology, College of Letters & Science, University of Wisconsin-Madison7
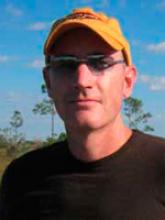 Michael Coe合作论文数The Woods Hole Research Center;Center for Sustainability and the Global Environment Institute for Environmental Studies7
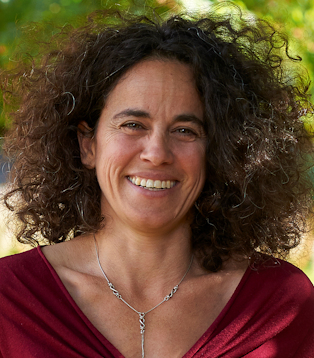 Elena Bennett合作论文数Department of Natural Resource Sciences, Faculty of Agricultural and Environmental Sciences, McGill University6
 Jonathan Foley合作论文数Project Drawdown6
 Bronwyn Rayfield合作论文数Department of Ecology and Evolutionary Biology, University of Toronto6
 Lael Parrott合作论文数Department of Biology, Irving K. Barber Faculty of Science, The University of British Columbia5
 Holland Tara合作论文数5
 Marcos Heil Costa合作论文数5
 Elijah Perez合作论文数Department of Natural Resource Sciences, McGill University4
 Andrew Gonzalez合作论文数Department of Biology, Faculty of Science, McGill University4
 Stephen R. Carpenter合作论文数Center for Limnology, College of Letters and Science, University of Wisconsin-Madison4Pelletier David合作论文数4Aurelie Botta合作论文数4
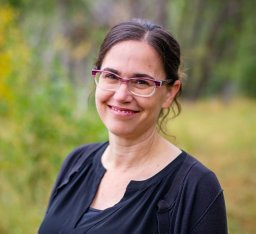 Julie A. Vano合作论文数Department of Civil and Environmental Engineering, University of Washington4
 Maria Dumitru合作论文数3José Mariscal Romero合作论文数3Flavie Pelletier合作论文数3
 Eliza Deutsch合作论文数3
 Julie Fortin合作论文数Sch Publ Policy & Global Affairs, Univ British Columbia3
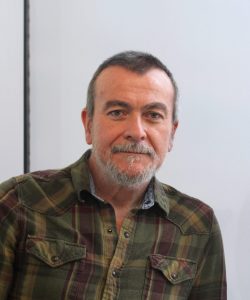 Paul Del Giorgio合作论文数Department of Biological Sciences, Faculty of Arts and Science, Universite de Montreal3
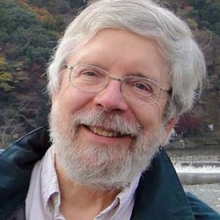 Martin J Lechowicz合作论文数Department of Biology, McGill University3
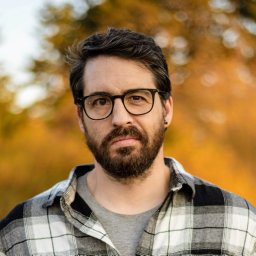 Txomin Hermosilla合作论文数Department of Forest Resources Management, University of British Columbia3
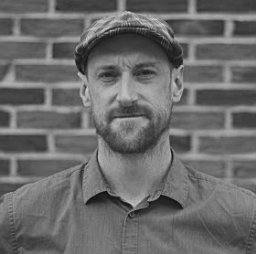 Rodolphe Gonzales合作论文数Département de Géographie, Université de Montréal3
 Marie-Josée Fortin合作论文数Department of Ecology and Evolutionary Biology, University of Toronto3
 Paul J Hanson合作论文数Environmental Sciences Division, Oak Ridge National Laboratory;Climate Change Science Institute, Oak Ridge National Laboratory3
 David Hyndman合作论文数School of Natural Sciences and Mathematics, The University of Texas at Dallas3kasimierz patalas合作论文数2Eli Baldwin合作论文数2Priscilla Baltezar合作论文数2adrien andre合作论文数2Michael Cecil合作论文数2Lucie Taliana合作论文数2Talia Koll-Egyed合作论文数2Sylvestre Delmotte合作论文数2
 Sitian Xiong合作论文数Grad Sch Geog, Clark Univ2
 Katerine Grandmont合作论文数universite de montreal2Jacky Lee合作论文数2Sj Ventura合作论文数2
 Christopher Stockdale合作论文数Natural Resources Canada, Canadian Forest Service, Northern Forestry Centre, Edmonton, AB, T6H 3E5, Canada.2Hsin-Hui Huang合作论文数2
 Marta Terrado合作论文数Barcelona Supercomputing Center (BSC)2
 Jeanine Rhemtulla合作论文数Department of Forest & Conservation Sciences, Faculty of Forestry, The University of British Columbia2
 Tianjia Liu (刘天佳)合作论文数2
 Daniel Fortier合作论文数University of Alaska Fairbanks, University of Alaska Fairbanks2
 Matthew Mitchell合作论文数Department of Forest Resources Management, Faculty of Forestry, The University of British Columbia;Institute for Resources, Environment and Sustainability, The University of British Columbia;Faculty of Land and Food Systems, University of British Columbia2
 Ziter Carly合作论文数Dept Zool, Univ Wisconsin2




