The West Florida Shelf (WFS) is an extremely important area for both commercial and recreational fisheries. However, the lack of habitat maps in this area makes planning fisheries independent monitoring surveys difficult, and hinders the ability to manage and monitor fish stocks and ecosystems over time. As of 2015, only 5% of the WFS had been mapped in high resolution using a multibeam echosounder with little effort expended to infer and verify habitat type. In 2015, The Continental Shelf Characterization, Assessment, and Mapping Project (C-SCAMP) began using a multibeam echosounder and towed underwater video to map benthic habitats and improve our understanding of fish-habitat relationships on the WFS. For this study, high resolution multibeam bathymetry and co-registered backscatter data were collected and processed. A portion of these areas were then “ground-truthed” using towed video transects to assess habitat type and identify fish. Habitat maps were created using a statistical classification model that predicts benthic habitat type based on the acoustic signature. Progress towards a unified habitat map of the West Florida Shelf will be presented including habitat interpretation of multibeam surfaces collected by other groups prior to this project, particularly focusing on those within Marine Protected Areas. Applications of the resultant habitat maps for fisheries management will be demonstrated and discussed.
Approaches applied to the control of pollution have altered substantially over the last four decades. Historically, emphasis was given to management initiatives to ensure that damage to the marine environment was avoided by limiting the introduction of substances to the sea. This was typified by the attention given to contaminants such as mercury and oil in early agreements for the prevention of marine pollution. Marine environmental protection was achieved through prior scientific evaluations of the transport and effects of substances proposed for disposal at sea and defining allowable amounts that were not thought to result in significant or unacceptable effects. This reflects largely a management and control philosophy. In the closing stages of the 20th century, however, the philosophy underlying pollution control has undergone substantial revision. Recent policy initiatives rely less on scientific assessments and place greater emphasis on policy and regulatory controls to restrict human activities potentially affecting the marine environment. During this period of change, practical pollution control and avoidance procedures have been adapted to improve their alignment with these new policy perspectives. Simultaneously, it has been widely recognized that pollutants represent only part of the problem. Other human activities such as overexploitation of fisheries, coastal development, land clearance, and the physical destruction of marine habitat are equally important, and often more serious threats to the marine environment. In recent years, the concept of marine pollution has been broadened to consider the adverse effects on the marine environment of all human activities rather than merely those associated with the release of substances. This is a most positive development, partly influenced by improved scientific understanding that has led to an improved balance of attention among the sources of environmental damage and threats.
Underwater gliders have become a critical component of coastal observing systems for measuring water column properties. They efficiently sample from the surface to the seafloor or their depth limit collecting essential density variables for weeks to months at a time, providing invaluable information to validate ocean circulation models. However, they can collect much more data, and how those data sets evolve into potential uses is not always fully appreciated. Obviously, if a truck can hold more gear without significantly hurting gas mileage, why not throw more in the back end? As such, over the past decade other sensing equipment has been incorporated into glider payloads such as fluorometers, dissolved oxygen sensors, ADCPs, nutrient sensors, and more. This has allowed expanded use of the same platform without sacrificing their primary design mission of CTD profiles. These additional sensors have enabled new research in fields such as hypoxia dead zones, red tide evolution, and water column heat content. The combination of the various sensors on the same platform will continue to enhance our understanding of the connections between processes that drive our coastal oceans. An additional research area with potential use for gliders is fisheries management. Fish stock assessment depend upon data sets from fishery dependent or independent surveys that are used to set harvest limits. In the eastern Gulf of Mexico, many economically important species are benthic and generally tied to preferred habitat types. State, federal, and academic groups are coordinating efforts to generate habitat-specific population estimates, the first step of which is creating habitat maps to guide visual or trap surveys for the fish. This is typically done by initially creating detailed bathymetric maps of regions and assessing the bottom types through video and other methods to characterize the seafloor structure, habitat and the distribution of biota. However, visually mapping the entire West Florida Shelf is not feasible. Autonomous systems like gliders should be employed as a first-level reconnaissance tool to opportunistically discover reef features or fish hotspots. For the past several years, we've attempted to assess fish populations, site fidelity, migration, and other relevant characteristics by integrating passive acoustic recorders, tag telemetry receivers, and fisheries echosounders to a glider tasked with repeated transects within a test region. Our test region has been a large, well-known artificial reef, the Gulfstream Natural Gas Pipeline, a largely linear feature between Tampa Bay and Mobile Bay. Our sampling has been seasonal and focused on the eastern portion of this feature between the 30 and 50m isobaths on the West Florida Shelf (WFS) with a total of five deployments of a single glider completed. Yet, while the linear reef is a wonderful target for the glider, gliders cannot easily traverse a straight line when coastal tidal currents are involved. So, in typical meandering fashion, the glider would spend a lot of time in the region of the pipeline, but not directly over the pipe. We accepted these data as opportunistic and another form of reconnaissance that can inform the design of follow-on surveys. During our efforts, we have used glider-collected acoustic data to identify several “hotspot” locations with high fish densities for which we do not yet have habitat maps nor measures of fish abundance. We subsequently mapped one of these regions with high resolution multibeam echosounder to create detailed bathymetric imagery of the seafloor. This has resulted in discovering previously unknown regions of habitat including seafloor ridges and demersal fish excavated zones known as “grouper holes”. This technological approach, if applied in an observing system capacity of sustained and continuous operations over a region like the West Florida Shelf, will augment existing efforts to identify and describe fish habitat and help provide data sets complimentary to fish stock assessment.
In a memorable scene in Al Gore's film on global warming, An Inconvenient Truth, the former US vice-president lampoons a cartoon of a pair of scales that weighs the Earth against a stack of gold bars. Gore's point is that any attempt to compare the merits of the two is ludicrous given their relative importance in the grand scheme of things. It would be easy to satirize reports that the organizers of next year's Rio+20 Earth Summit in Brazil are considering a two-week postponement to avoid a clash with celebrations for the Diamond Jubilee of Queen Elizabeth II in the United Kingdom, which they fear will hold more appeal for politicians, particularly those from Commonwealth countries. Easy — but not necessarily wrong. If the world is to address the myriad environmental problems that scientists have identified, then at some point it will have to give them the attention and the priority they deserve. (And that comes from a journal with its headquarters just a few miles from Buckingham Palace — sorry, Ma'am.) A good place to start would be the international negotiations on global warming that reopen in Durban, South Africa, later this month. If optimists were right to herald the tentative steps made last year in Mexico as a new dawn following the chaos of the 2009 Copenhagen meeting, then the Durban negotiations must now make a break from the past. Already, familiar battle lines have been drawn, and flags flown on stand-offs such as the future of the Kyoto Protocol, the global agreement that sets targets for emissions reductions. For years, environmental campaigners at the United Nations climate summits would stalk the corridors and the press room and rapidly correct anyone who claimed that the Kyoto Protocol expired in 2012. It was only the first phase of the agreement that would end, they insisted, finding hope in the implicit promise that other phases would follow. No longer — one of the hottest debates at Durban will probably boil down to whether the protocol will continue in its present form at all. In a Comment on page 291, Elliot Diringer of the Center for Climate and Energy Solutions in Arlington, Virginia (formerly the Pew Center on Global Climate Change) makes the case that it should not. His argument — that the protocol has become an obstacle to international progress and should be consigned to history — will be popular along the interstate in Washington DC. It is certainly pragmatic: the odds of China and the United States taking on binding emissions targets, for now, he says, are “nil”, which will keep away Japan, Canada and Russia, and so fatally punch a hole below the waterline in the common-but-differentiated approach taken under Kyoto. “A binding-or-nothing mentality,” has underpinned the climate talks for too long, Diringer says. “And the result often has been nothing.” Advocates of the multibillion-dollar carbon market established across Europe as a direct result of the Kyoto agreement would no doubt disagree with that assessment — as would the US airlines fighting tooth and nail to avoid being dragged into the emissions-trading scheme from next year. Many developing countries, too, would defend Kyoto, if only because it has made no serious demands of them and they enjoy seeing their wealthier rivals squirm. But the world has changed since the formative years of the Kyoto Protocol in the 1990s, when it neatly allocated its countries into two camps — rich and poor — divided by a common purpose. As Diringer points out, some 58% of global emissions now come from developing countries, and although a handful of rich nations still bear a heavy historical burden for global warming, it is unrealistic to expect today's politicians, who can barely look forward more than the next four or five years, to look back two centuries into the past. One of the goals of Kyoto was to make a relatively small dent in emissions, with the prospect of significantly bigger dents to come. Without the world's two largest polluters — the United States and China — on board that now seems impossible. Another goal was to establish and test an international architecture for reducing greenhouse-gas emissions and eventually scale it up. Without the world's two largest polluters, that now seems pointless. To ditch the agreement — the only global regulation on greenhouse gases — may seem a dramatic move, and in a way it is, particularly for those who have long believed in it. But the implications need not be severe. Europe can, and should, maintain its carbon market and its commitments, just as the offset mechanism developed under the protocol can continue. The real benefits of Kyoto — practical experience and institutional structures — can endure without it. Like it or not, a dogmatic adherence to the protocol is now a political liability that threatens cooperative action (however limited) over climate change — such as deals to secure finance for the most affected countries to help them with strategies for adaptation. There is no need to kill it. The treaty is already weakened and will prove hard to revive. The Durban meeting should be where the Kyoto Protocol, as we know it, goes to die. Subscribe to comments
One of the most fruitful aspects of ecological research is the search for common patterns in the bewildering variability of nature. Given current concerns about global warming, climate change, and habitat degradation, the determination and protection of biodiversity has become paramount. There are essentially three ways of describing an assemblage of organisms, and each of these gives more information on the patterns and interrelationships. First, we have the classical taxonomic method of identifying all species in the assemblage, to the highest taxonomic separation possible (usually to species) and then counting the abundance and weighing the biomass of each taxon. Secondly, we can determine the size and/or biomass spectra of all organisms in the assemblage irrespective of their identities, on the basis that organisms of different sizes or body weights play a different role in the ecosystem. Thirdly, we can determine the role that each organism can play in the system, again irrespective of its name, and define these as ecological groups or guilds—hence separating those feeding in different ways or those building tubes from their free-living associates (e.g. see Elliott et al. 2007 for a discussion of the guild concept). There are many methods of analysing assemblage data; for example Elliott (1994) identified over 25 groups of techniques for macrobenthic analysis (these are mentioned throughout this book and summarized in Chapter 11). Using these methods, when considering assemblages of marine organisms living in sediment, we can ask if there are any ‘rules’ that can be applied to patterns of abundance, size, and biomass distributions and how data on species distributions can be organized. Here, we first treat abundance, then size and biomass spectra, and finally how species assemblages can be assessed. Another way of describing assemblages is to examine the number of species and how abundance is distributed among species, although these are aspects of species diversity which will be addressed in the next chapter. In any sample of a biological community, whether marine, terrestrial, or freshwater, the immediately observable pattern is that most species are rare, represented by one or a few individuals, and only a few species are very common, represented by many individuals.
Marine sediments provide the largest habitat on planet earth, yet knowledge of the structure and function of their flora and fauna continues to be poorly described in current textbooks. This concise, readable introduction to benthic ecology builds upon the strengths of the previous edition but has been thoroughly revised throughout to incorporate the new technologies and methods that have allowed a rapid and ongoing development of the field. It explores the relationship between community structure and function, and the selection of global examples ensures an international appeal and relevance. The economic value of marine sediments increases daily, reflected in the text with a new emphasis on pollution, climate change, conservation, and management. This accessible textbook is suitable for both advanced undergraduate and graduate students who have had a general ecology course, but no further training in benthic ecology. It will also be of relevance and use to professional researchers and consultants in marine ecology and environmental science who seek a compact but comprehensive introduction to benthic ecology.
The benthos does not, of course, live in isolation from other parts of the ecosystem. Here we consider the roles that the benthos plays in the system and how the complex interactions that are found can be modelled using ecosystem models. First, we examine methods that allow us to establish food webs based not only on examining each species in the field and in laboratory feeding studies, but also using stable isotopes of carbon and nitrogen to ascertain the likely feeding mode of a species. It is relatively easy to determine the mode of feeding of some benthic organisms (see for example the excellent review of Fauchald and Jumars 1979, although this is now slightly dated and requires revision). Polychaetes have characteristic feeding structures, so one can determine from their morphology whether they are filter feeders, deposit feeders, or predators. Bivalves show similar morphological characteristics and it is easy to determine whether they are deposit or filter feeders. Some polychaetes have large jaws, e.g. the nereids, and one might assume that they are predators. Yet when Nereis vexillosa was studied in detail (Woodin 1977), it was found that it attached pieces of algae to its tube, which grew and were used for food, so-called ´gardening´. Nereids also are able to filter feed by creating a mucous bag and pumping water through their burrows, which filters the water; the mucous bag is then consumed. More recently, studies have shown varied and possibly opportunistic feeding by different benthic species; for example Christensen et al. (2000) showed how the suspension- and deposit-feeding abilities of nereids influenced sediment nutrient fluxes. These studies show that it is perhaps not so straightforward as once thought to interpret feeding mode simply from morphological features. The definition of functional groups and feeding guilds is increasingly used to help explain and interpret ecological functioning (e.g. Elliott et al. 2007 discuss the rationale behind functional groups). The eminent and immensely experienced benthic biologist Tom Pearson (2001) shows in detail that while the concept of functional groups gives us a greater understanding of the benthos, the idea is criticized by some as we do not have sufficient information about feeding types and modes of life of many benthic species.
Most (but by no means all) benthic species have larval stages which use the water column for dispersal. As indicated in the previous chapter, a key process affecting recruitment to sediment systems is the need to disperse larvae in order to colonize new areas, even to the extent of releasing larvae at spring tides when the tidal excursion will be greatest, thus effecting an even greater dispersal. Seasonal release of larvae is the norm: most species develop gametes in spring and spawn in late spring or early summer (see Rasmussen 1973 for an excellent data set of the times of planktonic larval occurrence and settlement by many important north-west European boreal benthic species). Some species, however, avoid the high competition for food at this time and release gametes in autumn and winter. Thus larvae of benthic organisms are a key and often dominating component of the spring–summer plankton and play important roles as food for planktonic species such as fish larvae. Conversely, a number of planktonic species have resting stages in sediments. The most important of these are undoubtedly the diatoms and many flagellates, and also certain calanoid copepods such as Acartia, which are of course key components of the phytoplankton and zooplankton respectively. Diatom cysts are often found, and there is increased interest in the survival and hatching processes of dinoflagellate cysts that lead to harmful algal blooms. Similarly, the seasonal occurrence of many zooplankton species results from hatching of resting stages in the sediment (see Smetacek (1995), Boero et al. (1996), Pati et al. (1999) and Boero and Bonsdorff (2008) for reviews). The implication of many important planktonic species having benthic resting phases is that by predating cysts, benthic species may be able to control abundances of planktonic species. In this context the meiofauna are important predators (Pati et al. 1999). It is now important to consider the scales of temporal variation in benthic assemblages. First, seasonal changes occur in benthic assemblages of soft sediments even in the depths of the deep sea (e.g. Hsü and Thiede 1992). In spring, as light levels and temperature increase, a plankton bloom occurs.
Despite pockmarks being one of the most widespread small-scale topographic features of the seabed, almost nothing is known of their influence on fauna. Here we present the first ecological study of fjordic pockmarks, focusing on the contrast between macrofauna inside and outside of these craters. We report an analysis of macrofauna from 27 pockmarks of the Inner Oslofjord, Norway. Five replicate grab samples were collected from each of 3 pockmarks at 3 sites plus a further control (non-pockmark) sample at each site. A single grab sample was collected from an additional 3 pockmarks at 6 sites and 6 control locations. We compared macrofaunal assemblages inside and outside of pockmarks and found important but subtle differences to those on non-pockmarked substrata. The fauna of pockmarks were typical of a disturbed fjord environment with a dominance of small opportunistic taxa, such as pioneer bivalves and polychaetes. The position of sites in the fjord gradient drove the most obvious faunal differences, but contrary to expectations, we could find no influence of pockmarks on the composition of the fauna at any taxonomic level. This makes them very unusual amongst marine topographic features, which usually have considerable influence on the nature of benthic communities. However, we found that pockmarks do significantly alter the abundances of key species and, as such, we suggest that the presence of pockmarks in the Oslofjord has a considerable cumulative influence on densities and populations of benthic organisms.
Throughout the previous chapters, we have focused on our understanding of the benthic system, its processes, structure, and functioning but, hopefully, we have also shown some of the changes to the system as the result of human activities. It is now relevant to look at the way in which management relies on and uses benthic data and information, the way in which benthic information and data are put into a wider context, and the way we manage marine sediments. Although examples in this chapter are mainly taken from European initiatives, the same examples exist in other regions. In all countries, there are many agencies and bodies involved directly or directly in the science and management of marine sediments—some carry out marine benthic studies and/or the monitoring, some require others to carry out the monitoring, and others use the benthic research and monitoring information. Throughout this book we have indicated many of the numerical techniques at our disposal for analysing benthic data, for linking them to the environmental variables, and for using them in understanding the functioning of the marine system, not least in relation to human activities. Indeed, Elliott (1996) suggested that there were approximately 26 groups of techniques for analysing the benthos and Gray (2000) describes recent methods and the progress made recently in analysing benthic data—by now we have added even more techniques. We have indicated here how some of the techniques have been adapted from other fields of ecology, such as terrestrial systems and even, in some cases, from other fields altogether; for example the main diversity index used, Shannon–Wiener H',was obtained from information and systems analysis. Figure 11.1 indicates how many of those methods link together in order to obtain a large amount of information from the benthos—it is axiomatic that no single technique gives a large amount of information and many of them rely on several techniques being used together. Figure 11.1 indicates how we start with community structural and primary variables (abundance, biomass, etc.) and move on from these into univariate and derived community variables as well as graphical techniques for community structure.
Our next major question is, how can we characterize the sediment as a habitat for biota? Marine sediments range from coarse gravels in areas subjected to much wave and current action, to muds typical of low-energy estuarine areas and to fine silts and clays in deep-sea sediments. The settling velocity of those particles and the ability of any particle to be re-suspended, moved, and redeposited depends on the prevailing hydrographic regime (e.g. see Open University 2002). The latter will in turn influence the transport of a species´ dispersal stages, especially larvae which will then be allowed to settle following metamorphosis under the appropriate hydrographic conditions (defined as hydrographic concentration). Hence the presence of fine sediments will indicate the depositing/accreting areas which may also be suitable for passively settling organisms. Clearly the particle size is of major importance in characterizing sediments, although sediments can also be categorized by their origin (fluvial, biogenic, cosmogenic, etc.) and their material (quartz, carbonates, clays, etc.) (Open University 2002). On a typical sandy beach the coarsest particles lie at the top of the beach and grade down to the finest sediments at the waterline. The top of the beach is dry and there is much windblown sand, since coarse sands drain rapidly, whereas at the lower end of the beach the sediments are wet, with frequent standing pools. Coarse sediment is found at the top of the shore because as the waves break on the beach the heaviest particles sediment out first. Finer particles remain in suspension longer and are carried seaward on the wave backwash. Beaches change their slope over the seasons, being steeper in winter and shallower in summer. A greater degree of wave energy will produce steeper beaches, as particles are pushed up the beach and so may be stored there, whereas gentle waves produce shallow, sloping beaches. Waves hitting the shore obliquely will create sediment movement as longshore drift. Subtidally, waves are important in distributing and affecting sediments down to depths of 100 m, but the effect decreases exponentially with depth and so the dominant subtidal influences on sediment transport are currents.
In this chapter the primary emphasis is on spatial scales of disturbances, and we will follow on from our earlier discussions on the mechanisms of competition and predation and the controversy over their importance in controlling species richness. Huston (1994) realized that the effects of competition, predation, and general physical disturbance were similar in that individuals were removed from the assemblage. We now show that there is a need to link these aspects with the tolerances of individual species, for example to determine in which of these cases the organisms are absent because the conditions now fall outside the optimal tolerance ranges. Thus we discuss disturbance as a general phenomenon which includes the effects of any processes that lead to a reduction in numbers of individuals and/or biomass. Disturbance includes physical disturbance as well as biological processes such as the effects of competition and predation on assemblages. The spatial scales covered range from micrometres to many hundreds of kilometres for the effects of bottom trawling, which is now considered to be one of the most serious and damaging threats to sediment habitats and assemblages. Disturbance effects caused by trawling and by pollution are considered in the following chapters. First, it is necessary to consider scale since many new insights have developed in the past few years of research. In the past couple of decades a new branch of ecology, landscape ecology, has developed, devoted to considering patterns over large areas, and a terminology of spatial scales has been defined. Grain is the first level of spatial resolution; it relates to the individual data unit and can be described as fine-grained to coarse-grained. Extent refers to the overall size of the study area. A map of 100 km2 and one of 100 000 km2 differ in extent by a factor of 1000. Grain and extent are illustrated in Fig. 6.1. A third component is lag, which is the betweensample distance. Figure 6.2 summarizes temporal and spatial scales of disturbances (modified from Zajac et al. 1998). The figure shows the main types of disturbances affecting soft-sediment systems, and separates them into natural and anthropogenic effects (see also Chapter 11, which indicates some of the management responses to these effects).
 Karl Inne Ugland合作论文数Department of Biology, University of Oslo15
 Richard O. Faulk合作论文数14
 Mike Elliott合作论文数Institute of Estuarine and Coastal Studies, University of Hull;School of Environmental Sciences, University of Hull11
 K.R. Clarke合作论文数Plymouth Marine Laboratory9Anders Bjørgesæter合作论文数9A Bjorgesater合作论文数8
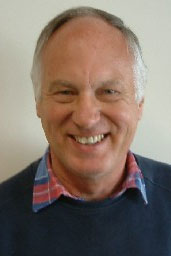 Richard Warwick合作论文数Plymouth Marine Laboratory7
 Paul Kwan-Sing Lam (林群聲)合作论文数Hong Kong Metropolitan University7B.L. Bayne合作论文数6KMY Leung合作论文数5R.F. Addison合作论文数5Jm Capuzzo合作论文数5
 Michael Norman Moore合作论文数5whkp kwok合作论文数4
 Kenneth Mei Yee Leung (梁美儀)合作论文数Department of Chemistry, City University of Hong Kong;State Key Laboratory of Marine Pollution, City University of Hong Kong4
 Simon Thrush合作论文数Institute of Marine Science, Faculty of Science, The University of Auckland4KE Ellingsen合作论文数3CSG Lui合作论文数3
 Michel J. Kaiser合作论文数The Lyell Centre, Institute of Life and Earth Sciences, School of Energy, Geoscience, Infrastructure and Society, Heriot-Watt University3
 Paul K. Dayton (Paul Dayton)合作论文数Integrative Oceanography Division, Scripps Institution of Oceanography, UC San Diego3Paul K. S. Shin合作论文数Department of Biology and Chemistry, City University of Hong Kong3T.H. Pearson合作论文数3
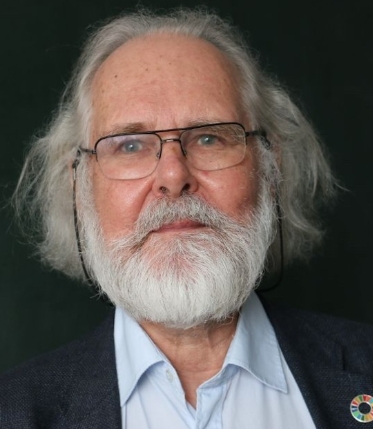 Nils Chr. Stenseth (尼尔斯·克里斯蒂安·斯坦塞斯)合作论文数Centre for Ecological and Evolutionary Synthesis, Department of Biosciences, Faculty of Mathematics and Natural Sciences, University of Oslo;Vanke School of Public Health, Tsinghua University3Pks Lam合作论文数2
 Chad Lembke合作论文数2
 Brian McGill合作论文数School of Biology and Ecology, The University of Maine2Alex Silverman合作论文数2P John D Lambshead合作论文数2Wilhelm Falck合作论文数2
 Karen Webb合作论文数2
 William G Ambrose合作论文数Ambrose Ocean Sciences2K.W.H. Kwok合作论文数2
 Marco Abbiati合作论文数Centro Interdipartimentale di Ricerca;University of Bologna;Centro Interdipartimentale di Ricerca, University of Bologna2
 Trevor J. Willis合作论文数National Institute of Water and Atmospheric Research2Farrukh B. Mirza合作论文数2M.I. Abdullah合作论文数1U Niermann合作论文数1A. Künitzer合作论文数1GCA Duineveld合作论文数1torgeir bakke合作论文数1a d mcintyre合作论文数1roy m johnson合作论文数1Rh Green合作论文数1WK Li合作论文数1Abigail Vivlamore合作论文数1kpwh kwok合作论文数1Matthew Hommeyer合作论文数1PJ JOHANNESSEN合作论文数1




