The University of South Florida (USF) College of Marine Science operates a fleet of six Teledyne Webb Research Slocum gliders as cost-effective research platforms for sampling the water column. Underwater gliders are autonomous robots that traverse the water to collect a suite of physical (e.g., temperature and salinity) and chemical (e.g., nutrients and dissolved oxygen) data to better understand the environment of coastal and open oceans. Over the past decade, the USF glider group has added sensors to obtain biological data (e.g., fluorometers, acoustic telemetry receivers, echosounders, and passive acoustic monitors) to help survey and monitor marine organisms. The data collected on these glider missions has been used in the forecasting of red tide blooms, detection of tagged aquatic animals, collection of biomass data, and recording of fish and marine mammal sounds in the Gulf of Mexico (GoM) and the Atlantic Ocean. Here we describe how our glider fleet has obtained critical biological data and is continuously evolving to better assist in addressing ecosystem-level challenges associated with global environmental changes.
Hurricane Idalia formed on 26 August 2023 and three days later rapidly intensified from a Category 1 to Category 4 strength storm in less than 24 h over the west Florida shelf. On August 30, it made landfall along Florida's Big Bend area as a Category 3 hurricane. Strikingly, despite Idalia's moderate intensity and favorable vortex structure, neither upper ocean thermal energy nor environmental vertical wind shear conditions were as favorable during its intensification from Category 2 to Category 4 as earlier in its path, raising the question of what external factors contributed to its extreme intensification during this phase. Using satellite data, underwater glider observations, and numerical model outputs, this study reveals that, in addition to the 2023 marine heatwave, an extensive riverine plume in the eastern Gulf of Mexico, extending from the Mississippi-Alabama-Florida shelf to the Straits of Florida, produced a similar to 20 m thick low-salinity layer (similar to 34-34.5 psu) and a corresponding warm upper ocean (>29 degrees C, similar to 25-30 m thick). This defined a 10-20 m thick strongly stratified barrier layer below the surface layer with buoyancy frequencies exceeding 10(-3) s(-1) that suppresses vertical mixing and became a critical factor contributing to Idalia's rapid intensification under the relatively less than favorable thermal and wind field environments. Therefore, incorporating the river plume in future forecast models appears to be essential to improve the accuracy of intensity predictions, especially in the areas affected by the plume, where stratification plays an important role in the intensification dynamics.
Shallow waters (< 30 c.a. m deep) represent at once the most accessible region of the world's oceans and coasts, but its most challenging in terms of efficient broad-scale, high-resolution mapping, hazard identification, and habitat characterization. Hazards to navigation are primarily a coastal threat and thus the requirement for high-resolution (< 1 m) maps are critical for well-traveled parts of the coastal ocean. Traditional sonar mapping approaches rely on acoustic swath widths that are proportionally wider with increasing water depths. High-resolution landscape-scale maps in shallow waters thus require numerous closely spaced transects that may be prohibitive in ship time and data processing costs. Alternatives to multibeam, single beam, and side scan sonar include satellite-derived bathymetry, airborne Light-Detection and Ranging, autonomous surface and underwater vehicles, and, increasingly, the use of crowd-sourced bathymetry to gather and disseminate depth sounder data from community participant vessels. Each of these approaches has its advantages (e.g., resolution, synopticity, calibration/validation, utility in turbid waters, efficiency for repeat measurements) and drawbacks (e.g., costs, platform availability and logistical considerations). Local requirements, challenges, conditions, and capacities will dictate which techniques or combinations render adequate resolution. As an alternative to a single technology solution, we advocate multisource coupling to blend information from multiple mapping approaches with the overall goal being a synthesized map explicitly depicting uncertainties in bathymetry due to differences in observational characteristics of technologies employed. Higher resolution technologies can be deployed where the accuracy of the map is commensurate with elevated threats/ interests. Principles of multiplatform data acquisition, data processing, and display for shallow water bathymetry are illustrated using data collected during the Tampa Bay Bathymetry Experiment conducted in 2021-2022.
Site fidelity, space use, and dispersal are commonly estimated with acoustic telemetry (AT) to help inform management and conservation. These behaviors can change with age, habitat and environmental conditions and our ability to accurately estimate them is affected by a study’s inference power (design components that affect how accurately detection data represents a species’ movements). Red snapper (Lutjanus campechanus) have been extensively studied with AT over a range of time periods and regions, although primarily at artificial reefs (AR). Here, we use large (> 12 km2) acoustic positioning arrays to monitor a study area with low-relief hard bottom, a reef ledge, and an AR. Annual fidelity to the study area was estimated to be 54%, but estimates were affected by fate uncertainty and model choice. Emigration increased with storms and in early summer. Abundance was greatest at small habitat patches but space use did not scale with patch size. Although uncommon, long-distance movements and connectivity between habitats occurred, with a maximum dispersal of 206 km. Previous red snapper AT studies varied greatly in array size, study duration, and number of fish tracked, impacting inference power. This made it difficult to compare results and highlights the need for greater standardization in AT methods.
This paper utilizes an anomaly detection algorithm to check if underwater gliders are operating normally in the unknown ocean environment. Glider pilots can be warned of the detected glider anomaly in real time, thus taking over the glider appropriately and avoiding further damage to the glider. The adopted algorithm is validated by two valuable sets of data in real glider deployments, the University of South Florida (USF) glider Stella and the Skidaway Institute of Oceanography (SkIO) glider Angus.
Underwater gliders have been widely used in oceanography for a range of applications. However, unpredictable events like shark strikes or remora attachments can lead to abnormal glider behavior or even loss of the instrument. This paper employs an anomaly detection algorithm to assess operational conditions of underwater gliders in the real-world ocean environment. Prompt alerts are provided to glider pilots upon detecting any anomaly, so that they can take control of the glider to prevent further harm. The detection algorithm is applied to multiple datasets collected in real glider deployments led by the University of Georgia's Skidaway Institute of Oceanography (SkIO) and the University of South Florida (USF). In order to demonstrate the algorithm generality, the experimental evaluation is applied to four glider deployment datasets, each highlighting various anomalies happening in different scenes. Specifically, we utilize high resolution datasets only available post-recovery to perform detailed analysis of the anomaly and compare it with pilot logs. Additionally, we simulate the online detection based on the real-time subsets of data transmitted from the glider at the surfacing events. While the real-time data may not contain as much rich information as the post-recovery one, the online detection is of great importance as it allows glider pilots to monitor potential abnormal conditions in real time.
Multi-sensor data collected with in situ and satellite instruments during August 2015 were used to understand how the three-dimensional bio-optical properties of a Loop Current Eddy (LCE) in the Gulf of Mexico (GoM) contrast those of the background waters, and how these properties are related to physical and chemical properties. With a surface radius of similar to 150 km and vertical extension to 1,400-1,500 m, the LCE was found to have highly stratified waters in two layers, with one lying just below the mixed layer (16 m) and the other coinciding with the pycnocline (similar to 120-200 m within the eddy). Strong contrasts were found in the bio-optical properties (chlorophyll -a concentration, absorption of particulate and dissolved matters, particulate backscattering, and beam-c attenuation) across the eddy core, eddy edge, and surrounding waters. Absorption coefficients (400 nm) of surface particulate and dissolved matters were similar to 4 times higher in the surrounding waters than in the eddy core, while surface reflectance (400 nm) in the eddy core was similar to 7 times higher than in the surrounding waters. The magnitude of deep chlorophyll maximum (DCM) was comparable (0.3-0.33 mg/m3) in all waters, but the depth of DCM in the eddy core (similar to 115 m) was much deeper than in the surrounding waters (60-75 m). These contrasts were found to correspond to different water masses with different physical (temperature, density, and buoyancy frequency) and chemical properties (salinity and dissolved oxygen concentration), where physical processes (river plume advection and eddy-induced downwelling) appeared to drive the changes in bio-optical properties.Loop Current Eddies (LCEs) are dominant circulation features in the Gulf of Mexico (GoM), which sporadically shed from the Loop Current (LC) with westward propagations. LCEs can transport heat, salt, dissolved oxygen, and other particulate and dissolved matters both horizontally and vertically. LCEs have been studied extensively, including their formations, shedding variability and prediction, moving paths, and interactions with topography. However, little is known about their bio-optical properties, especially in the context of their physical and chemical contrasts from the background waters. Here, using multiple observational data sets collected during August 2015, we characterize the three-dimensional bio-optical, physical, and chemical properties of a LCE. With a mean radius of similar to 150 km at the sea surface, the influence of the LCE extended to 1,400-1,500 m depth. The LCE was also found to have different bio-optical, physical, and chemical properties from the surrounding waters at both surface and depth, where physical processes appeared to drive the different water masses that led to the observed changes.
Underwater gliders are widely utilized for ocean sampling, surveillance, and other various oceanic applications. In the context of complex ocean environments, gliders may yield poor navigation performance due to strong ocean currents, thus requiring substantial human effort during the manual piloting process. To enhance navigation accuracy, we developed a real-time autonomous glider navigation software, named GENIoS_Python, which generates waypoints based on flow predictions to assist human piloting. The software is designed to closely check glider status, provide customizable experiment settings, utilize lightweight computing resources, offer stably communicate with dockservers, robustly run for extended operation time, and quantitatively compare flow estimates, which add to its value as an autonomous tool for underwater glider navigation.
The west Florida shelf (WFS; Gulf of Mexico, USA) is an important area for commercial and recreational fishing, yet much of it remains unmapped and unexplored, hindering effective monitoring of fish stocks. The goals of this study were to map the habitat at an intensively fished area on the WFS known as “The Elbow”, assess the differences in fish communities among different habitat types, and estimate the abundance of each fish taxa within the study area. High-resolution multibeam bathymetric and backscatter data were combined with high-definition (HD) video data collected from a near-bottom towed vehicle to characterize benthic habitat as well as identify and enumerate fishes. Two semi-automated statistical classifiers were implemented for obtaining substrate maps. The supervised classification (random forest) performed significantly better (p = 0.001; α = 0.05) than the unsupervised classification (k-means clustering). Additionally, we found it was important to include predictors at a range of spatial scales. Significant differences were found in the fish community composition among the different habitat types, with both substrate and vertical relief found to be important with rock substrate and higher relief areas generally associated with greater fish density. Our results are consistent with the idea that offshore hard-bottom habitats, particularly those of higher vertical relief, serve as “essential fish habitat”, as these rocky habitats account for just 4% of the study area but 65% of the estimated total fish abundance. However, sand contributes 35% to total fish abundance despite comparably low densities due to its large area, indicating the importance of including these habitats in estimates of abundance as well. This work demonstrates the utility of combining towed underwater video sampling and multibeam echosounder maps for habitat mapping and estimation of fish abundance.
The West Florida Shelf (WFS) is an extremely important area for both commercial and recreational fisheries. However, the lack of habitat maps in this area makes planning fisheries independent monitoring surveys difficult, and hinders the ability to manage and monitor fish stocks and ecosystems over time. As of 2015, only 5% of the WFS had been mapped in high resolution using a multibeam echosounder with little effort expended to infer and verify habitat type. In 2015, The Continental Shelf Characterization, Assessment, and Mapping Project (C-SCAMP) began using a multibeam echosounder and towed underwater video to map benthic habitats and improve our understanding of fish-habitat relationships on the WFS. For this study, high resolution multibeam bathymetry and co-registered backscatter data were collected and processed. A portion of these areas were then “ground-truthed” using towed video transects to assess habitat type and identify fish. Habitat maps were created using a statistical classification model that predicts benthic habitat type based on the acoustic signature. Progress towards a unified habitat map of the West Florida Shelf will be presented including habitat interpretation of multibeam surfaces collected by other groups prior to this project, particularly focusing on those within Marine Protected Areas. Applications of the resultant habitat maps for fisheries management will be demonstrated and discussed.
The pelagic Gulf of Mexico (GoM) is a complex system of dynamic physical oceanography (western boundary current, mesoscale eddies), high biological diversity, and community integration via diel vertical migration and lateral advection. Humans also heavily utilize this system, including its deep-sea components, for resource extraction, shipping, tourism, and other commercial activity. This utilization has had impacts, some with disastrous consequences. The Deepwater Horizon oil spill (DWHOS) occurred at a depth of ∼1500 m (Macondo wellhead), creating a persistent and toxic mixture of hydrocarbons and dispersant in the deep-pelagic (water column below 200 m depth) habitat. In order to assess the impacts of the DWHOS on this habitat, two large-scale research programs, described herein, were designed and executed. These programs, ONSAP and DEEPEND, aimed to quantitatively characterize the oceanic ecosystem of the northern GoM and to establish a time-series with which natural and anthropogenic changes could be detected. The approach was multi-disciplinary in nature and included in situ sampling, acoustic sensing, water column profiling and sampling, satellite remote sensing, AUV sensing, numerical modeling, genetic sequencing, and biogeochemical analyses. The synergy of these methodologies has provided new and unprecedented perspectives of an oceanic ecosystem with respect to composition, connectivity, drivers, and variability.
The use of marine offshore benthic habitats by sea turtles is poorly characterized due to the difficulty of obtaining in situ data. Understanding benthic habitat use that is important to the species’ reproduction, foraging, and migrations is critical for guiding management decisions. A towed camera-based assessment survey system (C-BASS) equipped with environmental sensors was used to characterize and assess benthic habitats on the West Florida Shelf (WFS) from 2014 to 2018. During these cruises, sea turtles were opportunistically observed during the surveys, and critical in situ data such as spatiotemporal information, species identification, habitat use, behavior, and environmental data were collected and evaluated. In total, 79 sea turtles were observed during 97 transects of approximately 2700 km of seafloor, which was recorded on 380 h of video. Several sea turtle species were spotted within the WFS, including loggerhead Caretta caretta, Kemp’s ridley Lepidochelys kempii, and green turtles Chelonia mydas. These opportunistic sightings revealed an area of high use on the WFS, an anthropogenic structure known as the Gulfstream natural gas pipeline (GSPL). C-BASS survey results suggest that 2 sea turtle species (C. caretta and L. kempii) utilize this artificial structure primarily as a resting area. We emphasize the importance of combining habitat mapping techniques (towed underwater video and multibeam bathymetry/backscatter) with tracking technology to better understand the fine-scale habitat use of sea turtles.
Measuring seafloor motion in shallow coastal water is challenging due to strong and highly variable oceanographic effects. Such measurements are potentially useful for monitoring near‐shore coastal subsidence, subsidence due to petroleum withdrawal, strain accumulation/release processes in subduction zones and submerged volcanoes, and certain freshwater applications, such as volcano deformation in caldera‐hosted lakes. We have developed a seafloor geodesy system for this environment based on an anchored spar buoy topped by high‐precision GPS. Orientation of the buoy is measured using a digital compass that provides heading, pitch, and roll information. The combined orientation and GPS tracking data are used to recover the three‐dimensional position of the seafloor marker (anchor). A test system has been deployed in Tampa Bay, Florida, for over 1 year and has weathered several major storms without incident. Even in the presence of strong tidal currents which can deflect the top of the buoy several meters from vertical, daily repeatability in the corrected three‐component position estimates for the anchor is 1–2 cm or better.
Blooms of the harmful alga, Karenia brevis on the west Florida continental shelf are thought to initiate offshore before manifesting as a nuisance along the coastline. Contributing to such blooms are a complex sequence of events occurring within oligotrophic waters, which in any given year may or may not be facilitated by the ocean circulation. Once initiation occurs, the delivery from the region of offshore origination to the region of coastline manifestation requires an upwelling circulation, whereby K.brevis cells are advected shoreward along the bottom. The 2018 K.brevis bloom was particularly intense owing to cells from the preceding 2017 bloom being reinforced by a newly formed bloom in 2018, a year when the offshore conditions in spring through early summer were again favorable for bloom development. As an event response to determine the potential for new cells to be delivered to the shore, a glider was deployed from 24 August 2018 to 17 September 2018 with a track line designed to map water properties over the hypothesized initiation region. The coastal ocean circulation during the deployment interval was generally upwelling favorable, but the passage of Tropical Storm Gordon temporarily disrupted this flow, after which K.brevis appeared along the Florida Panhandle coast. Strong upwelling then reestablished and K.brevis was subsequently observed along Florida's east coast. We describe the glider deployment, the K.brevis observations, and we use a numerical circulation model to account for the K.brevis manifestation as occurred along Florida's west, Panhandle, and east coasts. Plain Language Summary We account for the intensity and location of the 2018 Kareniabrevis red tide outbreak on the west Florida continental shelf by a combination of water property observations and numerical circulation model simulations. These confirm the initiation region being offshore, the manifestation region being along the shoreline and the delivery mechanism (from initiation to manifestation) being an upwelling favorable coastal ocean circulation. The intensity is attributed to the cells remaining in the manifestation region from the prior 2017 bloom being reinforced by cells newly formed offshore in 2018.
Underwater gliders have become a critical component of coastal observing systems for measuring water column properties. They efficiently sample from the surface to the seafloor or their depth limit collecting essential density variables for weeks to months at a time, providing invaluable information to validate ocean circulation models. However, they can collect much more data, and how those data sets evolve into potential uses is not always fully appreciated. Obviously, if a truck can hold more gear without significantly hurting gas mileage, why not throw more in the back end? As such, over the past decade other sensing equipment has been incorporated into glider payloads such as fluorometers, dissolved oxygen sensors, ADCPs, nutrient sensors, and more. This has allowed expanded use of the same platform without sacrificing their primary design mission of CTD profiles. These additional sensors have enabled new research in fields such as hypoxia dead zones, red tide evolution, and water column heat content. The combination of the various sensors on the same platform will continue to enhance our understanding of the connections between processes that drive our coastal oceans. An additional research area with potential use for gliders is fisheries management. Fish stock assessment depend upon data sets from fishery dependent or independent surveys that are used to set harvest limits. In the eastern Gulf of Mexico, many economically important species are benthic and generally tied to preferred habitat types. State, federal, and academic groups are coordinating efforts to generate habitat-specific population estimates, the first step of which is creating habitat maps to guide visual or trap surveys for the fish. This is typically done by initially creating detailed bathymetric maps of regions and assessing the bottom types through video and other methods to characterize the seafloor structure, habitat and the distribution of biota. However, visually mapping the entire West Florida Shelf is not feasible. Autonomous systems like gliders should be employed as a first-level reconnaissance tool to opportunistically discover reef features or fish hotspots. For the past several years, we've attempted to assess fish populations, site fidelity, migration, and other relevant characteristics by integrating passive acoustic recorders, tag telemetry receivers, and fisheries echosounders to a glider tasked with repeated transects within a test region. Our test region has been a large, well-known artificial reef, the Gulfstream Natural Gas Pipeline, a largely linear feature between Tampa Bay and Mobile Bay. Our sampling has been seasonal and focused on the eastern portion of this feature between the 30 and 50m isobaths on the West Florida Shelf (WFS) with a total of five deployments of a single glider completed. Yet, while the linear reef is a wonderful target for the glider, gliders cannot easily traverse a straight line when coastal tidal currents are involved. So, in typical meandering fashion, the glider would spend a lot of time in the region of the pipeline, but not directly over the pipe. We accepted these data as opportunistic and another form of reconnaissance that can inform the design of follow-on surveys. During our efforts, we have used glider-collected acoustic data to identify several “hotspot” locations with high fish densities for which we do not yet have habitat maps nor measures of fish abundance. We subsequently mapped one of these regions with high resolution multibeam echosounder to create detailed bathymetric imagery of the seafloor. This has resulted in discovering previously unknown regions of habitat including seafloor ridges and demersal fish excavated zones known as “grouper holes”. This technological approach, if applied in an observing system capacity of sustained and continuous operations over a region like the West Florida Shelf, will augment existing efforts to identify and describe fish habitat and help provide data sets complimentary to fish stock assessment.
Low-power, internally-recording multi-frequency echo sounders can acquire continuous profiles of echoes throughout the water column over long periods of time, thus providing a low-cost method to study the behavior and abundance of fish and zooplankton in the ocean. Ocean gliders are growing in importance as components of ocean observing systems, extending measurements of physical oceanography beyond those possible with moorings and expensive oceanographic research vessels. Payloads are typically composed of conductivity, temperature and pressure along with optical measures of chlorophyll reflectance and dissolved organics. The small size and low power consumption of such echo sounders now makes it practical to install them in gliders, providing the means to simultaneously measure biological metrics through the water column over extended areas and linking physical properties and primary productivity to higher trophic levels such as zooplankton and fish. We have recently installed single-beam echo-sounders with up to four acoustic frequencies in gliders. The echo-sounder (ASL Environmental Sciences' AZFP) was designed as an autonomous, moored instrument, and several modifications, mechanical, electronic and software were required to adapt it to installation and operation in gliders. The existing lower- frequency transducers were too large and heavy for the glider; their size was reduced by increasing the beam-width, and the housings were redesigned to reduce weight and improve their profile to reduce drag. The transducer housings are designed to be mounted at an angle on the vehicle body so that they are aimed vertically down during the dive phase. Several modifications were also made to the electronics chassis and shrouds to reduce weight, and the power connection was altered to operate from the vehicle battery rather than its own dedicated supply. Examples of these design alterations will be discussed. The instrument operating software was modified to allow communication and control from the vehicle, although data storage remained in the AZFP itself. In the initial case, a 200 kHz, single-beam echo-sounder was integrated and calibrated in a Slocum Webb electric ocean glider. Calibration and controlled field tests demonstrated reasonable signal-to-noise ratio, allowing for detection of plankton and fishes to greater than 75m range. The noise background was higher than that found when the AZFP is used as an autonomous unit, so improvements to noise isolation in the glider should be able to improve the signal to noise ratio in future. A data analysis workflow was developed that estimates glider position and orientation underwater to correct for depth and range of targets. Trial missions in the eastern Gulf of Mexico traveled over a submerged pipeline and a rocky reef. Acoustic backscatter signals attributed to mid-water plankton layers were co-located with oceanographic features and peaks in chlorophyll. Schools of pelagic and demersal fishes were detected and mapped over charted seafloor features. To date, three multiple frequency versions have been built and integrated into Slocum Webb G2 gliders. Several 3-frequency AZFP (38, 70 and 125 kHz) will be used to assess the spatial and temporal distribution of krill biomass in the Antarctic. Several 4-frequency instruments (125, 200, 455 and 769 kHz) have been built to study whales. A glider with a 3-frequency AZFP (38, 125 and 200 kHz) combination was deployed in Terra Nova Bay (western Ross Sea) and mapped the vertical and horizontal distribution and abundance of zooplankton and pelagic silverfish. Future developments will be aimed at adapting the AZFP to other autonomous vehicles and to reducing the effects of the vehicle's internal noise environment. Ultimately, this glider-based acoustic technology will pave the way for cost-effective, automated examination of food webs and ecosystems in regions throughout the global ocean.
An autonomous underwater glider was deployed in March 2014 to sample the Gulf Stream and its adjacent shelf waters in the South Atlantic Bight, providing a new look at cross-shelf exchange associated with Gulf Stream dynamics. Observations collected over 4 weeks reveal significant cross-shelf exchange (up to 0.5 Sv) at the shoreward edge of the Gulf Stream, which was 2 orders of magnitude larger than estimates from long-term mean hydrographic conditions. Gulf Stream frontal eddies may have contributed to some of the largest fluxes of heat (0.5 degrees C Sv) and salt (0.03 Sv g/kg) onto the shelf. We estimate that the largest upwelling event during the mission could have brought nitrate concentrations over 20 pM to within 125 m of the surface. This study demonstrates clear capabilities of autonomous underwater gliders for sampling in and near fast moving boundary currents to obtain unique and critical in situ observations effectively.
Quality data is important in making estimates of the current state of marine environments. At the Center for Ocean Technology at the University of South Florida, we have developed the Camera Based Assessment Survey System (C-BASS) towbody by combining the ease of off the shelf components with a custom software framework. C-BASS entails the integration of custom software and hardware components, off the shelf instrumentation, and web servers to distribute this data real-time to the user while storing all the parameters vital to the research endeavor.Key choices made during the design phase encompassed three main areas of focus; first and foremost was the ease of use for the operators of C-BASS while ensuring the robustness of the data collected. The topside client interface is based on a RESTful web api interface, creating a familiar environment for users entailing a modern web-browser as the only topside software for operators. The data collection entails a database synchronized to a GPS ship clock, including all towbody video, sensors, and sonar, as well as ship-sourced data such as sonars, positioning, and attitude. Therefore, in analyzing the data complex operations and custom data tables can be created from the relational SQL database. Second, there was a focus on the use of commercial off the shelf hardware components (COTS), software libraries, and applications to speed development. The base communications link was realized with digital subscriber line (DSL) modems over cables as basic as three internal conductors and a conductive outer shielding as a fourth conductor. While limiting the data sent through the uplink, the DSL modems remove the need for fiber optic cables and the operational needs associated them. Thus, the paradigm of a high bandwidth local data collection on the towbody and a low bandwidth real time link for real time monitoring of data quality during deployments, led to the development of a client-server model. Control and monitoring are done on the client side interface, while a small form factor COTS computer running Ubuntu Linux acts as the C-BASS main processor handling the server side backend, requests, and data recording.Last, prioritization was given to the ability for streamlined future enhancements. These enhancements can include additional or better cameras, new sensors, or changes to the user interface (UI). While the use of COTS components eases initial development, it also serves to keep the system in a modular design which assists later modifications. Further, the ability to utilize a wide variety of sensor interfaces allows for these components, and for a client side code display tailored to the user. However, it is in keeping an eye on being easily expandable that led to the design of sensor readers, with much of the code inherited from a generic parent function, along with the separation of such in the software framework from the tasks of data logging and data display in the UI. This paper will discuss the design choices that were made as well as the reasons for our methodology.
 Chuanmin Hu合作论文数College of Marine Science, University of South Florida15
 David C. English合作论文数College of Marine Science, University of South Florida14
 Robert H. Weisberg合作论文数College of Marine Science, University of South Florida13
 David A. Mann合作论文数University of South Florida College of Marine Science9Bradley Penta合作论文数9Sergio deRada合作论文数8
 Steve Murawski合作论文数Department of Biological Oceanography, College of Marine Science, University of South Florida8
 Tracey T. Sutton合作论文数Harbor Branch Oceanographic Institution8
 april b cook合作论文数7Alex Silverman合作论文数7
 Yonggang Liu合作论文数College of Marine Science, University of South Florida7Jennifer Brizzolara合作论文数6Sarah Grasty合作论文数6
 Kevin Mershon Boswell合作论文数Department of Oceanography and Coastal Sciences, Louisiana State University6
 Carrie Wall合作论文数5
 Isabel C. Romero合作论文数College of Marine Science, University of South Florida5
 Timothy Dixon合作论文数School of Geosciences, College of Arts & Sciences, University of South Florida;Geodesy Lab, College of Arts & Sciences, University of South Florida5
 Ron I Eytan合作论文数Department of Biological Sciences, Louisiana State University5
 Jose V Lopez合作论文数Division of Biomedical Marine Research Harbor Branch Oceanographic Institution, Inc.5
 Matthew W. Johnston合作论文数5
 Lianyuan Zheng合作论文数College of Marine Science, University of South Florida5Matthew Hommeyer合作论文数4Chris Taylor合作论文数4
 Michael Lindemuth合作论文数4
 Easson Cole G合作论文数Department of Biology, University of Alabama at Birmingham4
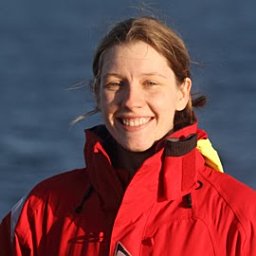 Rosanna J Milligan合作论文数Institute of Biodiversity, University of Glasgow4
 Frank Tamara M合作论文数Oceanographic Center, Nova Southeastern University4Michael Vecchione合作论文数Systematics Laboratory;National Marine Fisheries Service;National Museum of Natural History;Systematics Laboratory, National Museum of Natural History4
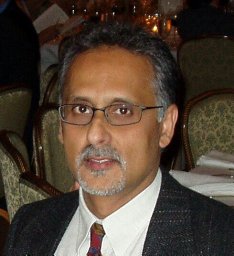 Mahmood S. Shivji合作论文数Guy Harvey Research Institute and Oceanographic Center;Nova Southeastern University;Guy Harvey Research Institute and Oceanographic Center, Nova Southeastern University4
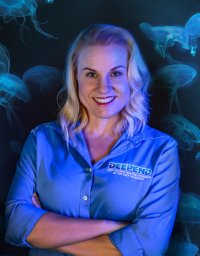 Heather D. Bracken-Grissom合作论文数Department of Biology, Brigham Young University4
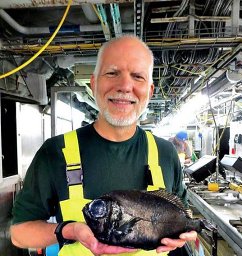 Jon A Moore合作论文数Florida Atlantic University;Wilkes Honors College;Wilkes Honors College, Florida Atlantic University4
 Stanley D. Locker合作论文数Department of Marine Science, University of South Florida4J. Christopher Taylor合作论文数3Randy Russell合作论文数3Jason Law合作论文数3
 Ruoying He合作论文数3Ruochu Yang合作论文数3s de la pena合作论文数3
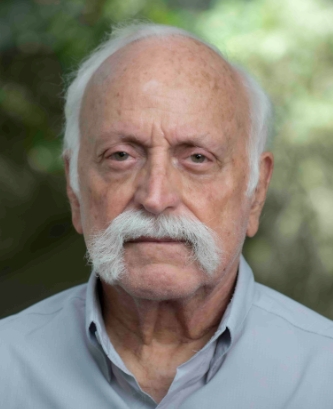 Robert H. Byrne合作论文数Department of Chemical Oceanography, College of Marine Science, University of South Florida3
 Heather Judkins合作论文数3Steven Butcher合作论文数3
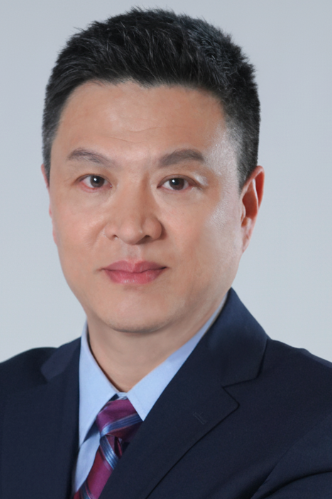 Fumin Zhang (張福民)合作论文数Department of Electronic and Computing Engineering, School of Engineering, The Hong Kong University of Science and Technology;Department of Mechanical and Aerospace Engineering, School of Engineering, The Hong Kong University of Science and Technology3
 John J. Walsh合作论文数College of Marine Science, University of South Florida3
 David Fries合作论文数Department of Intelligent Systems and Robotics, Hal Marcus College of Science and Engineering, University of West Florida;Institute for Human and Machine Cognition;Spyglass Technologies, Inc.3Catherine R. Edwards合作论文数3
 R. J. David Wells合作论文数Texas A&M University;Department of Marine Biology;Department of Marine Biology, Texas A&M University3
 Jason M. Lenes合作论文数3G Todd Kellison合作论文数3Martha S. Nizinski合作论文数National Systematics Laboratory, National Marine Fisheries Service3




