Curating knowledge from multiple siloed sources that contain both structured and unstructured data is a major challenge in many real-world applications. Pattern matching and querying represent fundamental tasks in modern data analytics that leverage this curated knowledge. The development of such applications necessitates overcoming several research challenges, including data extraction, named entity recognition, data modeling, and designing query interfaces. Moreover, the explainability of these functionalities is critical for their broader adoption. The emergence of Large Language Models (LLMs) has accelerated the development lifecycle of new capabilities. Nonetheless, there is an ongoing need for domain-specific tools tailored to user activities. The creation of digital assistants has gained considerable traction in recent years, with LLMs offering a promising avenue to develop such assistants utilizing domain-specific knowledge and assumptions. In this context, we introduce an advanced query and reasoning system, GraphAide, which constructs a knowledge graph (KG) from diverse sources and allows to query and reason over the resulting KG. GraphAide harnesses both the KG and LLMs to rapidly develop domain-specific digital assistants. It integrates design patterns from retrieval augmented generation (RAG) and the semantic web to create an agentic LLM application. GraphAide underscores the potential for streamlined and efficient development of specialized digital assistants, thereby enhancing their applicability across various domains.
How data is encoded in a knowledge graph directly influences what can be done with that data. A common problem with many encodings is that they have difficulty representing ambiguity and evolution inherent in many real-world data sets. The data encoding represented in this paper (called CARAT) is a graph-level description of our attempt to capture data that is contradictory, ambiguous and evolves over time (including deleting information). The data encoding relies on tracking assertions about subjects rather than directly tracking states. This encoding decision resolves many issues our team had experienced using other data encodings but produces a a larger graph. This is a preliminary presentation of our CARAT data encoding and our experience using it.
The discussion around "safe" programming languages has significantly increased in recent years, and is impacting how governments, industry, and academia plan to develop current and future software products. The White House Office of the National Cyber Director released a report [1] in February 2024 calling on the technical community to work towards proactively reducing attack surfaces in cyberspace, in part, specifically by adopting memory safe programming languages. While the main discourse thus far has been focused on cybersecurity, memory safety issues are also a concern in HPC, where memory related errors can result in wasted execution time, incorrect results, etc. Legacy programming languages in HPC such as C and C++ provide freedom and flexibility with memory management, but requires the developer to guarantee safety. While it is possible to develop "un-safe" code in all programming languages, "memory-safe" languages help guarantee safety by utilizing various compile time and runtime checks and validation systemsIn this paper we introduce Lamellar, an asynchronous tasking and PGAS runtime system for HPC written in Rust, one such "memory-safe" language. We describe the entire Lamellar stack, from network interfaces to safe high-level abstractions such as distributed LamellarArrays and Active Messages. The goal of our runtime is to enable end-users to develop entirely safe Rust code in their applications, limiting the use of any "unsafe" code blocks to rigorously tested code blocks within the runtime itself. We conclude by showing comparable performance against several C, C++, and Chapel implementations of a subset of the BALE kernel suite while maintaining strong memory safety principles.
The Data and Graph Generation for Modeling Adversary Activity (MAA) project developed a methodology along with scalable graph modeling and generation tools to produce realistic large-scale background activity graphs with embedded adversarial activity pathways. The technical report presents PNNL methodology, released datasets, lessons learned, and recommendations to develop graph analytic algorithms for structure-only and attributed knowledge graphs.
Reasoning about cause and effect is one of the frontiers for modern machine learning. Many causality techniques reason over a “causal graph” provided as input to the problem. When a causal graph cannot be produced from human expertise, “causal discovery” algorithms can be used to generate one from data. Unfortunately, causal discovery algorithms vary wildly in their results due to unrealistic data and modeling assumptions, so the results still need to be manually validated and adjusted. This paper presents a graph comparison tool designed to help analysts curate causal discovery results. This tool facilitates feedback loops whereby an analyst compares proposed graphs from multiple algorithms (or ensembles) and then uses insights from the comparison to refine parameters and inputs to the algorithms. We illustrate different types of comparisons and show how the interplay of causal discovery and graph comparison improves causal discovery.
This paper presents an interface and analysis technique for quickly conducting expert elicitation with the goal of determining entity importance. Our interface deploys a two-alternative choice experiment that is capable of representing knowledge graphs in an easy to interpret fashion for users with limited experience with knowledge graphs. Our analysis methodology takes advantage of conjoint analysis techniques and provides entity weights for many SMEs simultaneously. The results largely align with individual participant fits.
Ground Truth program was designed to evaluate social science modeling approaches using simulation test beds with ground truth intentionally and systematically embedded to understand and model complex Human Domain systems and their dynamics Lazer et al. (Science 369:1060–1062, 2020). Our multidisciplinary team of data scientists, statisticians, experts in Artificial Intelligence (AI) and visual analytics had a unique role on the program to investigate accuracy, reproducibility, generalizability, and robustness of the state-of-the-art (SOTA) causal structure learning approaches applied to fully observed and sampled simulated data across virtual worlds. In addition, we analyzed the feasibility of using machine learning models to predict future social behavior with and without causal knowledge explicitly embedded. In this paper, we first present our causal modeling approach to discover the causal structure of four virtual worlds produced by the simulation teams—Urban Life, Financial Governance, Disaster and Geopolitical Conflict. Our approach adapts the state-of-the-art causal discovery (including ensemble models), machine learning, data analytics, and visualization techniques to allow a human-machine team to reverse-engineer the true causal relations from sampled and fully observed data. We next present our reproducibility analysis of two research methods team’s performance using a range of causal discovery models applied to both sampled and fully observed data, and analyze their effectiveness and limitations. We further investigate the generalizability and robustness to sampling of the SOTA causal discovery approaches on additional simulated datasets with known ground truth. Our results reveal the limitations of existing causal modeling approaches when applied to large-scale, noisy, high-dimensional data with unobserved variables and unknown relationships between them. We show that the SOTA causal models explored in our experiments are not designed to take advantage from vasts amounts of data and have difficulty recovering ground truth when latent confounders are present; they do not generalize well across simulation scenarios and are not robust to sampling; they are vulnerable to data and modeling assumptions, and therefore, the results are hard to reproduce. Finally, when we outline lessons learned and provide recommendations to improve models for causal discovery and prediction of human social behavior from observational data, we highlight the importance of learning data to knowledge representations or transformations to improve causal discovery and describe the benefit of causal feature selection for predictive and prescriptive modeling.
The term "in situ processing" has evolved over the last decade to mean both a specific strategy for visualizing and analyzing data and an umbrella term for a processing paradigm. The resulting confusion makes it difficult for visualization and analysis scientists to communicate with each other and with their stakeholders. To address this problem, a group of over 50 experts convened with the goal of standardizing terminology. This paper summarizes their findings and proposes a new terminology for describing in situ systems. An important finding from this group was that in situ systems are best described via multiple, distinct axes: integration type, proximity, access, division of execution, operation controls, and output type. This paper discusses these axes, evaluates existing systems within the axes, and explores how currently used terms relate to the axes.
The subgraph matching problem is a fundamental problem in graph theory that is known to be NP-complete. In this study, performers were asked to develop algorithms to search for semantic property graphs that were subgraphs of a large knowledge graph. The templates provided contained structural information about the subgraphs and some attributes for each node and edge. There also exists a similarity measure between a set of attribute values that occurs on every node and edge. Algorithms performed well in the case where an exact match existed, but performers were also provided templates that had noise added such that there existed no match in the knowledge graph. Performers were asked to find the closest matches to those noisy subgraphs. To evaluate performance on this task, we developed a version of the graph edit distance algorithm to measure the cost of editing the template graph so that it is isomorphic in structure and attributes to the performer submission.
A major challenge in synthetic biology is properly balancing evolved and engineered functions without compromising microbial fitness. Many microbial proteins are not required for growth in regular laboratory conditions, but it is unclear what fraction of the proteome can be eliminated to increase bioproduction and maintain fitness. Here, we investigated the effects of massive genome reduction in E. coli on the expression level and evolutionary stability of a model biosynthetic pathway to produce the pigment protodeoxyviolacein (PDV). We identified an amino acid metabolism imbalance and compromised growth that were correlated with elimination of genes associated with significant proteome fraction. Proteomic profiling suggested that increased amino acid pools are responsible for an alleviation of fitness defects associated with PDV expression. In addition, all strains with genome reductions that significantly affected the proteome exhibited decreased stability of PDV production compared to the wild-type strain under persistent PDV expression conditions despite the alleviation of fitness defects. These findings exhibit the importance of balancing evolved functions with engineered ones to achieve an optimal balance of fitness and bioproduction.### Competing Interest StatementThe authors have declared no competing interest.
In the real world, data does not come neatly packaged. Instead, it typically comes as small updates from many sources with different conventions. Building a single, cohesive knowledge-base to work from requires merging small updates from many different sources. This paper outlines methods we have investigated for scoring merging routines. Given a challenge problem consisting of a large knowledge-base and a set of smaller documents, algorithms are asked to identify alignment points between the smaller document and the knowledge base. This paper surveys options for evaluating such algorithms, providing notes on strengths, weaknesses and considerations for interpretation.
The major part of graph generation is deriving connections (links) between entities (nodes). In this paper, a novel technique RAKE-IDF is introduced for key-phrase extraction across multiple documents. There are two main parts to this work: First is a Contextual Lexicon Generation generation step (in this case, White Collar Crime Lexicon) and second is a text-to-graph generation process. The text-graph generation is an ensemble model of state of the art semantic role labeling models with our key-phrase extraction technique: RAKE-IDF. These two parts are combined by augmenting standard graph with lexicon-generation derived elements to ensure interesting components are represented.
Network simulation is essential to test adversarial search problems for privacy preservation and benchmarking purposes. Different generative models have been developed for single-channel, homogeneous networks that model social networks, communication, and co-authorship. Modeling multichannel networks simultaneously with correlated channel attributes at scale compounds complexity, and including adversarial signals across channels creates a second set of burdens. We present a methodology to employ a suite of generation tools to produce realistic large-scale synthetic activity graphs with embed an adversarial activity. We describe our technical process and how we employ subject matter experts (SMEs) to improve the adversarial signal. We discuss challenges in multi-channel modeling and scalability. We also discuss challenges for high fidelity multi-channel network generation at billion-edges scale.
Measuring change is increasingly a computational task, but understanding change and its implications are fundamentally human challenges. Successful human/machine teams for streaming data analysis effectively balance data velocity with people’s capacity to ingest, reason about, and act upon the data. Computational support is critical to aiding humans with finding what is needed when it is needed. This is particularly evident in supporting complex sensemaking, situation awareness, and decision making in streaming contexts. Herein, we conceptualize human/machine teams as interacting streams of data, generated from the interactions that are core to the human/machine team activity. These streams capture the relative velocities of the human and machine activities, which allows the machine to balance the capabilities of the two halves of the system. We review the known challenges in handling interacting streams that have been distilled in computational systems. And we use this perspective to understand some of the open challenges to designing effective human/machine systems that support the disparate velocities of humans and machines.
Systems have biases. Their interfaces naturally guide a user toward specific patterns of action. For example, modern word-processors and spreadsheets are both capable of handling word wrapping, checking spelling, and calculating formulas. You could write a paper in a spreadsheet or could do simple business modeling in a wordprocessor. However, their interfaces naturally communicate which function they are designed for. Visual analytic interfaces also have biases. We outline why simple Markov models are a plausible tool for investigating that bias, even prior to user interactions, and how they might be applied to understand a priori system biases. We also discuss some anticipated difficulties in such modeling and touch briefly on what some Markov model extensions might provide.
Testing is an integral part of all software systems. In human/machine teaming systems, user inputs must be included in testing. For interactive streaming analytic systems, the user inputs must be contextualized in the dynamic data environment. We introduce a test harness for handling interacting human and machine data streams within interactive streaming analytic systems. We define the four key processes that comprise the test harness: Clock, Journal, Replay, and Database. We define a working library of replay patterns, which are modified human input streams. These can be lever-aged to characterize the system behaviors and performance. Implications and applications of the test harness for test and evaluation of human/machine systems are identified. Test harness introduces a modeling and simulation approach for broader test and evaluation of human/machine systems to bootstrap costly user studies in support of validation and verification efforts.
Correct guides, such as axes and legends, are an important part of creating an understandable visualization. Guides contextualize the other visuals by providing information about the source data and analysis process. Despite inherent ties to analysis already specified, most visualization programming libraries do reuse the existing specification. Automatic guide creation based on the analysis specification can be performed if the visualization program semantics are well defined and proper metadata is supplied. This paper presents high-level execution semantics for visualization-supporting analysis. These semantics are used with selected metadata to automatically construct guides. The Stencil visualization system includes an implementation of the presented guide system. Stencil is used to explore advantages, limitations and possible extensions to the proposed system. The principles presented can be applied to other visualization frameworks that include programmable analysis. Implementation of automatic guide creation simplifies the construction of visualizations, and can ultimately lead to higher quality visualizations.
Streaming data is always changing. Incremental results are incomplete, but often useful in their own right. Data analysis and rendering compete with each other for computational resources and access to core data structures because they are executing concurrently. This paper presents a set of data structures that ensures a visualization is internally consistent, and therefore interpretable. The data structures are based on persistent data structures, as commonly found in functional programming, but made more efficient by incorporating computational epochs. This paper also provides a definition for "consistency" that can be applied to visualizations. These data structures are used in the Stencil visualization system, which is used to benchmark the impact of epoch consistency. The net result of employing these data structures is that internally consistent incremental results are displayed as often as hardware allows without significantly impeding data loading.
Visualization plays an important role in discovery and insight. As a tool, visualization is often times utilized as a light in a sea of data providing insight to large, complex datasets. The scientific community and society at large are the beneficiaries of the utility visualization brings. As more and more data is created and consumed persons with knowledge of the visualization process, applications, methods and techniques will continue to be in demand in all fields with data visualization needs. The purposes of this panel are: (1) to discuss the need for facilitating visualization capacity building: incorporating visualization early and often into computing and other educational programs to equip students with transferrable skillsets that are in demand in the global workforce and (2) to facilitate a discussion on what knowledge base is needed to build and strengthen visualization capacity of users in visualization application domains.
 Andrew Lumsdaine合作论文数Paul G. Allen School of Computer Science and Engineering, University of Washington;Applied Mathematics, Computing, and Data Division, Pacific Northwest National Laboratory;Northwest Institute for Advanced Computing, University of Washington;School of Informatics and Computing, Indiana University;TileDB, Inc20
 George Chin Jr.合作论文数Pacific Northwest National Laboratory7
 Suzanne Menzel合作论文数Indiana University6
 Peter Wang合作论文数Continuum Analyt, Austin, TX 78701 USA4
 Patrick Mackey合作论文数Pacific Northwest National Laboratory4
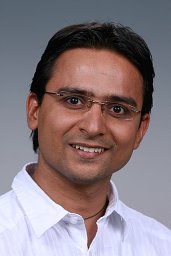 Sumit Purohit合作论文数Pacific Northwest National Lab4
 Leslie M. Blaha合作论文数4Natalie C. Heller合作论文数3Samantha S. Foley合作论文数Oak Ridge National Laboratory3Christopher L. Ebsch合作论文数2
 Rahul Deshmukh合作论文数Pacific Northwest Natl Lab2
 Brett Jefferson合作论文数Natl Secur Directorate, Pacific Northwest Natl Lab2
 Dustin Arendt合作论文数Pacific Northwest National Laboratory2
 Maria Glenski合作论文数Pacific Northwest National Laboratory2
 Svitlana Volkova合作论文数Aptima2Mark A. Whiting合作论文数1Sudhanshu Sane合作论文数1William C Nelson合作论文数1Andrew C. Bauer合作论文数1Nathalie Munoz合作论文数1Neeraj Kumar合作论文数1Gregory Roek合作论文数1Adam M. Chazin-Gray合作论文数1Deanna Auberry合作论文数1Ryan Rabello合作论文数1Vicki Lemieux合作论文数1
 Madelyn Dunning合作论文数1
 Steffen Frey合作论文数Bernoulli Institute, Faculty of Science and Engineering, University of Groningen1Nhuy Van合作论文数1jean m favre合作论文数1E. Brugger合作论文数1
 Mayanka Chandrashekar合作论文数Computational Sciences and Engineering Division, Oak Ridge National Laboratory1
 Matthew Larsen合作论文数Lawrence Livermore National Laboratory1Elliott Skomski合作论文数1
 James Kress合作论文数Oak Ridge Natl Lab, Oak Ridge, TN 37831 USA1
 Ruonan Wang合作论文数Oak Ridge Natl Lab, Oak Ridge, TN 37831 USA1Ryan D. Friese合作论文数1Ryan M. Francis合作论文数1Erdal Mutlu合作论文数Pacific Northwest National Laboratory1
 Chris Weaver合作论文数University of Oklahoma1
 Will Usher合作论文数Luminary Cloud1
 Steve Petruzza合作论文数University of Utah1
 Emily Saldanha合作论文数Pacific Northwest National Laboratory1
 Nakayasu Ernesto S合作论文数Biol Sci Div, Pacific Northwest Natl Lab1
 Carrie Nicora合作论文数Pacific Northwest National Laboratory1
 Young-Mo Kim合作论文数1
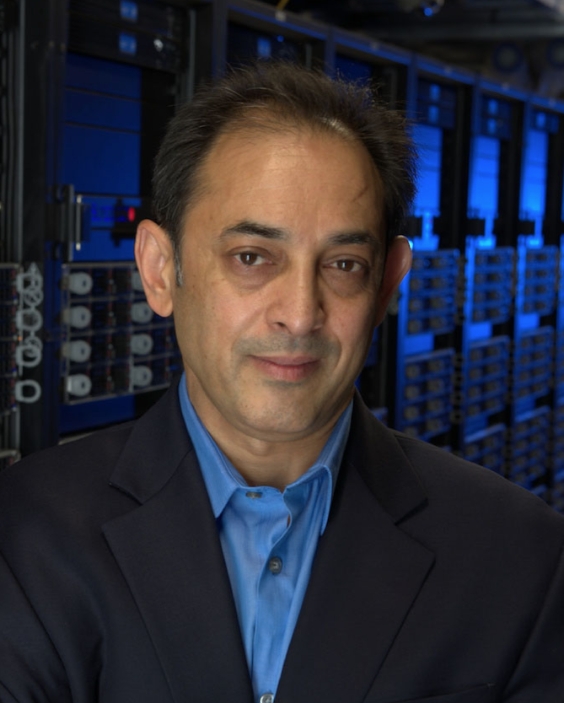 Manish Parashar合作论文数Scientific Computing and Imaging Institute, University of Utah;Kahlert School of Computing, University of Utah;Department of Computer Science, Rutgers University1
 Kristin Cook合作论文数Pacific Northwest National Laboratory1Silvio Rizzi合作论文数1




